International Research Journal of Engineering and Technology (IRJET)
e-ISSN: 2395-0056 Volume: 04 Issue: 08 | Aug -2017 www.irjet.net p-ISSN: 2395-0072© 2017, IRJET | Impact Factor value: 5.181 | ISO 9001:2008 Certified Journal | Page 354
Taguchi based Optimization of Cutting Parameters affecting Surface
Roughness in dry CNC Turning of 16MnCr5
Jitendra Kumar Verma
1, Amit Sharma
21
Research Scholar, Department of Mechanical Engineering, Gaeta Engineering College, Panipat, Haryana
2
Assistant Professor, Department of Mechanical Engineering, Geeta Engineering College, Panipat, Haryana
---***---
Abstract-
The aim of this research work is to investigate the effects of cutting parameters such as cutting speed, feed rate and depth of cut on surface roughness in CNC dry turning of 16MnCr5 material which is case hardening steel with the help of Design of Experiments. Experimental work has been carried out based on Taguchi L27 orthogonal arraydesign with three cutting parameters. Optimal cutting conditions were determined using the signal-to-noise (S/N) ratio which was calculated for roughness average (Ra) according to the smaller-the-better approach. The experimental results
were analyzed by using main effects plots and response tables for S/N ratio. Result of this study shows Depth of cut has highest dominant factor for surface roughness followed by speed and Feed rate.
Keywords: Surface Roughness, Turning, Taguchi, Regression, ANOVA
1. INTRODUCTION
International Research Journal of Engineering and Technology (IRJET)
e-ISSN: 2395-0056 Volume: 04 Issue: 08 | Aug -2017 www.irjet.net p-ISSN: 2395-0072© 2017, IRJET | Impact Factor value: 5.181 | ISO 9001:2008 Certified Journal | Page 355
carbide tool. In result they concluded that roughness of surface increases with increase in feed rate and surface roughness decreases with increase in depth of cut and depth of cut. Mite Tomov et al. [12] proposed mathematical models for surface roughness and models were verified with the help of different CNC lathe and inserts.Here we are going to obtain best combination of machining parameters namely cutting speed, feed, and depth of cut for dry CNC turning operation to produce minimum surface roughness with the help of Taguchi method for 16MnCr5 material.
2. TAGUCHI METHOD
This method is developed by Dr. Genichi Taguchi born in 1924 in Japan. This is a Fractional Factorial design method based on orthogonal array. In general main effects and interaction of two factors is considered and it is assumes that some higher order interactions are not much important. This method is used to find best set of values of controllable factors to make the design less sensitive with variation of noise, means Taguchi make a design more robust.
2.1 Signal-to-Noise ratio
Main performance measuring character of Taguchi is signal-to-Noise ratio or simply known as S/N ratio. There are three different cases for S/N ratio calculation-
i) Smaller-the-Better: It is used to minimize the response, means where output is undesirable.
⌊
∑ ⌋
ii) Larger-the-Better: This is used to maximize the response, means where output is desirable. This case can be converted is Better when we take reciprocal of all measured data and calculate the S/N ratio as Smaller-is-Better.
[
∑ ]
iii) Nominal-the-Better: This is used when neither a smaller and nor a larger value is required for response.
⌊
̅ ⌋ Where:
Measured output data of experiment Measured output data of ith experiment
̅ Mean of measured output data of experiments
σ Standard deviation σ2 Variance
3. ANOVA
It is also known asANOVA. It is used to check whether means of more than two set quantities are equal or not with the help of F-test. It is a statistical tool applied on result of Taguchi experiment to determine percentage contribution of factors. It use S/N ratio of Taguchi method for this calculation.
4. MATERIAL
International Research Journal of Engineering and Technology (IRJET)
e-ISSN: 2395-0056 Volume: 04 Issue: 08 | Aug -2017 www.irjet.net p-ISSN: 2395-0072 [image:3.595.104.548.465.783.2]© 2017, IRJET | Impact Factor value: 5.181 | ISO 9001:2008 Certified Journal | Page 356
Table -1: Chemical composition of 16MnCr55. SELECTION OF FACTORS AND THEIR LEVELS
Cutting speed in rpm, feed in mm/rev and depth of cut in mm selected as factors for design of experiment and roughness of machined surface as response.
Table -2: Factors and their levels
Factors Notation Level
1 Level 2 Level 3 Speed
(rpm) N 400 600 800
Feed
(mm/rev) F 0.06 0.12 0.18 Depth of
cut (mm) D 0.5 1.0 1.5
6. SELECTION OF ORTHOGONAL ARRAY
For design of experiment by using Taguchi method we select a L27 array. Total number of experiments performed in
experimental work is equal to 27.
Table -3: Taguchi L27 orthogonal array
Sl. No. Speed
(rpm) (mm/rev) Feed Depth of Cut (mm)
1 400 0.06 0.5
2 400 0.06 1.0
3 400 0.06 1.5
4 400 0.12 0.5
5 400 0.12 1.0
6 400 0.12 1.5
7 400 0.18 0.5
8 400 0.18 1.0
9 400 0.18 1.5
10 600 0.06 0.5
11 600 0.06 1.0
12 600 0.06 1.5
13 600 0.12 0.5
14 600 0.12 1.0
15 600 0.12 1.5
16 600 0.18 0.5
17 600 0.18 1.0
18 600 0.18 1.5
19 800 0.06 0.5
20 800 0.06 1.0
C % Mn % Si % P % S % Cr %
0.14 to 0.19
1.00 to 1.30
International Research Journal of Engineering and Technology (IRJET)
e-ISSN: 2395-0056 Volume: 04 Issue: 08 | Aug -2017 www.irjet.net p-ISSN: 2395-0072© 2017, IRJET | Impact Factor value: 5.181 | ISO 9001:2008 Certified Journal | Page 357
21 800 0.06 1.5
22 800 0.12 0.5
23 800 0.12 1.0
24 800 0.12 1.5
25 800 0.18 0.5
26 800 0.18 1.0
27 800 0.18 1.5
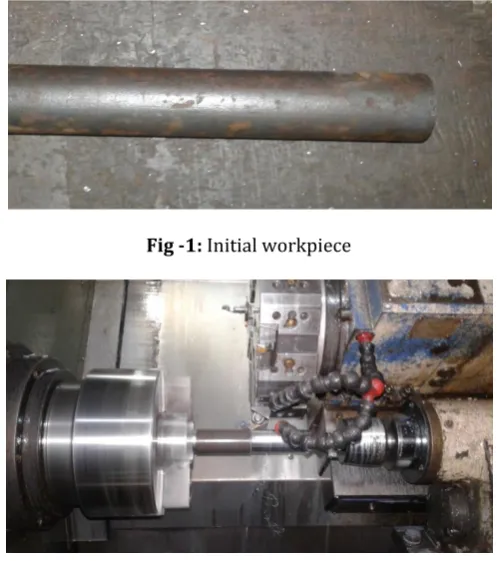
7. EXPERIMENTAL PROCEDURE
[image:4.595.173.422.284.565.2]In presented research work experimental setup consist CNC lathe machine, tungsten carbide insert, workpiece, micrometer and surface roughness tester. Turning operation is performed on 16MnCr5 material workpiece in dry environment. There are total 27 experiments are carried on workpiece with changing levels of three factors in each experiment. After that we measured surface roughness of each cut produced in different experiments.
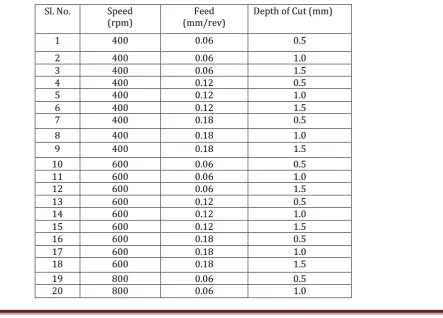
[image:4.595.178.422.595.741.2]Fig -1: Initial workpiece
Fig -2: Removal of raw material
International Research Journal of Engineering and Technology (IRJET)
e-ISSN: 2395-0056 Volume: 04 Issue: 08 | Aug -2017 www.irjet.net p-ISSN: 2395-0072 [image:5.595.174.420.74.431.2] [image:5.595.177.422.98.225.2]© 2017, IRJET | Impact Factor value: 5.181 | ISO 9001:2008 Certified Journal | Page 358
Fig -4: Numbering of experimentFig -5: Surface roughness measurement
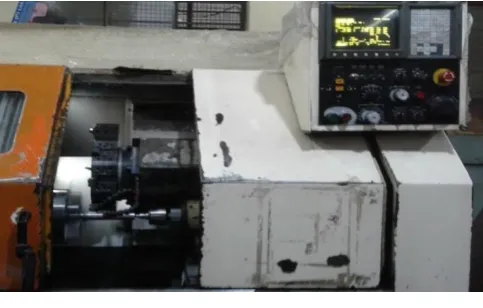
7.1 CNC Lathe Machine: Machine used in turning operation is CNC universal turning machine MIDAS 8i manufactured by GALAXY MACHINARY PVT. LTD. Turning operation is carried out on this machine, a dry environment is chosen because of environment safety.
Fig -6: CNC Midas 8i
Table -4: Specifications of CNC lathe used
Turning diameter (max) 280 mm Turning length (max) 522 mm
Speed 40 – 4000 rpm
No. of tool stations 8 Tailstock base travel 339 mm
[image:5.595.176.421.250.398.2] [image:5.595.177.419.477.631.2]International Research Journal of Engineering and Technology (IRJET)
e-ISSN: 2395-0056 Volume: 04 Issue: 08 | Aug -2017 www.irjet.net p-ISSN: 2395-0072© 2017, IRJET | Impact Factor value: 5.181 | ISO 9001:2008 Certified Journal | Page 359
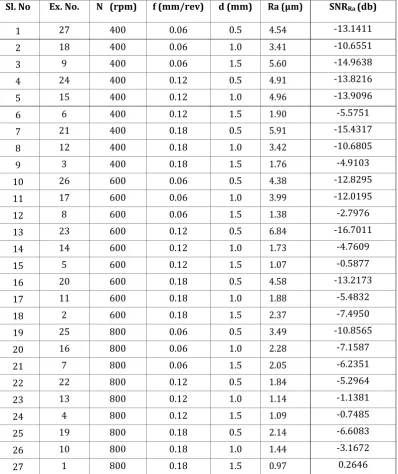
[image:6.595.101.500.143.618.2]8. RESULT AND DISCUSSION
Table -5: SNR for Surface Roughness
Table -6: Response Table for S/N Ratios
Level N f d
1 -11.454 -10.073 -11.989
2 -8.432 -6.949 -7.664
3 -4.549 -7.414 -4.783
Delta 6.905 3.124 7.206
Rank 2 3 1
Sl. No Ex. No. N (rpm) f (mm/rev) d (mm) Ra (µm) SNRRa (db)
1 27 400 0.06 0.5 4.54 -13.1411
2 18 400 0.06 1.0 3.41 -10.6551
3 9 400 0.06 1.5 5.60 -14.9638
4 24 400 0.12 0.5 4.91 -13.8216
5 15 400 0.12 1.0 4.96 -13.9096
6 6 400 0.12 1.5 1.90 -5.5751
7 21 400 0.18 0.5 5.91 -15.4317
8 12 400 0.18 1.0 3.42 -10.6805
9 3 400 0.18 1.5 1.76 -4.9103
10 26 600 0.06 0.5 4.38 -12.8295
11 17 600 0.06 1.0 3.99 -12.0195
12 8 600 0.06 1.5 1.38 -2.7976
13 23 600 0.12 0.5 6.84 -16.7011
14 14 600 0.12 1.0 1.73 -4.7609
15 5 600 0.12 1.5 1.07 -0.5877
16 20 600 0.18 0.5 4.58 -13.2173
17 11 600 0.18 1.0 1.88 -5.4832
18 2 600 0.18 1.5 2.37 -7.4950
19 25 800 0.06 0.5 3.49 -10.8565
20 16 800 0.06 1.0 2.28 -7.1587
21 7 800 0.06 1.5 2.05 -6.2351
22 22 800 0.12 0.5 1.84 -5.2964
23 13 800 0.12 1.0 1.14 -1.1381
24 4 800 0.12 1.5 1.09 -0.7485
25 19 800 0.18 0.5 2.14 -6.6083
26 10 800 0.18 1.0 1.44 -3.1672
International Research Journal of Engineering and Technology (IRJET)
e-ISSN: 2395-0056 Volume: 04 Issue: 08 | Aug -2017 www.irjet.net p-ISSN: 2395-0072 [image:7.595.161.439.113.239.2]© 2017, IRJET | Impact Factor value: 5.181 | ISO 9001:2008 Certified Journal | Page 360
Table -7: Response Table for S/N RatiosLevel N f d
1 4.046 3.458 4.292
2 3.136 2.831 2.694
3 1.827 2.719 2.021
Delta 2.219 0.739 2.271
[image:7.595.181.419.286.447.2]Rank 2 3 1
Table 7 and Table 8 show the rank of factors according to their effect on response. A factor which has high delta value shows low rank value.
Fig -7: Main effect plot for S/N ratio
[image:7.595.177.419.517.687.2]Mean of S/N ratio increases with increase in speed, for feed first increases up to feed 0.12 mm/rev and then decreases. S/N ratio increases with depth of cut.
Fig -8: Main effect plot for Means
International Research Journal of Engineering and Technology (IRJET)
e-ISSN: 2395-0056 Volume: 04 Issue: 08 | Aug -2017 www.irjet.net p-ISSN: 2395-0072 [image:8.595.174.422.72.555.2]© 2017, IRJET | Impact Factor value: 5.181 | ISO 9001:2008 Certified Journal | Page 361
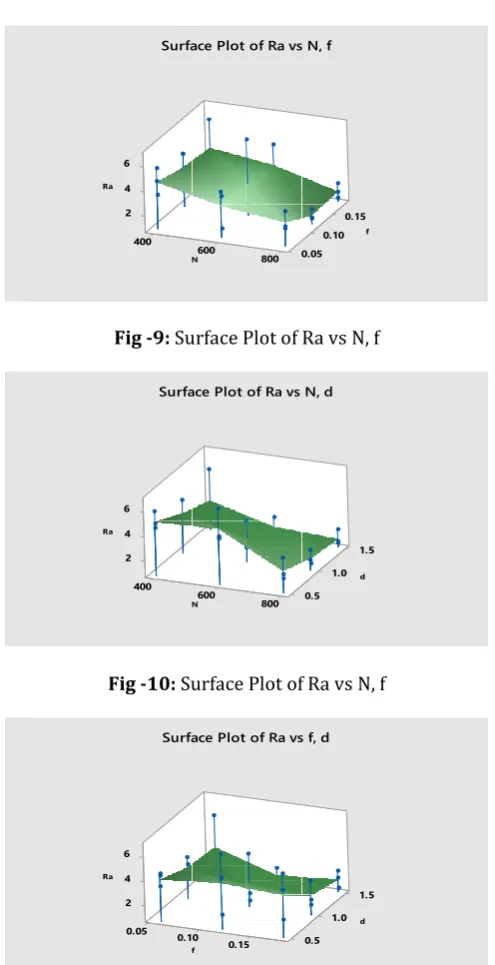
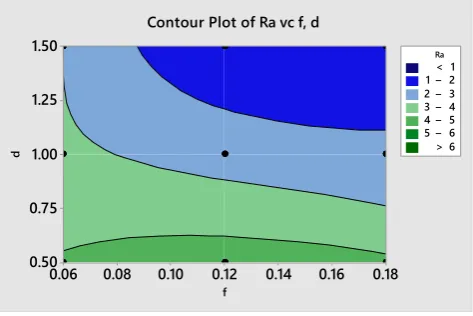
Fig -9: Surface Plot of Ra vs N, fFig -10: Surface Plot of Ra vs N, f
Fig -11: Surface Plot of Ra vs N, f
Fig -12: Contour Plot for Ra vs N, f
400 600 2 4 0.10 0.05 800 0.1 0.10 15 6 a R f N f , N s v a R f o t o l P e c a f r u S 400 600 2 4 0.5 800 1.0 1.5 6 a R d N d , N s v a R f o t o l P e c a f r u S 0.05 0.10 0.15 2 4 0.5 5 1.0 1.5 6 a R d f d , f s v a R f o t o l P e c a f r u S N f 800 700 600 500 400 0.18 0.16 0.14 0.12 0.10 0.08 0.06 > – – – – – < 1
1 2 2 3 3 4 4 5 5 6 6 Ra
International Research Journal of Engineering and Technology (IRJET)
e-ISSN: 2395-0056 Volume: 04 Issue: 08 | Aug -2017 www.irjet.net p-ISSN: 2395-0072 [image:9.595.177.418.96.248.2]© 2017, IRJET | Impact Factor value: 5.181 | ISO 9001:2008 Certified Journal | Page 362
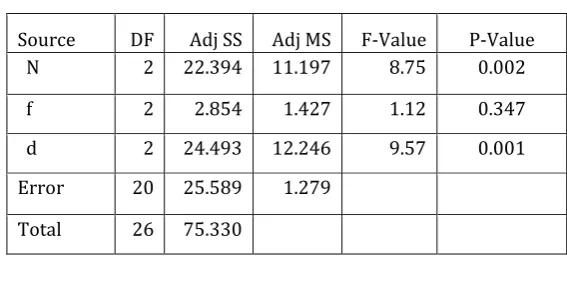
Fig -13: Contour Plot for Ra vs N, fFig -14: Contour Plot for Ra vs f, d
9. REGRESSION ANALYSIS
Regression Equation obtained from regression analysis is-
Ra = 9.34 – 0.00555 N – 6.16 f – 2.271 d
Table -8: Regression analysis coefficient
Term Coef SE Coef T-Value P-Value VIF Constant 9.34 1.08 8.62 0.000
N -0.00555 0.00129 -4.30 0.000 1.00
f -6.16 4.30 -1.43 0.165 1.00
d -2.271 0.516 -4.41 0.000 1.00 N d 800 700 600 500 400 1.50 1.25 1.00 0.75 0.50 > – – – – – < 1 1 2 2 3 3 4 4 5 5 6 6 Ra
Contour Plot of Ra vc N, d
f d 0.18 0.16 0.14 0.12 0.10 0.08 0.06 1.50 1.25 1.00 0.75 0.50 > – – – – – < 1 1 2 2 3 3 4 4 5 5 6 6 Ra
[image:9.595.180.417.285.443.2]International Research Journal of Engineering and Technology (IRJET)
e-ISSN: 2395-0056 Volume: 04 Issue: 08 | Aug -2017 www.irjet.net p-ISSN: 2395-0072© 2017, IRJET | Impact Factor value: 5.181 | ISO 9001:2008 Certified Journal | Page 363
10. ANALYSIS OF VARIANCE
[image:10.595.154.438.150.292.2]The analysis of variance is used to find out which factor is more significant effect output response.
Table -9: ANOVA table for Ra
Source DF Adj SS Adj MS F-Value P-Value N 2 22.394 11.197 8.75 0.002
f 2 2.854 1.427 1.12 0.347
d 2 24.493 12.246 9.57 0.001 Error 20 25.589 1.279
Total 26 75.330
Model Summary
S R-sq R-sq(adj) R-sq(pred) 1.13113 66.03% 55.84% 38.09%
Table 9 shows depth of cut (P = 0.001) has highest effect on surface roughness. Second highest effective factor is speed (P = 0.002) and feed (P = 0.347) has least effective factor for surface roughness.
11. CONCLUSIONS
On the basis of presented research work, we can made following conclusions-
Depth of cut has highest effect on surface roughness followed by speed and Feed rate has lowest effect on surface roughness.
Minimum surface roughness is obtained at speed 800 rpm, feed 0.12 mm/rev and depth of cut 1.5 mm.
Surface roughness obtained corresponding to optimum cutting parameters was 0.7543 µm.
REFERENCES
[1] S. Athreya, Venkatesh.(2012).Application of Taguchi method for optimization of process parameters in improving the surface roughness of lathe facing operation, International Refereed Journal of Engineering and Science.1(3):13-19.
[2] Dilbag Singh, P. Venkateswara Rao.(2007).A surface roughness prediction model for hard turning process, Int. J. Adv. Manuf. Technol.32:1115-1124.
[3] K. A. Kumar, C. Ratnam, BSN Murthy, B. S. Ben, K. R. Mohan.(2012).Optimisation of surface roughness in face turning operation in machining of EN-8, International Journal of Engineering Science and Advanced Technology.2(4):807-812.
[4] Y. Kevin Chou, Hui Song.(2005).Thermal modelling for white layer predictions in finish turning, International Journal of machine Tools and Manufacture.45:481-495.
International Research Journal of Engineering and Technology (IRJET)
e-ISSN: 2395-0056 Volume: 04 Issue: 08 | Aug -2017 www.irjet.net p-ISSN: 2395-0072© 2017, IRJET | Impact Factor value: 5.181 | ISO 9001:2008 Certified Journal | Page 364
[6] M. P. Jenarthanan, R. Jeyapaul.(2014). Evaluation of machinability index on milling of GFRP composites withdifferent fibre orientations using solid carbide end mill with modified helix angles, Int. J. Eng. Sci. Technol.6(4):1-10.
[7] S. K. Shihab, Z. A. Khan, A. Mohammad, A. N. Siddiqueed.(2014).RSM based study of cutting temperature during hard turning with multilayer coated carbide insert, Procedia Materials Science.6:1233-1242.
[8] R. Suresh, S. Basavarajappa, V. N. Gaitonde, G. L. Samuel.(2012).Machinability investigations on hardened AISI 4340 steel using coated carbide insert, Int. J. Refract. Metals Hard Mater.33:75-86.
[9] S. Z. Chavoshi, M. Tajdari.(2010).Surface roughness modelling in hard turning operation of AISI 4140 using CBN cutting tool, Int. J. Mater. Form.3(4):233-239.
[10] A. Gupta, H. Singh, A. Aggarwal.(2011).Taguchi-fuzzy multi output optimization (MOO) in high speed CNC truing of AISI P-20 tool steel, Expert System with Application.38:6822-6828.
[11] Y. Sahin, A. R. Motorcu.(2005).Surface roughness model for machining mild steel with coated carbide tool, Int. J. Mater. Form. 26:321-326.