© 2017, IRJET | Impact Factor value: 5.181 | ISO 9001:2008 Certified Journal | Page 447
DESIGN AND DEVELOPMENT OF A TRANSMISSION SYSTEM FOR AN ALL
TERRAIN VEHICLE
Dr. V.K. Saini
1, Sunil Kumar
2, Abhishek Singh
3, Abhishek Srivastava
4,
Amit Sharma
5,
Prashant Dobriyal
61
Head , Dept. of mech. Engineering, IMS engineering college, Ghaziabad, India
2Professor, Dept. of mech. Engineering, IMS engineering college, Ghaziabad, India
3,4,5,6Student, Dept. of mech. Engineering, IMS engineering college, Ghaziabad, India
---***---Abstract -
Design consideration, mathematical data, staticand dynamic analysis of transmission system. The main principle of the transmission system is to supply required torque and power generated by the engine to the wheels as per driver’s requirement. The aim of this work is to economically simplify the design of transmission system in order to increase its performance and safety standards. This work comprises of material selection, gear box design, Finite Element Analysis (FEA) and simulation to test against failure. Since the All-Terrain Vehicle (ATV), is subjected to uneven and irregular road condition, constant and continuous power transmission should be considered in its design. For this, a combination of Continuously Variable Transmission (CVT) and designed gearbox is used to obtain the required reduction ratio. Design of transmission system is based on tractive effort, vehicle resistances, grade ability, and maximum vehicle speed. Considering all the above factors required reduction ratio is calculated. Finite Element Analysis (FEA) is considered for design validation.
Key Words: Transmission System, Gear Box, ATV, Tractive Effort, Vehicle Resistance, Grade Ability, CVT, FEA.
1.INTRODUCTION
According to V.A.W Hillier & David R. Rogers [1],” Any vehicle equipped with a combustion engine as its prime mover requires a transmission system to transmit torque at an appropriate speed to the driving wheels”. Transmission system of an ATV is the one which transfers power from engine to the driving wheel. Power produced from the engine is transmitted according various load conditions. The main task of the transmission system is to use that power effectively and provide different speed & torques to the wheels according to the load imparted on the vehicle which varies from stationary to maximum speed of the vehicle. A good transmission system easily allows connection & disconnection of engine from rest of the driveline and also provides adequate fuel efficiency, fast acceleration and high speed in no time which results in maximum performance of the vehicle. According to Thomas D. Gillespie [2],” Maximum performance in longitudinal accelerator of a motor vehicle is determined by one of two Limits-Engine power or traction limits on the drive wheels. Which limits prevails may depend on vehicle speed. At low speeds tyre traction may be the
limiting factor, whereas at high speeds engine power may account for the limits”. The various types of vehicle power transmissions can be classified according to their operating principles. [1]
1. Multi-stage transmissions have a number of fixed gear ratios which can be selected manually by the driver, or automatically by a mechanical or electrical control system according to the vehicle operating status.
2.Continuously variable transmissions (CVTs) are infinitely variable b certain boundary limits achieved through hydraulic or mechanical mean.
Multi-stage transmissions rely on fixed, geometrically locked elements (i.e. gears), whereas CVTs use friction locking principles to achieve the necessary ratios. This friction locking function needs an additional energy, which reduces the overall efficiency of the gearbox itself. This inefficiency is offset by the fact that, because of the infinitely variable transmission ratios.
1.1 Continuously Variable Transmission (CVT)
CVT is the combination of two pulleys (driver and driven) and a power transmitting V-belt provide infinite number of transmission which varies from minimum to maximum ratio. Using CVT makes it is easier to maintain a constant angular velocity over a wide range. Its combination does not include gears directly so the engine speed can be varied widely along with the maximum fuel efficiency. Over all it results into maximizing the performance of the vehicle by using at most power produced by the engine.
1.2 Gearbox
A gear box is a set of gears with its casing used in vehicle for power transmission. Power from a petrol or diesel reciprocating engine transfers its power in the form of torque and angular speed to the propelling wheels of the vehicle to produce motion. The objective of the gear box is to enable the engine’s turning effect and its rotational speed output to be adjusted by choosing a range of under and overdrive gear ratio so that the vehicle responds to the driver’s requirements within the limits of the various road conditions.
© 2017, IRJET | Impact Factor value: 5.181 | ISO 9001:2008 Certified Journal | Page 448
2. Vehicle Dynamics
Vehicle dynamics under different road conditions is very important factor while designing any vehicle. We ignore air friction and examine the load variation under the tires to determine the vehicle’s limits of acceleration, road grade, and kinematic capabilities.
2.1 Parked Car on a level road
When a car is parked on level pavement, the normal force, Fz , under each of the front and rear wheels, Fz1 , Fz2 , are[3]
Where,
a1 is the distance of the car’s mass center, C, from the front axle, a2 is the distance of C from the rear axle, and l is the wheel base [3]
l = a1 + a2 (2.3)
2.2 Maximum inclination angle
The limit for increasing ɸ is where the weight vector mg goes through the contact point of the rear tire with the ground. Such an angle is called tilting angle. [3]
2.3 DESIGN CONSIDERATIONS
Mass of the vehicle = 230 kg Mass of the driver = 70 kg Static coefficient of friction (µ2) = 0.9
Height of the center of gravity (h) = 72.9234 cm Wheelbase = 151.003 cm Distance of the C.G from the front wheel centre (a1) = 85.4456 cm Distance of the C.G from the rear wheel centre (a2) = 65.7098 cm
Tire dimensions (in inches) = 22*7*12 (front) = 23*7*12 (rear)
3. Performance Characteristic
3.1 Vehicle Resistance
Vehicle resistance is an important variable while designing vehicle transmission system.
Vehicle resistance is made up of [5],
a. Wheel resistance or Rolling resistance(FR), b. Air resistance (FL), c. Gradient Resistance ( FSt )
d. Acceleration resistance ( Fa)
a. Wheel Resistance: -
© 2017, IRJET | Impact Factor value: 5.181 | ISO 9001:2008 Certified Journal | Page 449 over the tire contact area gives the reaction force R and GR is
the wheel load. Because of the asymmetrical pressure distribution in the wheel contact area of the rolling wheel, the point of application of the reaction force R is located in front of the wheel axis by the amount of eccentricity e [5].
FR = fr mF g cos αSt (3.1)
fr = The dimensionless proportionality factor fr is designated as the rolling resistance.
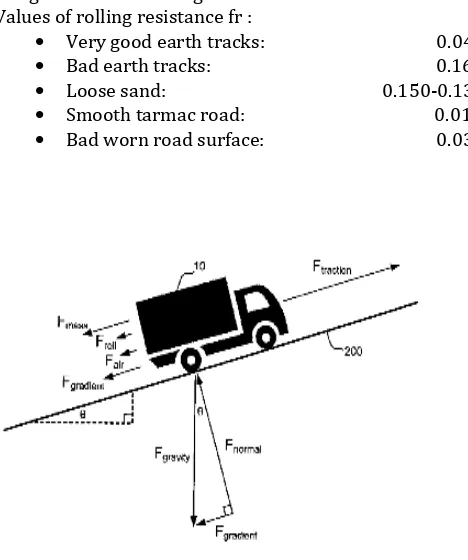
Values of rolling resistance fr :
Very good earth tracks: 0.045 Bad earth tracks: 0.160 Loose sand: 0.150-0.130 Smooth tarmac road: 0.010 Bad worn road surface: 0.035
b.
Air Resistance: -
Air flow occurs around the moving vehicle and through it for purposes of cooling and ventilation. The air resistance is made up of the pressure drag including induced drag (turbulences induced by differences in pressures), surface resistance and internal (through-flow) resistance. Drag is calculated by [5]
(3.3)
Where, ρ is 1.199kg/m3 and cW (coefficient of drag) is taken as 1.2
c. Gradient Resistance: -
The gradient resistance or downhill force relates to the slope descending force and is calculated from the weight acting at the center of gravity.
Fig.3.1 Free body diagram of a vehicle on an inclined plane [5]
FSt = mF g sin αSt (3.4)
d. Acceleration Resistance:
In addition to the driving resistance occurring in steady state motion (v = constant), inertial forces also occur during acceleration and braking. The total mass of the vehicle mF and the inertial mass of the rotating parts of the drive acceleration or brakes are the factors influencing the resistance to acceleration [5]
Fa = λ mF α (3.5) Where λ is the rotational inertia coefficient calculated from the given graph.
e. Total Driving Resistance:-
The traction FZ,B required at the drive wheels is made up of the driving resistance forces described above, and is defined as:
FZ, B = FR + FL + FSt + Fa (3.6)
4. Gear Ratio Calculation
Using above equation, we get optimum gear ratio required for need.
FR = 247.212 N from equ.3.2 FSt = 1417.949 N from equ.3.3 Vehicle velocity, v = 3.14*d*N/60 x = 110.119/x
= 2910.286/x2 from equ.3.4 Traction, FZ, B = 19.68* 0.8x/0.5342
= 53.89x Nm For limiting condition, i.e. Fa = 0
53.899 x3 = 1665.16x2 -1637.039 from equ.3.6 Total gear ratio, x = 29.5
For Cv-tech CVT [9]
Max ratio = 3:1 Min ratio = 0.45:1 Gear box reduction ratio = 9.35667
4.1 Splitting Gear ratio
According to Tudose, O. Buiga, D. Jucan, C. Stefanache (2008) [6] , the optimal design of a two stage speed reducer have various constraints such as the face width, transmission ratio and center distance affect the optimal design of any speed reducer. The transmission ratio for the first stage is almost equal to the second stage, in any optimal design solution.
Table -1: Gear Ratio
Gear ratio for first stage ( gear 1&2 ) 3.1
Gear ratio for second stage
[image:3.595.39.273.213.493.2]© 2017, IRJET | Impact Factor value: 5.181 | ISO 9001:2008 Certified Journal | Page 450
5. Design of Gears
5.1 Material for gears
The gear material should have the following properties: High tensile strength to prevent failure against
static loads
High endurance strength to withstand dynamic loads
Low coefficient of friction Good manufacturability
Generally, cast iron, steel, brass and bronze are preferred for manufacturing metallic gears with cut teeth. Commercially cut gears have a pitch line velocity of about 5 meter/second. [11]
Material used = 8620 steel S u t = ultimate tensile stress = 800MPa S y t = ultimate yield stress = 600MPa BHN = 300 Elongation = 17% Poison’s ratio = 0.25 Bulk modulus = 110GPa
5.2 Assumptions
Module for gear 1&2 = 2.5 Module for gear 3&4 = 3
5.3 Calculation
For designing if gears are made up of same material then designing should be done according to pinion gear.
For Gear 1
At high CVT ratio: - 3:1 (hill climb)
Rpm of engine at max torque = 2700 rpm
Gear 1 rpm, np1 = 2700/3 = 900 rpm Tangential velocity, v = πdN/60 =2356.196 m/s Tangential tooth load, [7,8]
WT=σ*CV*b*pc*Y (3.7) Where,
C v = Velocity Factor = 0.718 b = Face Width = 25 p = Circular Pitch = 7.3531 Y = Lewis Form Factor = 0.1084 WT = 4075.29
Power = 9.6Kw Note: - Above value of power is larger than maximum power we are going to transmit which is 7.4kw. Hence the design is safe [7].
For Gear 3
n p3 = 2700/ (3*3.15) =289.389 rpm v = πdn/60 = 1.0450 m/s Y = Lewis Form Factor = 0.114 CV = velocity factor = 0.851
B = face width = 30 Pc = pitch circle diameter = 9.424
WT = σ*cv*b*pc*y WT = 7314.17 Power, p = 7.6 kW
[image:4.595.303.535.235.477.2]Note: - Above value of power is larger than maximum power we are going to transmit which is 7.6kw. Hence the design is safe.
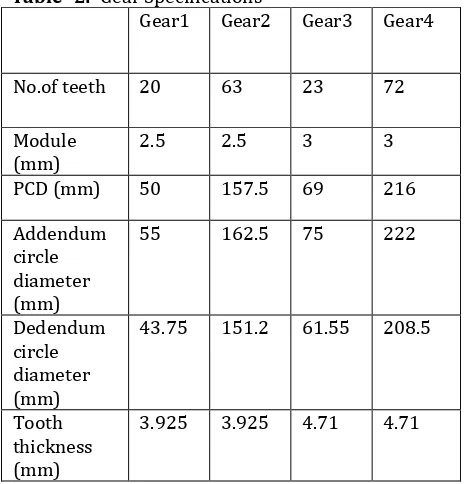
Table -2: Gear Specifications
Gear1 Gear2 Gear3 Gear4
No.of teeth 20 63 23 72
Module
(mm) 2.5 2.5 3 3
PCD (mm) 50 157.5 69 216
Addendum circle diameter (mm)
55 162.5 75 222
Dedendum circle diameter (mm)
43.75 151.2 61.55 208.5
Tooth thickness (mm)
3.925 3.925 4.71 4.71
5.4 Gear design validation
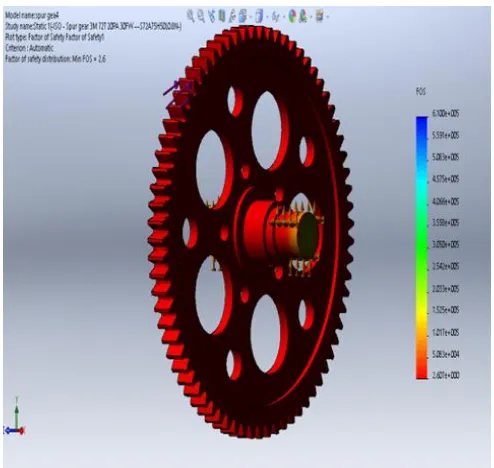
Design validation is done with the help of Finite Element Analysis (FEA). Analysis is done on solid works software by applying tangential load on pinion gear as shown in fig. 5.3 and 5.4.
© 2017, IRJET | Impact Factor value: 5.181 | ISO 9001:2008 Certified Journal | Page 451
Fig 5.1- Analysis of gear 1 and 2 on ansys
Analysis is done on Ansys software by applying moment on pinion gear as shown in figure 5.1 and 5.2
Fig 5.2- Analysis of gear 2 and 3 on ansys
6. Shaft design
Shafts are designed on the basis of strength orrigidity or both. Design based on strength is to ensure that stress at any location of the shaft does not exceed the material yield stress. Design based on rigidity is to ensure that maximum deflection (because of bending) and maximum twist (due to torsion) of the shaft is within the allowable limit
for example position of a gear mounted on the shaft will change if the shaft gets deflected and if this value is more than some allowable limit, it may lead to high dynamic loads and noise in the gears.
In designing shafts on the basis of strength, the following cases may be considered:
(a) Shafts subjected to torque
[image:5.595.307.554.224.458.2](b) Shafts subjected to bending moment
Fig 5.3- Analysis of shaft 1 on solidworks
(c) Shafts subjected to combination of torque and bending moment
(d) Shafts subjected to axial loads in addition to combination of torque and bending moment
When the shaft is subjected to combination of torque and bending moment, principal stresses are calculated and then different theories of failure are used. Bending stress and torsional shear stress can be calculated using the above relations.[7,8]
Fig 5.4- Analysis of shaft 4 on solidwprks
(3.8)
(3.9)
Maximum Shear Stress Theory Maximum shear stress is given by,
(3.10) is called equivalent torque, Te, such that
( 3.11)
Deflection
[image:5.595.33.561.509.786.2]© 2017, IRJET | Impact Factor value: 5.181 | ISO 9001:2008 Certified Journal | Page 452
Table -3: Shaft dimensions
Parameter Shaft 1 Shaft 2 Shaft 3
Diameter 17mm 25mm 45mm
Deflection 0.004mm 0.0022mm 0.025mm Angular
Deflection 0.009rad 0.0086rad 0.00998rad
7.Bearing Selection
Bearing Selection Is Based On 90% Reliability For Following Life :- [10]
( 8 Hours Operation Per Day ) = 25000 Hours
7 .1 Shaft 1 Bearing:-
In proposed gearbox , major forces act in radial direction rather than axial direction i.e. fa =0.
Radial forces on gear transmitted as well as divided on two radial ball bearings, that’s creates reaction on two ends which is given below :-
Reaction force at bearing A , RA = 1043.117 N Reaction force at bearing B, RB = 2013.5 N Choose , Rmax(Fr)= 2013.5 N
SKF recommends minimum load of 0.02 C to be imposed on roller bearing , while 0.01 C to be applied on ball bearing. ( 0.03C ≤ P ≤ 0.1C )
Equivalent Dynamic Load ,Peff = X*V*Fr+ Y*Fa Fr = Radial load (N)
Fa= Axial or Thrust load (N) V = Race-Rotation factor Since Fa = 0
For Deep Groove Ball Bearing
Peff = X* V* Fr = 0.56*1*2013.5 = 1130.36 N (V= 1 , for inner race rotating)
Choose => Bearing No 6205
Dynamic load capacity ,C = 14.3 KN Static load capacity , C0 = 7.8 KN
For safety
0.03*C ≤ P ≤ 0.1C
0.03* 14.8*1000 ≤ P ≤ 0.1 14.8 *1000 that is 444 ≤ P≤ 1480
Since Peff lies in this range , hence bearing is justified. Life of bearing = (C/P )a * 106 / ( 60*900 )
= 41536 hours
7.2 Shaft 2 Bearing :-
Similarly For Shaft 2 Bearing Selecting Bearing No. 6206
C = 20.8 KN C0 = 11.2 KN 0.03*C ≤ P≤ 0.1*C
0.624 Kn ≤ P≤ 2.08 kN Verified
Life Of Bearing = 26379.42 Hours
7.3 Shaft 3 Bearing :-
For Shaft 3 Choose Bearing No. 6206
C = 20.8KN C0 =11.2KN
For safety
0.03C ≤ P≤ 0.1 C 609 ≤ P≤ 2080 Hence bearing is safe.
Life of Bearing = 19421.007 hours
8. Dynamic calculation
8.1 Max Velocity
: -It is the velocity without Grading and acceleration resistance.
Total reduction through gearbox & CVT at maximum velocity condition (NENGINE = 3600)
= 9.86*0.45 = 4.437 Tractive effort, F = / RWHEEL = 188.4N
Rolling Resistance, FR = from equ.3.2 = 117.7 N
Air Drag , FAIR =
= 0.5 * 1.2* (0.5*1)*V2 *1 = 0.3 V2
Now, from equ. 3.6
F = FR + F AIR 188.4 = 117.7 + 0.3 *V2 V = 15.3 m/s = 58 kmph
8.2 Max Acceleration:-
Tractive effort, F = E torque x gear ratio =1971.2 N
Air drag , FAIR = 2.95 N equ.3.4 From Equation,
3.6:-Then equ. is M*a = F – ( FR + FAIR )
a = 268.04 – ( 117.7 + 69.95) a = 5.6 m/s2
8.3 Acceleration Time
Applying Newton's second law to the motion of the car gives
[3]
© 2017, IRJET | Impact Factor value: 5.181 | ISO 9001:2008 Certified Journal | Page 453
9. CONCLUSION
The following comments could be concluded:
1. The position of the centre of gravity in any vehicle affects the dynamic performance like the maximum tilting angle and maximum acceleration. These dynamic parameters are independent of the engine performance and specifications and depend only upon the constructional details of the vehicle.
2. The reduction ratio for a two stage speed reducer used as a final drive alternative can be calculated from the performance characteristics and traction requirements. 3. For an optimal design solution the transmission ratio in the first stage should be almost equal to the second stage. Also the centre distance characteristic value should be fixed initially according to the space constraints.
4. The factor of safety of around 2 is sufficient for the design of the two stage speed reducer.
References
[1] Fundamentals of Motor Vehicle Technology, (BOOK 2) by V.A.W. Hillier and David R. Rogers. [2] Fundamental of Vehicle Dynamics by Thomas D.
Gillespie.
[3] Vehicle Dynamics: Theory and Application by Reza N. Jazar.
[4] Advanced Vehicle Technology by Heinz Heisler. [5] Automotive Transmissions by Herald Naunheimer,
Bernd Bertsche, Joachim Ryborz and Wolfgang Novak. [6] Tudose, L. Buiga, O. Jucan D. Stefan ache, C. Optimal Design Of Two Stage Speed Reducer, MACMESE, Romania(74-79),2008.
[7] A Textbook of Machine Design by R. S. Khurmi and J.K. Gupta.
[8] Design Data Handbook by K. Mahadevan and K. Balaveera Reddy.
[9] Cvtech CVT catalog [10] SKF bearing catalog