https://doi.org/10.5194/hess-21-4233-2017 © Author(s) 2017. This work is distributed under the Creative Commons Attribution 3.0 License.
Evolution of the vegetation system in the Heihe River basin
in the last 2000 years
Shoubo Li1, Yan Zhao2, Yongping Wei2, and Hang Zheng2
1School of Geography and Remote Sensing, Nanjing University of Information Science & Technology, Nanjing, 210044, China
2School of Earth and Environmental Sciences, the University of Queensland, 4072 Brisbane, Australia
Correspondence to:Shoubo Li ([email protected]) and Yan Zhao ([email protected]) Received: 14 September 2016 – Discussion started: 9 January 2017
Accepted: 17 July 2017 – Published: 28 August 2017
Abstract. The response of vegetation systems to the long-term changes in climate, hydrology, and social–economic conditions in river basins is critical for sustainable river basin management. This study aims to investigate the evolution of natural and crop vegetation systems in the Heihe River basin (HRB) over the past 2000 years. Archived Landsat images, historical land use maps and hydrological records were introduced to derive the long-term spatial distribu-tion of natural and crop vegetadistribu-tion and the corresponding biomass levels. The major findings are that (1) both natural and crop vegetation experienced three development stages: a pre-development stage (before the Republic of China), a rapid development stage (Republic of China – 2000), and a post-development stage (after 2000). Climate and hydro-logical conditions did not show significant impacts over crop vegetation, while streamflow presented synchronous changes with natural vegetation in the first stage. For the second stage, warmer temperature and increasing streamflow were found to be important factors for the increase in both natural and crop vegetation in the middle reaches of the HRB. For the third stage, positive climate and hydrological conditions, to-gether with policy interventions, supported the overall vege-tation increase in both the middle and lower HRB; (2) there was a significantly faster increase in crop biomass than that of native vegetation since 1949, which could be explained by the technological development; and (3) the ratio of nat-ural vegetation to crop vegetation decreased from 16 during the Yuan Dynasty to about 2.2 since 2005. This ratio reflects the reaction of land and water development to a changing climate and altering social–economic conditions at the river
basin level; therefore, it could be used as an indicator of wa-ter and land management at river basins.
1 Introduction
Natural vegetation plays a key role in maintaining functions of catchment ecosystems, including contributions to goods, services, and ecosystem biodiversity at arid and semiarid river basins (Ahlström et al., 2015; Feng et al., 2013; Kefi et al., 2007). With the rapid population growth, an increas-ing amount of water has been allocated worldwide to sup-port human activities, particularly for agricultural irrigation, whereas water for natural vegetation, wetlands, and other catchment ecosystems might have been compromised. Con-sequently, natural vegetation systems in water-limited re-gions have been degraded, and salinization and desertifica-tion have been reported repeatedly (Huang et al., 2015; Li et al., 2007; Su et al., 2007; Xue et al., 2015). An understand-ing of the development of natural vegetation under different water availability conditions, and its interactions with the hu-man crop system, is vital for sustainable river basin hu- manage-ment.
number of studies have contributed to the knowledge of al-locating the limited water resources among different ecosys-tems in river basins to balance the economic development and environmental sustainability (Wang et al., 2007). How-ever, most of these studies were carried out within a short time range, either to identify the rationality of water alloca-tion scheme reform (Cheng, 2002; Yang et al., 2003) or to test the effectiveness of ecological restoration projects (Thevs et al., 2015). Long-term change study in vegetation systems in response to significant alterations in climate, hydrology, and social–economic conditions is lacking in the current litera-ture (Sivapalan et al., 2012).
The knowledge gap identified above happened partly due to the unavailability of long-term instrumental data on veg-etation and hydrological change at the basin scale. With the rapid development of remote-sensing techniques, images acquired from multiple satellite platforms provide an ideal method to track the landscape changes at river basins in the past 5 decades (Nian et al., 2017; Beuchle et al., 2015). Among a mass of the remote-sensing-based metrics to char-acterize vegetation systems, spatial extent, normalized differ-ential vegetation index (NDVI) and biomass are commonly recognized as the most effective indices which have been widely applied in spatial analysis of landscape ecosystems (Pettorelli et al., 2005; Pinsky and Fogarty, 2012). For histor-ical periods (previous years with no remotely sensed data), emerging approaches including dendrochronology, ice core analysis, and other empirical methods have been applied to reconstruct eco-hydrological elements and their long-term variations (Turner et al., 2007; Lowry and Morrill, 2011). Several studies tried to reconstruct historical cultivated veg-etation systems, but relatively little attention has been paid to natural vegetation distributions in historical periods (Hu and Li, 2014; Xie et al., 2013; Ramankutty and Foley, 1999). Moreover, factors and mechanisms driving vegetation evolu-tion have largely remained neglected.
The Heihe River basin (HRB), located in arid northwest-ern China, is an important part of the ancient Silk Road es-tablished in the Han Dynasty (206 BC–AD 220). It was also a trade center between China and western countries, which fa-cilitated cultural and economic exchange for approximately 1500 years. The HRB is a typical inland river ecosystem, which includes natural vegetation, irrigated crop, desert and terminal lakes. The middle course of the basin has an agri-cultural history over more than 2000 years, while the lower reaches are located at the alluvial fan – supporting local human civilization and ecosystem development (Fu et al., 2014). Increasing agricultural development and changing cli-mate and hydrology over the past 2000 years have signif-icantly changed use of land and water resources and have modified the catchment vegetation system (Lu et al., 2015a; Zhao et al., 2016). More specifically, several decadal-scale studies have provided quantitative descriptions of agricul-tural and naagricul-tural vegetation changes responding to the wa-ter transfer project implemented since 2000, which
effec-tively prevented further ecosystem degradation (Zhao et al., 2016; Lu et al., 2015c). Within a centurial scale, Nian et al. (2017) found that the rapid expansion of cultivated land was the primary force causing serious ecological deteriora-tion in the HRB. However, informadeteriora-tion about long-term veg-etation changes responding to the rise and fall of civiliza-tions, as well as the changed climate and hydrology condi-tions, is currently lacking. Such information is crucial for an understanding of the ecosystem’s health and for promoting sustainable management in the basin.
The present study aims to understand the vegetation evo-lution in the HRB over the past 2000 years, for which both natural and crop vegetation are considered. The specific ob-jectives of the present study are (1) to determine the area and biomass of vegetation using remote-sensing imagery for re-cent years (since 1987); (2) to reconstruct vegetation distri-bution and biomass levels for previous periods (before 1987) and (3) to determine potential factors for vegetation evolu-tion. It is expected that the methods developed and the find-ings obtained from this study could assist in achieving an understanding of how current ecosystem problems emerged in the past and what their implications can be for future river basin management.
2 Material and methods 2.1 Study area
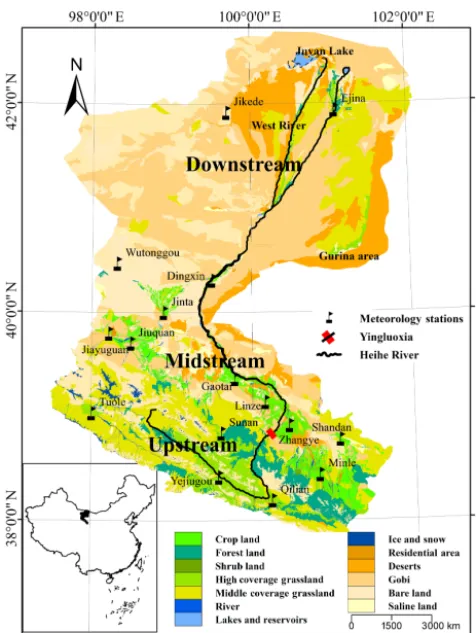
The HRB is the second largest inland river basin in China, which stretches between 38–43◦N and 98–102◦E (Fig. 1). The middle and lower courses of the HRB contain sev-eral types of landscape, including river delta plains, terminal lakes, mobile dunes and semi-mobile dunes, and low moun-tains and hills. The unused land such as the desert, Gobi and bare land accounts for more than 75 % of the river basin, while cropland only takes up 4 % (according to the land cover map of 2011; data available at the WestDC database http://westdc.westgis.ac.cn/). The rest of the landscape is dis-tributed with natural oases. The main vegetation types in these regions are dry steppes and shelter forests.
The terrain in the HRB gradually tilts from southwest to northeast. The altitude of the area ranges from about 820 to 1100 m. The region has a typical continental arid cli-mate characterized by frequent wind, scarce rainfall, abun-dant sunshine and intensive evaporation. The average annual temperature in this area over the last 3 decades is 8.3◦C
Figure 1. Location of the Heihe River basin (HRB). Land cover data (2011) are available at the WestDC database (http://westdc. westgis.ac.cn/).
River inflow from the northern Qilian Mountains consti-tutes the primary water source for the river basin. It makes the HRB an important grain production base and the region has experienced intensive agricultural activities to meet the grain demands of military events since the Han Dynasty (121 BC– AD 220) (Xie et al., 2013). Nowadays, the midstream is still one of the most important agricultural belts in northwest-ern China. However, the increasing water abstraction for ir-rigation, along with increasing usage for domestic purposes in middle reaches, has substantially consumed the available water supply for downstream systems over the past several decades. Consequently, Juyan Lake shrank dramatically in the last 100 years, and dried up in 1992 (eastern Juyan Lake). Since the late 1990s, the Chinese government has imple-mented a series of policies to secure the required amount of water for sustaining the ecosystems in lower river courses and to avoid further degradations. In 2002, Juyan Lake (east) started to retain water again, which was taken as an important sign of ecosystem recovery (Nian et al., 2017).
2.2 Study period
We selected the past 2000 years as our study period, which started from the Han Dynasty (206 BC–AD 220) (Table 1). This timescale covered several ancient dynasties of China, the Republic of China (RC), and the Peoples’ Republic of China. The period has experienced dramatic changes in cli-mate, land use, runoff, management policy, population, so-cial and ecological developments. All these factors could contribute to changes in water cycles within the river basin and can, therefore, influence vegetation distributions. 2.3 Determining vegetation distribution and estimating
vegetation biomass
2.3.1 Landsat image preprocessing
Landsat images have been used to derive vegetation distri-bution and biomass since the 1980s. Five Landsat scenes (path/row 133/31, 133/32, 133/33, 134/31, and 134/32) for each year were required to cover the area. The collected im-ages covered the timescale ranging from 1987 to 2015, ex-cept for 1989 and 1996, when there were no high-quality im-ages. Most of these images were acquired from June to Oc-tober to represent the growing season for crops and natural vegetation in the study area.
The Landsat datasets containing digital numbers (DNs) were downloaded from the United States Geological Sur-vey (USGS) Earthexplorer website (http://earthexplorer. usgs.gov/). The DN values were converted into top-of-atmosphere (TOA) reflectance using the radiometric gain and offset values associated with each Landsat image. Then a quick atmosphere correction (QUAC) method was adopted to account for atmospheric scattering and to derive land sur-face reflectance. NDVI was then calculated using the red and near-infrared bands for each year.
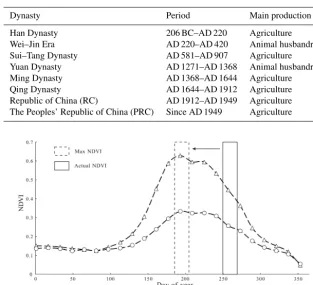
As demonstrated with MODIS NDVI series (Fig. 2), natu-ral and crop vegetation presented significant phenology cy-cles. Since the collected annual Landsat images were ac-quired at different dates (sometimes in different months) of a year, the above calculated NDVI values might have included these seasonal variations. To compensate for this effect, we used the MODIS NDVI profile in 2013 to calibrate the Land-sat NDVIs to an annual maximum NDVI using a linear inter-polation algorithm. Specifically, with the knowledge of the acquisition date of a Landsat image for a specific year, the ratio of the MODIS NDVI for that date to the maximum MODIS NDVI was calculated, and this ratio was applied to the Landsat-derived NDVI to calculate the maximum NDVI for that year. The method could be presented with the follow-ing equation:
cali-Table 1.Major dynasties during the selected study period (Lu et al., 2015c).
Dynasty Period Main production
Han Dynasty 206 BC–AD 220 Agriculture Wei–Jin Era AD 220–AD 420 Animal husbandry Sui–Tang Dynasty AD 581–AD 907 Agriculture Yuan Dynasty AD 1271–AD 1368 Animal husbandry Ming Dynasty AD 1368–AD 1644 Agriculture Qing Dynasty AD 1644–AD 1912 Agriculture Republic of China (RC) AD 1912–AD 1949 Agriculture The Peoples’ Republic of China (PRC) Since AD 1949 Agriculture
Figure 2.NDVI profile for natural vegetation and crops in 2013. The rectangles indicated the scheme of the calibrated actual Landsat NDVI (solid rectangle) to the annual maximum NDVI (dashed rectangle).
bration. The MODIS 250 m NDVI product (i.e., MOD13Q1) was applied in this procedure. Only the data of 2013 were used with the consideration that annual vegetation growth would follow a similar phenology cycle. Thus, it is necessary to use the 2013 NDVI series to calibrate the Landsat NDVI in extra years without causing significant uncertainties in the final results.
2.3.2 Determining vegetation areas and biomass since the 1980s with satellite images
Two rounds of threshold analysis were applied to determine natural and crop vegetation distributions in the HRB since the 1980s. Through an analysis of the NDVI histogram dis-tribution characteristics, 0.12 was selected as the first thresh-old value to mask out non-vegetation landscapes, including water surfaces, deserts, residential areas and other bare sur-faces. Then, the second round of threshold analysis was in-troduced to separate crop vegetation from natural vegetation according to their phenology differences (Fig. 2). In short, we randomly sampled the vegetation maps and derived the average NDVI levels for natural and crop vegetation, respec-tively. Then, 0.35 was set as the second threshold to sepa-rate crop (≥0.35) and natural (<0.35) vegetation. A most recent land cover map (i.e., 2011) created by the Cold and
Arid Regions Environmental and Engineering Research In-stitute, Chinese Academy of Sciences, was introduced to as-sist in identifying vegetation types. The preliminary results were first overlaid with each year’s Landsat images to check the accuracy. The threshold for the year was adjusted when it presented significant errors in the classification results. In addition, the results in 2000 and 2011 were verified with a set of land use maps (2000, 2011) obtained from the WestDC database (http://westdc.westgis.ac.cn/). A detailed scheme of inter-comparison of land cover maps between this study and existing results were detailed in Zhao (2016). Overall, the two datasets presented substantial consistency where kappa coefficients (k) were 0.7206 and 0.6731 for 2000 and 2011. Areas of natural and crop vegetation for each year were cal-culated by summing areas of every small patch of natural and crop vegetation, respectively.
[image:4.612.142.455.81.366.2]respectively.
Biomassg m−2=327.4×NDVI+102.29 for natural vegetation(Zhao et al.,2007) (2) Biomassg m−2=1789×NDVI+559.68 for crops
(Zhao et al., 2010) (3) These two equations were applied to the NDVIL−maxseries created in Sect. 2.3.1 to obtain the crop and natural vegetation biomass since the 1980s in the HRB.
2.3.3 Historical vegetation distributions and biomass levels
The crop and natural vegetation areas in previous dynasties (Table 1) were derived from Lu et al. (2015a)’s results. In Lu at al. (2015a)’s study, historical cropland was reconstructed based on population, grain yield and ancient ruin distribu-tions. Natural vegetation distributions were estimated based on the assumption that people tended to select natural oases (grassland and forest) rather than desert for reclamation in historical periods because the former have better water and soil conditions in these arid regions, while the abandoned croplands desertified. Thus, natural vegetation for previous dynasties could be evaluated based on the changes in crop-land between the previous and current dynasties (Lu et al., 2015a; Xie et al., 2013, 2016).
To estimate historical vegetation biomasses, we first es-tablished the relationship between biomass and several vari-ables which have a potential impact on vegetation develop-ment. The candidate variables include temperature (T), river flow from the upstream (Q), river flow to Juyan Lake (Ql), groundwater recharge (Qg) and precipitation (P). T and P records were collected from the surrounding weather sta-tion (Fig. 1). River flow to Juyan Lake was determined ac-cording to the records measured at Ejina station. Stream-flow through Yingluoxia gauge station stands for the total upstream inflow to the study area (Q). Groundwater reserve data were obtained from the government statistics yearbook (Mi et al., 2015). The component of streamflow consumed for vegetation developments (1Q) was then determined by deductingQlandQgfromQ. With this established database, a stepwise regression method was introduced to explore re-lationships between biomass (biomass for natural vegeta-tion, biomass for crops and the total biomass) and the se-lected hydrological and climatic metrics. As indicated by the regression model, the significant relationship between total biomass and T and water supply (1Q) was found as listed below (R2=0.612).
Total biomass=39.246·T +9.312·1Q−345.671 (4)
1Q=Q−Ql−Qg (5)
We then applied Eq. (4) to estimate historical total biomass levels using the corresponding (T, 1Q) settings.
Specifi-cally, historical T was derived from paleoclimate records reported by Yang et al. (2002). Q estimations by Sakai et al. (2012) based on glacier mass balance analysis were adopted. Since the spatial extent of the lake did not change considerably in historical periods, Ql was assumed to be equal to evaporations from the lake surface which could be derived from public articles (Xiao and Xiao, 2008);Qgwas set to be 0 based on the assumption that groundwater level did not change over the historic periods when agricultural activities were relatively small (Wang et al., 2009).
Unlike crop biomass, which was largely influenced by technological development, the biomass of natural vegetation was considerably less influenced by human activities. There-fore, we assumed that biomass density for natural vegetation in the region did not change over the study period. Accord-ing to the Landsat-based results for the past 30 years, the average biomass density for natural vegetation was stable at about 190 g m−2and this value was applied to historical veg-etation maps to get the corresponding biomass estimations for natural vegetation. Crop biomass was then estimated by deducting the component for natural vegetation from the to-tal biomass estimations.
2.4 Determination of potential driving factors for vegetation developments
Hydrological variables includingQ,1Qand climatic vari-ables includingP andT (Lan, et al. 2004) were related to spatial extents and biomass levels of natural and crop veg-etation through multiple linear regression analysis to assess whether or not there were any significant relationships. The regression analysis was applied to the dataset covering the entire study period and the sub-dataset since the 1980s (de-rived from Landsat), respectively, to check the robustness of the relationship. The analysis was performed with the IBM SPSS Statistics software package (version 20.0).
3 Results
3.1 Spatial and temporal variations in vegetation distribution in the past 2000 years
Figure 4.Temporal variations in total vegetation areas (square), natural vegetation (circle) and crops (triangle). It should be noted that data after 1987 reflect the results after applying a 3-year moving average to reduce the annual fluctuations.
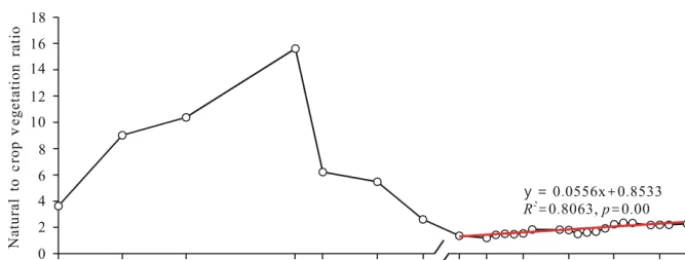
Figure 5.Changes in ratios between the areas of natural vegetation to crop vegetation in the past 2000 years.
prior to the Yuan Dynasty, natural vegetation in the down-stream was primarily distributed along the East River chan-nel. Vegetation distributions along the West River have been observed since the Ming Dynasty. For modern China (af-ter the RC), natural vegetation presented an overall decrease from the RC to the 1980s and 1990s. A recovering trend has been observed since the 2000s. There were few changes in natural vegetation distribution in the midstream regions in ancient dynasties (prior to the Qing Dynasty). From 1949 to 2000, natural vegetation in the midstream basin has signif-icantly increased, with substantial interannual fluctuations. After 2000, vegetation distribution has been relatively stable at a high level.
The temporal variation of vegetation areas over the past 2000 years is presented in Fig. 4. The total vegetation area increased by 8732 km2 during the studied period. Histori-cally, total vegetation within the HRB experienced a slight decrease, from about 8122 km2in the Han Dynasty to about 6918 km2 in the Republic of China. Natural vegetation for this period constantly decreased by 21 % to only 5000 km2. Cropland for the same period presented more variations: it had a large spatial extent in the Han Dynasty at about 1755 km2, and then gradually decreased to about 379 km2in the Yuan Dynasty. From the Ming Dynasty onward, it started to increase again and reached a peak of 1917 km2in the Re-public of China. Situations were different in the period of
modern China. Total vegetation area increased from about 6918 km2to 11 362 km2in 1987 and to 13 863 km2in 2000 with an increasing rate of 2 % per year, while the crops sub-stantially increased by about 150 % to 4939 km2in 2000. In the same period, natural vegetation has also substantially in-creased, from about 6559 in 1987 to about 8924 km2in 2000. After 2000, the increasing rate of the crop area has decreased from 3 % per year to 0.3 % per year, while the natural vegeta-tion has substantially increased to about 11 691 km2in 2013, resulting in the total vegetation area steadily increasing to 16 854 km2in 2013.
[image:7.612.127.470.238.368.2]relatively stable compared to the great historic fluctuations, and it has stabilized at around 2.2 since 2005.
3.2 Changes in vegetation biomass over the past 2000 years
Using the Landsat-derived biomass estimations and the cor-responding hydrological and climatic records, we created the relationship between biomass and T and 1Q as demon-strated in Eq. (3). The relationship was applied to the long-termT and streamflow records to derive historic biomass es-timations. As shown in Fig. 6, biomass in natural vegetation in historic periods (prior to the Republic of China) experi-enced a decrease by 20 % and the biomass of crop under-went a decrease before the Tang Dynasty and increased after it. Since the Republic of China, biomass in natural vegeta-tion has shown a gradual increase, from about 95×104 to 159×104t in 2000. After 2000, the upward trend continued with a higher increasing rate. For crops, the biomass pre-sented a sharp increase by about 4 times from the RC to the 1980s. A slight increasing trend in the past 30 years was ob-served. The average biomass per unit area of natural vegeta-tion was stable, while the average biomass per unit area of crop increased by 2.2 times over the past 2000 years. The av-erage biomass per unit area of crop increased by about 180 % since the PRC.
3.3 Impacts of hydrological and climatic variables over vegetation development in the past 2000 years
The regression analysis between vegetation development and hydrological and climatic variables shows that both
T and1Qpresent an overall positive effect on natural and crop vegetation distributions (Fig. 7a and b). From a holis-tic perspective, T showed a significant impact over natu-ral vegetation expansion, while its effects on crops were quite limited. Meanwhile, 1Q exerted similar effects on both natural (R2=0.6016,p=0.00) and crop (R2=0.9188,
p=0.00) vegetation development over the past 2000 years. It is also found thatT showed significant positive impacts over both natural (R2=0.7684,p=0.00) and crop (R2=0.6836,
p=0.00) vegetation during the past 3 decades with instru-mental data (Fig. 7c and d). Similar for1Q, it alone con-tributed about 77 and 60 % of the area expansion since the 1980s for natural (p=0.00) and crop (p=0.00) vegetation, respectively. A multiple factor regression analysis shows that increasing T and1Qcould explain over 90 % of the vege-tation development (i.e., 96.0 % for natural vegevege-tation and 91.7 % for crops). Although the development of vegetation did not show an evident relationship with precipitation, there were some years during which vegetation area was less than other years in last 30 years, for example, 1992 and 2001, which may be due to the interannual variations of precipi-tation.
4 Discussion and conclusions
This paper presented an empirical study of the evolution of vegetation systems in the HRB over the past 2000 years. The vegetation system was categorized into natural vegetation and crop vegetation. The area and biomass of each vegetation system since the 1980s were estimated based on the remote-sensing image data. For the historical periods, the area and biomass of each vegetation system were reconstructed based on the relationship between the area and biomass of the veg-etation system and the climatic and hydrological variables in the last 30 years with the measured data. Some major re-search findings and their implications for future rere-search and river basin management practice will be discussed below.
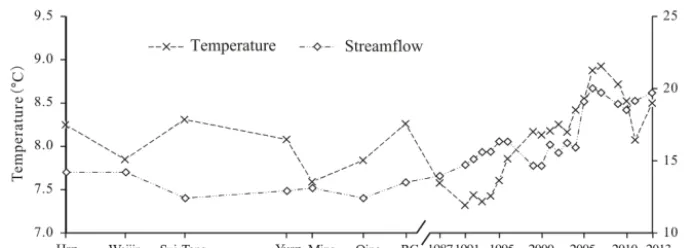
Both natural and crop vegetation development in the HRB, based on the change in area and biomass in the past 2000 years (Figs. 3, 4 and 7), can be divided into three stages: (1) a pre-development stage (before RC), (2) a rapid devel-opment stage (RC-2000), and (3) a post-develdevel-opment stage (after 2000). In the pre-development stage, agriculture was developed at a low level, resulting in a high natural to crop vegetation ratio. Water did not limit agricultural activities. No significant contributions from climatic (T and P) and hydrological (Q) variables were observed in the regression analysis either. The small-scale and decreasing crop vege-tation distributions could be attributed to the small popu-lation size. Previous studies have reported that agricultural activities for these periods were primarily aimed at meet-ing political and military needs (Xie et al., 2013). However, the slightly decreased streamflow (Sakai et al., 2012) might be a key contributor to the overall decreased natural vege-tation prior to the Ming Dynasty, as evidenced by the syn-chronous change between vegetation area and streamflow records (Figs. 4 and 8) and the regression relationship be-tween the two (Fig. 7a). In the Ming Dynasty, temperature dropped while streamflow slightly recovered (Fig. 8). The decreased evapotranspiration and increasing water availabil-ity might have stimulated vegetation growth along the river channel as demonstrated in Fig. 3, especially for the natural vegetation distributions along the West River.
vegeta-Figure 6.Temporal variations in the biomass of natural vegetation (triangle) and crops (circle) over the past 2000 years.
Figure 7.Correlation between vegetation (circle: natural vegetation; triangle: crops) andT (a, c)and1Q(b, d).(a)and(b)presented all reconstructed data for the past 2000 years;(c)and(d)only used Landsat-derived estimations.
tion system or through water leakage from crop irrigation ar-eas. However, vegetation in the lower reaches did not show synchronous development. Obviously, overuse of water in the middle reaches was the primary contributor, which is con-sistent with the existing literature (Nian et al., 2017; Zhao et al., 2016; Cheng, 2002; Wang et al., 2007).
Since 2000 (the post-development stage), crop vegetation distribution has slightly increased, but natural vegetation has experienced a relatively faster increase. This could be at-tributed to two major reasons. The first is the elevated tem-perature and increased streamflow provided sufficient water for both crop and natural vegetation development; this could be evidenced by their significant relationship with both nat-ural and crop vegetation areas (Fig. 7c and d). The second is owing to the implementation of the water reallocation policy
which aimed to secure water supply to the lower course of the basin to avoid ecosystem degradation.
[image:9.612.71.525.229.482.2]Ad-Figure 8.Temporal variations in temperature (◦C) and streamflow (108m3).
vances in agricultural and water technologies enabled more crop biomass without the increase in crop area and facilitated the transfer of water from agriculture to downstream ecolog-ical purposes without compromise of the middle stream eco-nomic benefit.
The total vegetation area in the HRB has increased by 8732 km2 in the past 2000 years. Crop and natural vegeta-tion presented different evoluvegeta-tionary patterns (Figs. 3 and 4) and the ratio of natural vegetation to crop vegetation ranged from 16 during the Yuan Dynasty to about 2.2 since 2005 (Fig. 5). It was the result of the increase in (1) human water demand from agriculture and urban development, (2) agri-cultural and water technological development for improving crop biomass, (3) water allocation for the environment (ter-minal lake) and (4) temperature and upstream runoff. Any changes in these factors will bring about change in the ra-tio of natural vegetara-tion to crop vegetara-tion. This rara-tio repre-sents the land and water development at river basin scale at changing climate and social–economic conditions. Thus, it could be used as an indicator of water and land management for better balance between the human and natural systems in river basins (Zhou et al., 2015).
Finally, some limitations in our study need to be acknowl-edged. Seven ancient periods were studied to track the long-term vegetation dynamics, where the short-lived Sui Dynasty (AD 581–617) was combined with the Tang Dynasty. How-ever, some periods that documented human activities were not included in the current study due to a lack of data. For instance, the Xixia Dynasty ruled the area for more than 150 years (AD 1038–1227) and prosperous human activi-ties were recorded which might cause substantial changes to both crop and natural vegetation. The existing literature reported crop distribution in the lower reaches of the HRB in Xixia using archaeological methods (Hu and Li, 2014), but data for crop and natural vegetation covering the entire basin are lacking in both the literature and historical docu-ments. Meanwhile, there was also an inconsistency between the reconstructed historic vegetation distribution and remote-sensing-based extractions. For reconstruction periods, prior-ity was given to the riverside regions, while vegetation in re-mote areas was less discussed, whereas for modern periods,
remotely sensed images captured comprehensive vegetation distribution in all regions. Moreover, more research is needed to develop an understanding of the mechanism of dynamic interaction between natural vegetation and crop vegetation.
Data availability. The satellite imagery used in this study is avail-able at http://earthexplorer.usgs.gov/. The runoff observation data at Zhengyixia and Juyan Lake, the groundwater recharge data, the meteorological observation data, and the Land cover maps are all available at WestDC database (http://westdc.westgis.ac.cn/).
Competing interests. The authors declare that they have no conflict of interest.
Acknowledgements. This project is supported by the National Natural Science Foundation of China (nos. 41301036, 41501464, and 91625103), the Natural Science Foundation of Jiangsu Province, China (BK20130996), and the Australian Research Council (project no. FT130100274).
Edited by: Dominic Mazvimavi Reviewed by: two anonymous referees
References
Ahlström, A., Raupach, M. R., Schurgers, G., Smith, B., Arneth, A., Jung, M., Reichstein, M., Canadell, J. G., Friedlingstein, P., Jain, A. K., Kato, E., Poulter, B., Sitch, S., Stocker, B. D., Viovy, N., Wang, Y. P., Wiltshire, A., Zaehle, S., and Zeng, N.: The dominant role of semi-arid ecosystems in the trend and variability of the land CO2 sink, Science, 348, 895–899, https://doi.org/10.1126/science.aaa1668, 2015.
[image:10.612.126.473.65.189.2]Cheng, G.: Study on the sustainable development in the Heihe River watershed from the view of ecological economics, J. Glaciol. Geocryol., 24, 335–343, 2002.
Esteban, E. and Albiac, J.: Groundwater and ecosystems damages: Questioning the Gisser–Sánchez effect, Ecol. Econ., 70, 2062– 2069, https://doi.org/10.1016/j.ecolecon.2011.06.004, 2011. Feng, X., Fu, B., Lu, N., Zeng, Y., and Wu, B.: How
ecolog-ical restoration alters ecosystem services: an analysis of car-bon sequestration in China Loess Plateau, Scient. Rep., 3, 2846, https://doi.org/10.1038/srep02846, 2013.
Fu, L., Zhang, L., and He, C.: Analysis of Agricultural Land Use Change in the Middle Reach of the Heihe River Basin, North-west China, Int. J. Environ. Res. Publ. Health, 11, 2698–2712, https://doi.org/10.3390/ijerph110302698, 2014.
Hu, N. and Li, X.: Spatial distribution of an ancient agricultural oasis in Juyan, northwestern China, Front. Earth Sci., 8, 338– 350, https://doi.org/10.1007/s11707-014-0452-9, 2014. Huang, G., Qin, X., He, L., Zhang, H., Li, Y., and Li, Z.:
Non-stationary desertification dynamics of desert oasis under climate change and human interference, J. Geophys. Res.-Atmos., 120, 11878–11888, https://doi.org/10.1002/2015JD023826, 2015. Ian, M. F. and Reed, M. M.: Human impacts on
terres-trial hydrology: climate change versus pumping and irriga-tion, Environ. Res. Lett., 7, 1–8, https://doi.org/10.1088/1748-9326/7/4/044022, 2012.
Kefi, S., Rietkerk, M., Alados, C. L., Pueyo, Y., Papanastasis, V. P., ElAich, A., and de Ruiter, P. C.: Spatial vegetation patterns and imminent desertification in Mediterranean arid ecosystems, Na-ture, 449, 213–217, https://doi.org/10.1038/nature06111, 2007. Lan, Y., Ding, Y., and Kang, E.: Variations and Trends of
Temper-ature and Precipitation in the Mountain Drainage Basin of the Heihe River in Recent 50 Years, Plateau Meteorol., 23, 724–727, 2004.
Leggett, K., Fennessy, J., and Schneider, S.: Does land use matter in an arid Environment? A case study from the Hoanib River catchment, north-western Namibia, J. Arid Environ., 53, 529– 543, https://doi.org/10.1006/jare.2002.1066, 2003.
Li, X., Xiao, D., He, X., Chen, W., and Song, D.: Evalua-tion of landscape changes and ecological degradaEvalua-tion by GIS in arid regions: a case study of the terminal oasis of the Shiyang River, northwest China, Environ. Geol., 52, 947–956, https://doi.org/10.1007/s00254-006-0536-2, 2007.
Lowry, D. P. and Morrill, C.: Changes in the Global Hydrological Cycle: Lessons from Modeling Lake Levels at the Last Glacial Maximum, American Geophysical Union, Fall Meeting, 5–9 De-cember 2011, San Francisco, California, USA, 2011.
Lu, Z., Wei, Y., Xiao, H., Zou, S., Xie, J., Ren, J., and Western, A.: Evolution of the human–water relationships in the Heihe River basin in the past 2000 years, Hydrol. Earth Syst. Sci., 19, 2261– 2273, https://doi.org/10.5194/hess-19-2261-2015, 2015a. Lu, Z., Wei, Y., Xiao, H., Zou, S., Ren, J., and Lyle, C.:
Trade-offs between midstream agricultural production and down-stream ecological sustainability in the Heihe River basin in the past half century, Agr. Water Manage., 152, 233–242, https://doi.org/10.1016/j.agwat.2015.01.022, 2015b.
Lu, Z., Xiao H., Wei, Y., Zou, S., Ren, J., and Zhang, Z.: Ad-vances in the study on the human-water-ecology evolution in the past two thousand years in Heihe River Basin, Adv.
Earth Sci., 30, 396–406, https://doi.org/10.11867/j.issn.1001-8166.2015.03.0396, 2015c.
Mi, L., Xiao, H., Zhu, W., Li, J., Xiao, S., and Li, L.: Dynamic variation of the groundwater level in the middlereaches of the Heihe River during 1985–2013, J. Glaciol. Geocryol., 37, 461– 469, 2015.
Nian, Y. Y., Li, X., and Zhou, J.: Landscape changes of the Ejin Delta in the Heihe River Basin in Northwest China from 1930 to 2010, Int. J. Remote Sens., 38, 537–557, https://doi.org/10.1080/01431161.2016.1268732, 2017. Pettorelli, N., Vik, J. O., Mysterud, A., Gaillard, J. M., Tucker, C.
J., and Stenseth, N. C.: Using the satellite-derived NDVI to as-sess ecological responses to environmental change, Trends Ecol. Evol., 20, 503–510, https://doi.org/10.1016/j.tree.2005.05.011, 2005.
Pinsky, M. L. and Fogarty, M.: Lagged social-ecological responses to climate and range shifts in fisheries, Climatic Change, 115, 883–891, https://doi.org/10.1007/s10584-012-0599-x, 2012. Ramankutty, N. and Foley, J. A.: Estimating historical
changes in global land cover: Croplands from 1700 to 1992, Global Biogeochem. Cy., 13, 997–1027, https://doi.org/10.1029/1999GB900046, 1999.
Sakai, A., Inoue, M., Fujita, K., Narama, C., Kubota, J., Nakawo, M., and Yao, T.: Variations in discharge from the Qilian moun-tains, northwest China, and its effect on the agricultural commu-nities of the Heihe basin, over the last two millennia, Water Hist., 4, 177–196, https://doi.org/10.1007/s12685-012-0057-8, 2012. Sivapalan, M., Savenije, H. H. G., and Blöschl, G.: Sociohydrology:
A new science of people and water, Hydrol. Process., 26, 1270– 1276, https://doi.org/10.1002/hyp.8426, 2012.
Su, Y. Z., Zhao, W. Z., Su, P. X., Zhang, Z. H., Wang, T., and Ram, R.: Ecological effects of desertification control and desertified land reclamation in an oasis–desert ecotone in an arid region: A case study in Hexi Corridor, northwest China, Ecol. Eng., 29, 117–124, https://doi.org/10.1016/j.ecoleng.2005.10.015, 2007. Thevs, N., Peng, H., Rozi, A., Zerbe, S., and Abdusalih, N.:
Water allocation and water consumption of irrigated agri-culture and natural vegetation in the Aksu-Tarim river basin, Xinjiang, China, J. Arid Environ., 112, 87–97, https://doi.org/10.1016/j.jaridenv.2014.05.028, 2015.
Turner, B. L., Lambin, E. F., and Reenberg, A.: The emergence of land change science for global environmental change and sustainability, P. Natl. Acad. Sci. USA, 104, 20666–20671, https://doi.org/10.1073/pnas.0704119104, 2007.
Wang, J. F., Cheng, G. D., Gao, Y. G., Long, A. H., Xu, Z. M., Li, X., Chen, H., and Barker, T.: Optimal Water Resource Allocation in Arid and Semi-Arid Areas, Water Resour. Manage., 22, 239– 258, https://doi.org/10.1007/s11269-007-9155-2, 2007. Wang, Y., Xiao, H., and Lu, M.: Analysis of water consumption
using a regional input–output model: Model development and ap-plication to Zhangye City, Northwestern China, J. Arid Environ., 73, 894–900, https://doi.org/10.1016/j.jaridenv.2009.04.005, 2009.
Xiao, S. and Xiao, H.: Advances in the study of the water regime process and driving mechanism in the Heihe River basin, Adv. Earth Sci., 23, 748–755, 2008.
Cen-ter, Lanzhou, China, https://doi.org/10.3972/heihe.092.2013.db, 2013.
Xie, Y., Wang, X., Wang, G., and Yu, L.: Cultivated land distribution simulation based on grid in middle reaches of Heihe River basin in the historical periods, Adv. Earth Sci., 28, 71–78, 2013. Xie, Y., Wang, G., Wang, X., and Fan, P.: Assessing the evolution
of oases in arid regions by reconstructing their historic spatio-temporal distribution: a case study of the Heihe River Basin, China, Front. Earth Sci., 1–14, https://doi.org/10.1007/s11707-016-0607-y, 2016.
Xue, X., Liao, J., Hsing, Y., Huang, C., and Liu, F.: Poli-cies, Land Use, and Water Resource Management in an Arid Oasis Ecosystem, Environ. Manage., 55, 1036–1051, https://doi.org/10.1007/s00267-015-0451-y, 2015.
Yang, B., Braeuning, A., Johnson, K. R., and Shi, Y.: Gen-eral characteristics of temperature variation in China during the last two millennia, Geophys. Res. Lett., 29, 38-1–38-4, https://doi.org/10.1029/2001GL014485, 2002.
Yang, W., Khanna, M., Farnsworth, R., and Onal, H.: Integrating economic, environmental and GIS modeling to target cost effec-tive land retirement in multiple watersheds, Ecol. Econ., 46, 249– 267, https://doi.org/10.1016/S0921-8009(03)00141-1, 2003.
Zhao, W., Chang, X., He, Z., and Zhang, Z.: Study on vegetation ecological water requirement in Ejina Oasis, China Earth Sci., 50, 121–129, https://doi.org/10.1007/s11430-007-2035-z, 2007. Zhao, W., Niu, Z., Chang, X., and Li, S.: Water consumption in
artificial desert oasis based on net primary productivity, China Earth Sci., 53, 1358–1364, https://doi.org/10.1007/s11430-010-4028-6, 2010.
Zhao, Y., Wei, Y. P., Li, S. B., and Wu, B. F.: Downstream ecosys-tem responses to middle reach regulation of river discharge in the Heihe River Basin, China, Hydrol. Earth Syst. Sci., 20, 4469– 4481, https://doi.org/10.5194/hess-20-4469-2016, 2016. Zhou, S., Huang, Y., Wei, Y., and Wang, G.: Socio-hydrological