Citation:
Tucker, CB and Anderson, R and Kenny, IC (2014) The Effect of the Application of Different Levels of Movement Variability on Movement Outcome. ISSN 1999-4168
Link to Leeds Beckett Repository record: http://eprints.leedsbeckett.ac.uk/1399/
Document Version: Article
The aim of the Leeds Beckett Repository is to provide open access to our research, as required by funder policies and permitted by publishers and copyright law.
The Leeds Beckett repository holds a wide range of publications, each of which has been checked for copyright and the relevant embargo period has been applied by the Research Services team.
We operate on a standard take-down policy. If you are the author or publisher of an output and you would like it removed from the repository, please contact us and we will investigate on a case-by-case basis.
THE EFFECT OF THE APPLICATION OF DIFFERENT LEVELS OF MOVEMENT
VARIABILITY ON MOVEMENT OUTCOME
Catherine B. Tucker
1, Ross Anderson
2, Ian C. Kenny
2Leeds Metropolitan University, School of Sport, Headingley Campus, Leeds,
United Kingdom
1Biomechanics Research Unit, University of Limerick, Ireland
2 The aim of this study was to assess the effect of the application of a previously validated golfer computer model on different levels of movement variability relative to a shot outcome measure: club head velocity. Movement variability was applied to the computer model on six measures sequentially throughout the body of the computer model. Four different levels of variability, 25%, 50%, 75% and 100% variability, were applied to x, y and z positional data of the aforementioned measures. Simulations were then performed with ADAMS/LifeMOD software for each level of movement variability applied to the measures in question. Club head velocity was measured during the simulation. The results suggest that movement variability application at these landmarks does not have an effect on outcome. These results potentially have implications for the coaching of the participant.KEY WORDS: club head velocity, golf, simulation.
INTRODUCTION: Despite studies examining movement variability in the golf swing using experimental techniques in recent years (Kenny, Wallace & Otto, 2008; Bradshaw et al. 2009; Horan, Evans & Kavanagh, 2011), it has not been established what effect, if any, movement variability in the golf swing has on shot outcome (Glazier, 2011). A potential problem with experimental studies is that the amount and type of variability cannot be controlled within participants if the aim of the study is to ascertain a causal relationship between movement variability of a specific measure and the outcome of the movement. The effect of movement variability on movement outcome remains an unanswered question (Hamill, Haddad, Heidersheit, Van Emmerick, & Li, 2006). Computer modelling offers the advantage of allowing the imposition of controlled amounts of movement variability on the model in order to ascertain its effect on movement outcome. Bearing in mind the potential problems with group-based designs (Bates, Rodger, & Dufek, 2004); this study adopted a single-participant simulation approach in order to answer the research question. The aim of this study was to ascertain the effect of the application of different levels of variability on shot outcome.
METHODS: This study adopted a single-participant design. A computer model in ADAMS/LifeMOD software was created of a highly-skilled female professional golfer (24 yrs, 1.7 m, 59.2 kg) from previously collected kinematic data. An in-depth description of the creation and validation of this model has been detailed elsewhere (Tucker, 2012). This model was created with 42 degrees-of-freedom and driven by experimental data collected from the participant. The model was scaled according to the height and weight of the participant. Club head velocity (movement outcome) was measured during the simulation with a marker on the toe of the club head.
variability not caused by an external factor such as fatigue. Following this, variability was added to the base curve (the trial that was modelled) in different amounts (25%, 50%, 75% and 100% of the variability calculated) at key frames (every twenty frames). This key frame approach was adopted to avoid issues with excessive rates of change between consecutive points. The variability amount that was added was based on the ±SD curve value at the particular key frame and the level of variability that was being calculated (e.g. 25%). Once variability was added to the key frames, a cubic spline algorithm was used to create a curve of the original trial length. The aforementioned process of creating the variability data sets was carried using a custom-written programme in LabVIEW (9.0.1; National Instruments, Austin, TX, USA). Analysis of these created variability curves with root mean square difference (RMS) and Bland-Altman indicated that the created variability curves produced a range of movement variability, i.e. the produced curves increased in variability from 0% (the original curve) to 100%.
Once the movement variability data sets were created, these were applied individually to the model to assess their effect on outcome. For example, when 25% movement variability at the left wrist was being assessed, the only factor that differed from the kinematic data driving the original model was the wrist kinematic data which was varied by 25%.
Variability was assessed at 6 different points. These points were selected on the basis of whether they drove the model and in addition a selection from the upper and lower-body. The effect of this variability on outcome was assessed through examination of club head velocity measured during the simulation at impact.
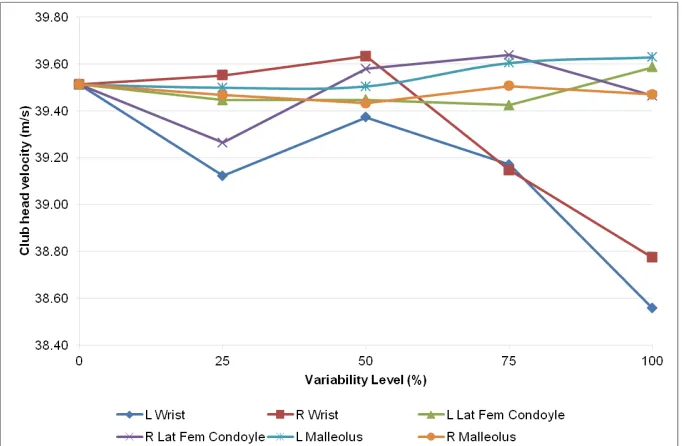
[image:3.595.128.469.398.621.2]RESULTS: Figure 1 shows the changes in club head velocity with changing levels of movement variability applied. The biggest change was recorded when 100% variability was applied to the left wrist where there was a reduction of 0.95 m/s.
Figure 1 - Changes in simulated club head velocity with increasing movement variability applied at six different anatomical landmarks
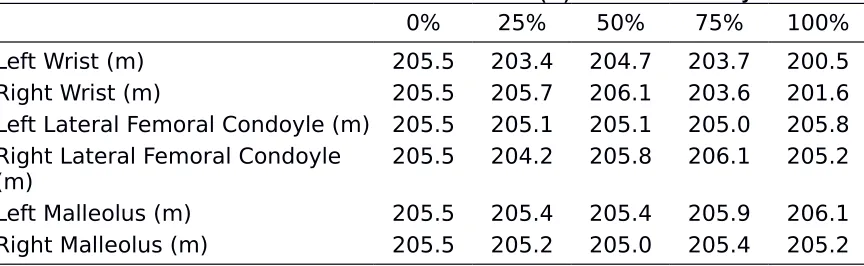
Table 1: Calculated total drive distances in metres (m) for each variability simulation
0% 25% 50% 75% 100%
Left Wrist (m) 205.5 203.4 204.7 203.7 200.5
Right Wrist (m) 205.5 205.7 206.1 203.6 201.6
Left Lateral Femoral Condoyle (m) 205.5 205.1 205.1 205.0 205.8 Right Lateral Femoral Condoyle
(m) 205.5 204.2 205.8 206.1 205.2
Left Malleolus (m) 205.5 205.4 205.4 205.9 206.1
Right Malleolus (m) 205.5 205.2 205.0 205.4 205.2
DISCUSSION: The purpose of this study was to apply variability to a validated computer model of a participant performing a golf swing and ascertain the effect of this on the shot outcome measure of club head velocity. Analysing right and left wrist results collectively suggests that variability at the highest ranges of the natural movement variability of the participant could potentially result in a loss of club head velocity for this participant. The changes in peak club head velocity were noticeably smaller with respect to other measures examined. This suggests variability at the landmarks other than the wrists does not affect shot outcome in the form of club head velocity for this participant. In fact, marginal increases in peak club head velocity of 0.13 m/s relative to the original validated model (0% variability) were evident to the higher ranges of variability (75% level) for the right lateral femoral condoyle.The results indicated that there was no consistent effect as a result of the imposition of this variability with respect to shot outcome (club head velocity) across all measures being varied.
In order to contextualise the difference in club head velocities recorded, it is informative to compare the club head velocities with the natural variation recorded during the data collection session of the participant in question. The club head velocities ranged from a minimum of 38.6 to a maximum of 40.3 m/s. This was just the variation in outcome from ten shots performed on one day. Using the 2011 statistics from 186 professional players of the PGA Tour (http://www.pgatour.com) and applying the same mean range in club head velocities would result in a range of 37.16 to 41.86 m/s over the course of the year for this participant. The application of variability at the six anatomical landmarks did not result in a change in club head velocity outside the range. Therefore, a change in total drive distance of 5 metres (the largest change in driving distance) is most likely within the typical variation of this player. Therefore this does not constitute a change in outcome that would ordinarily affect the strategy of the player on the course.
CONCLUSION: To conclude, the effect of the application of movement variability on shot outcome at specific landmarks on a participant-specific computer model has been performed. The results showed greater changes in peak club head velocity when variability was applied at the wrists compared to other measures examined. The practical effect of this club head velocity change on total drive distance was estimated. Ultimately movement variability applied at all locations did not elicit any changes outside the natural range of variability for club head velocity. The computer model used in this analysis is participant-specific but can be tailored for another participant through adjustment of participant anthropometrics. Therefore, the technique used here can be applied to another participant in order to ascertain the effect of movement variability on their shot outcome. The methodological advances with respect to analysing biomechanical variability can be used for bespoke modelling investigation of performance for a range of sports and human movement.
REFERENCES:
Bates, B. T., Rodger, C. J., & Dufek, J. S. (2004). Single-Subject Analysis. In N. Stergiou (Ed.),
Bradshaw, E. J., Keogh, J. W. L., Hume, P. A., Maulder, P. S., Nortje, J., & Marnewick, M. (2009). The effect of biological movement variability on the performance of the golf swing in high- and low- handicapped players. Research Quarterly for Exercise and Sport, 80, 185-197.
Glazier, P. S. (2011). Movement Variability in the Golf Swing: Theoretical, Methodological and Practical Issues. Research Quarterly for Exercise and Sport, 82(2), 157-161.
Hamill, J., Haddad, J. M., Heidersheit, B. C., Van Emmerick, R. E. A., & Li, L. (2006). Clinical Relevance of Variability in Coordination. In K. Davids, S. Bennett & K. Newell (Eds.), Movement System Variability. Champaign: Human Kinetics.
Horan, S. A., Evans, K., & Kavanagh, J. J. (2011). Movement Variability in the Golf Swing of Male and Female Skilled Golfers. Medicine & Science in Sports & Exercise, 43, 1474-1483.
Kenny, I. C., Wallace, E. S., & Otto, S. R. (2008). Driving Performance Variability Among Elite Golfers. In M. Estivalet & P. Brisson (Eds.), The Engineering of Sport 7 (Vol. 1). Paris: Springer
PGATour. (2011) '2011 PGA Tour Club Head Speed', [online], available :
http://www.pgatour.com/r/stats/info/?02401 [accessed 10/3/2012].
Quintavalla, S. J. (2006) Experimental Determination of the Effects of Clubhead Speed on Driver Launch Conditions and The Effects on Drive Distance for Balls used by the PGA Tour, USGA Technical Report RB/cor2006-01, USGA.
Tucker, C.B. (2012). Is Movement Variability Relevant for the Elite Golfer? A Biomechanical and Modelling Perspective (Unpublished doctoral dissertation). University of Limerick, Limerick, Ireland.
Acknowledgements