CHOICE OF STATIC VAR COMPENSATOR (SVC), MODELING AND
DETERMINATION OF ITS POWER FACTOR CORRECTION (PFC) CAPABILITY IN A.C. TRANSMISSION LINE
Ibekwe B.EPh.D
Department of Electrical and Electronic Engineering, Faculty of Engineering Enugu State University of Science and Technology (ESUT), Enugu
Chiwetalu U. J.
Department of Agricultural and Bio-resources Engineering, Faculty of Engineering Enugu State University of Science and Technology (ESUT)
Eje, B.E
Department of Agriculture and Bio-resource Engineering, Enugu State University of Science and Technology
Abstract
The Power Factor Correction (PFC) capability of Static Var Compensator (SVC) in a.c. transmission line is presented. SVC P.F.C capability is very important because it can help to adjust the line reactive power to control the system voltage. This is implemented by using a circuit configuration of self-commutated Pulse Width Modulation (PWM) converter system consisting of Thyristor Controlled Reactor (TCR) and Fixed Capacitors (FC). The end result is that the line current tracked the voltage, thus improving the system PF significantly to about 98%.
Key words: a.c. transmission line, SVC, PFC, PWM converters, Flexible AC Transmission System (FACTS).
1.0 Introduction
Of all the FACTS controllers researched, which included the first and the second generation of these devices, the SVC was chosen based on the following simple reasons: [3]
It is capable of providing continuous and rapid control of reactive power and voltages.
It can enhance several other aspects of transmission line performance such as:
GE-International Journal of Engineering Research
Vol. 5, Issue 5, May 2017 Impact Factor- 5.613
ISSN(O): 2321-1717, ISSN(P): 2394-420X
Website- www.aarf.asia, Email : [email protected] , [email protected]
(iii) Enhancement of transient stability
(iv) Enhancement of damping of system oscillation.
At the sub-transmission and distribution system levels, SVCs are used for balancing the unbalanced three phase system supplying unbalanced loads. They are also used to minimize fluctuations in supply voltage caused by repetitive-impact loads e.g. the dragline loads of mining plants, rolling mills and arc-furnaces [6].
2.0 Development of the SVS Model
From power system operation viewpoint, the static var system (SVS) is equivalent to a shunt capacitor and a shunt inductor both of which can be adjusted to control voltage and reactive power at its terminals or nearby bus in a prescribed manner. Figure 2.1 is an idealized static var system model [1].
IS
L C
[image:2.612.101.536.517.689.2]HVAC bus
Fig. 2.1: Idealized static var system model
An ideal SVS should hold constant voltage, possess unlimited var generation/absorption capability with no active or reactive power losses [6].
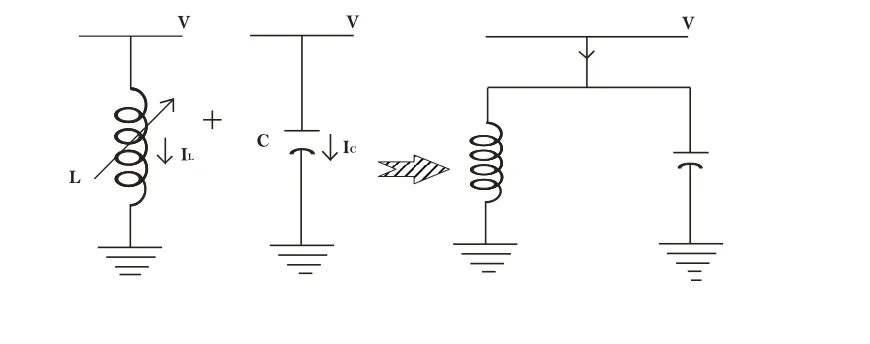
However, the realistic or practical SVS is composed of a controllable reactor and a fixed capacitor. The resulting characteristics are essentially applied to a wide range of practical SVS configurations. Figure 2.2 illustrates the derivation of the characteristics of an SVS, made up of a controllable reactor and a fixed capacitor (FC). The component characteristic is derived by adding the individual characteristics of the components as shown [1].
V
IL L
IC V
C
Slope Ks
IL
Max L Min L
(a) Controllable reactor
Is V
0
Capacitive Inductive
(c) SVS
Slope Ks
(b) Fixed capacitor V
[image:3.612.108.505.32.148.2]IC
Figure 2.2 composite characteristics of an SVS.
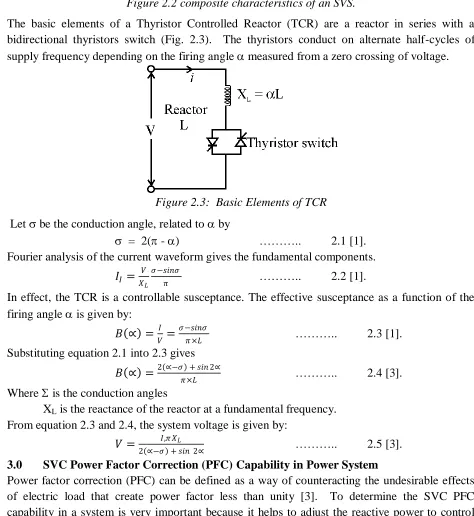
The basic elements of a Thyristor Controlled Reactor (TCR) are a reactor in series with a bidirectional thyristors switch (Fig. 2.3). The thyristors conduct on alternate half-cycles of supply frequency depending on the firing angle measured from a zero crossing of voltage.
Figure 2.3: Basic Elements of TCR
Let be the conduction angle, related to by
= 2( - ) ……….. 2.1 [1]. Fourier analysis of the current waveform gives the fundamental components.
𝐼𝐼 =𝑋𝑉
𝐿
𝜎−𝑠𝑖𝑛𝜎
𝜋 ……….. 2.2 [1].
In effect, the TCR is a controllable susceptance. The effective susceptance as a function of the firing angle is given by:
𝐵 ∝ = 𝑉𝐼 = 𝜎−𝑠𝑖𝑛𝜎𝜋 ×𝐿 ……….. 2.3 [1]. Substituting equation 2.1 into 2.3 gives
𝐵 ∝ = 2 ∝−𝜎 + 𝑠𝑖𝑛 2∝𝜋×𝐿 ……….. 2.4 [3].
Where is the conduction angles
XL is the reactance of the reactor at a fundamental frequency. From equation 2.3 and 2.4, the system voltage is given by:
𝑉 = 𝐼,𝜋 𝑋𝐿
2 ∝−𝜎 + 𝑠𝑖𝑛 2∝ ……….. 2.5 [3].
3.0 SVC Power Factor Correction (PFC) Capability in Power System
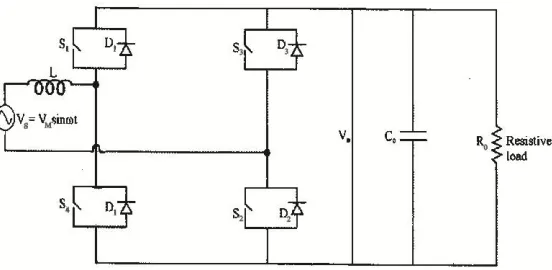
[image:3.612.65.539.158.674.2]the system voltage. To implement this, a circuit configuration with a resistive load consisting of TCR +FC, obtained from self-commutated PWM converter system was used.
Figure 3.1: Circuit 1 with a resistive load
Analysis of the Circuit
(a) S1 S2 closed (current decreasing):
Current loop: Vs L Dl Vo D2 Vs Equation: decreasing current 0 0 ] [ ) / 1 ( 0 V V L dt dis V dt Ldis V s s
L
/
]
V
t
sin
V
[
m
0
3.1 Again,dt
V
d
C
i
0 0 C
R
V
i
0 R
0
R
V
dt
V
d
C
i
i
i
0 00 R C
S
0
R
V
dt
V
d
C
i
0 00
S
R
V
i
C
1
dt
V
d
0 S 0 0 3.2(b) S3 S4 closed (current increasing):
increasing current 0 s s 0 s]
V
V
[
)
L
/
1
(
dt
di
dt
V
0
Ldis
V
]
V
t
sin
V
)[
L
/
1
(
dt
dis
0m
3.3 Again,dt
V
d
C
i
0 0 C
R
V
i
0 R
R CS i i
i
:. R V dt V d C
iS 0 0
0 0 0 0
0
R V dt V d C iS R V i dt V d
Co 0 S 0
I V R
C dt V
d S O
O
0 1 3.4
3.1 Simulation Results
The circuit equations were loaded with the parameters defined below:
Vs = 220
2
, ωt = 2πft, switching period 4kHz. Assume ac and dc input power filters as L =5mH, C = 0.6F, and load resistance of R = 20Ω. And the four equations were solved in
MATLAB using Runge-Kuta; thus the plot of the output voltage and current waveforms are
shown in figure 3.2.
4. Conclusion
The computer simulated curves for Figure 3.2 showed that current had tracked the voltage thus,
improved the power factor significantly to about 98%. Note that a high load power factor brings
about an overall system balance in addition to the following:
(i) Improvement of voltage regulation
(ii) Enhancement of transmission system efficiency
References
Edwards, C. et al (1986); “Advanced Static Var Generator Employing G.T.O. Thyristors” IEEE
Trans. on Power Delivery, Vol. 3, No. 4, pp. 1622 – 1627.
Hadi Saadet (2004); Power System Analysis, Second Edition. McGraw-Hill Publication.
Ibekwe, B.E. et al (2014); Girding Principles in selecting a.c to d.c Converters for Power Factor
Correction in a.c Transmission System, IJERA Publication.
Prabha Kundur (2010); Power System Stability and Control, Tata, McGraw-Hill Edition.
Walker, L. (1986); “Force-Commutated Reactive Power Compensation”, IEEE Trans. Industrial