Hanley, B and Mohan, A (2006) Gait parameter changes during 10000 metre treadmill running. Proceedings of the XXIV Symposium on Biomechanics in Sports. 518 - 521 (4). ISSN 1999-4168
Link to Leeds Beckett Repository record: http://eprints.leedsbeckett.ac.uk/656/
Document Version: Article
The aim of the Leeds Beckett Repository is to provide open access to our research, as required by funder policies and permitted by publishers and copyright law.
The Leeds Beckett repository holds a wide range of publications, each of which has been checked for copyright and the relevant embargo period has been applied by the Research Services team.
We operate on a standard take-down policy. If you are the author or publisher of an output and you would like it removed from the repository, please contact us and we will investigate on a case-by-case basis.
GAIT PARAMETER CHANGES DURING 10000 METRE TREADMILL RUNNING
Brian Hanley and Anna Mohan
Carnegie Research Institute, Leeds Metropolitan University, Leeds, UK
The purpose of this study was to measure the effects of fatigue on gait parameters during running. Research has shown that changes due to fatigue include those of step length, cadence, flight time, and joint angles. Thirteen male distance runners ran 10000 m at a pace equivalent to 103% of their personal best time. Kinetic data was collected using a Gaitway treadmill (1000 Hz), and kinematic data using two RedLake MotionPro high-speed cameras (250 Hz). Data was collected at five points. Repeated measures ANOVA showed that there were significant differences in maximum force, impulse, and contact time (p < .01). Dependent t-tests showed a significant difference for the knee angle at take-off (p < .01). The kinetic and temporal changes occurred as early as 3000 m. Athletes are recommended to race at a constant pace to reduce the effects of fatigue.
KEY WORDS: distance running, fatigue, force, gaitway treadmill.
INTRODUCTION: Relatively few studies have been conducted that have considered the effects of fatigue on long distance runners, despite its importance on race performance. Elliot and Ackland (1981) suggested that the identification and appropriate correction of deterioration in a runner’s technique would be of value in enhancing performance. Previous research on the effects of fatigue have mostly shown a difference in step length and cadence (Elliot and Ackland, 1981; Williams et al., 1991; Shim et al, 2003). These changes were brought about by changes in flight time (Williams et al., 1991), increases in the vertical displacement of the centre of mass (Anderson, 1996), and changes in the joint angles of the lower limbs (Shim et al., 2003). The aim of this study was to measure kinetic and kinematic variables in 10 km distance running and investigate how they altered during the course of the run.
METHOD: Thirteen male competitive distance runners gave informed consent and the study was approved by the University’s ethics committee. All participants had competed in a 10 km race in the previous month, and were free from injury. The participants’ mean age was 31 yrs (± 7), stature 1.79 m (± .09), and mass 65.2 kg (± 7.2). Their personal best times for the 10 km race ranged from 30 to 35 minutes. Each participant ran for 10 km on a treadmill (Gaitway, Traunstein) at a pace that resulted in a running time equivalent to 103% of their personal best time. The average treadmill speed during testing was 17.5 km/hr (± .7) and each runner ran at a constant pace for the duration of the test. Kinetic data was recorded using the Gaitway treadmill, which has two in-dwelling force plates (Kistler, Winterthur). The sampling rate was 1000 Hz. Data was collected for thirty seconds at five times during the run, beginning at a calculated time that resulted in the midpoint of data collection coinciding with 1500 m, 3000 m, 5000 m, 7500 m, and 9500 m of total distance run. As well as kinetic data, the associated software (Gaitway, Traunstein) gave values for step length, cadence, and temporal data. Two stationary high-speed cameras (RedLake MotionPro, Tucson) were placed perpendicular to and behind the treadmill respectively. The sampling rate was 250 Hz, with a shutter speed of 1/500 s. Each camera was placed approximately 5.3 metres from the treadmill. Two spotlights (1250 W) were placed at the side of each camera and turned on during recording. Two seconds of data was recorded at each of the five recording points, allowing analysis for approximately six steps in each case. Because of time constraints, only the first and last recordings of each run were analysed. These recordings were digitised using SIMI Motion (Munich) and filtered using a Butterworth low-pass filter.
RESULTS: Table 1 shows the results for the forces at impact peak, midsupport, and active peak, as well as the weight acceptance and push-off rates. Impact peak is defined as the highest recorded force during the first 70 ms of contact with the treadmill; midsupport is defined as the minimum force value recorded between the impact and active forces; while the maximum force occurred in all cases during the active peak.Only vertical ground reaction forces are displayed as it is not possible to record shear forces with the treadmill. Weight acceptance is the slope of the force curve during the loading phase, taken from the point of 10% of the impact peak force to the point of 90%; while the push-off rate is the slope of the force curve during unloading, taken from the point of 90% of push-off peak force to the point of 10%.
Table 1: Force data and loading rates at each distance (mean ± SD)
Distance
Impact peak (N)
Midsupport (N)
Maximum (active) (N)
Wt. acceptance (N/s)
Push-off rate (N/s)
1500 m 1495 (± 205) 1745 (± 190) 1975 (± 140) 22495 (± 4990) 19115 (± 3215)
3000 m 1510 (± 185) 1750 (± 180) 1975 (± 130) 22600 (± 5260) 19415 (± 3160) 5000 m 1520 (± 170) 1740 (± 175) 1960 (± 125) 22840 (± 5530) 19110 (± 3510) 7500 m 1500 (± 170) 1715 (± 195) 1930 (± 140) 22440 (± 5075) 19310 (± 3245) 9500 m 1495 (± 175) 1705 (± 195) 1920 (± 140) 22445 (± 5295) 19545 (± 3415)
Impact forces remained relatively constant throughout the run, although midsupport forces showed a decrease, mainly from 5000 m to the finish. Maximum forces decreased as the run progressed, and this decrease was significant (F = 15.10, p < 0.01, eta2 = .557, power = 1.000). Post hoc tests showed that the values at 9500 m were significantly lower than those at each point up to and including 5000 m. Although weight acceptance rates fluctuated and push-off rates increased during the runs, no significant differences were found for these variables.
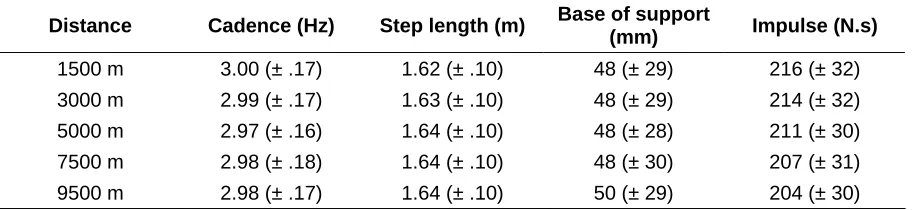
Running speed is a product of step frequency (cadence) and step length. The values for these measurements, as well as base of support and impulse, are shown in Table 2 below. When expressed as a percentage, step length was on average 91% of overall stature, with a range between 81 and 100%.
Table 2: Cadence, step length, base of support, and impulse (mean ± SD)
Distance Cadence (Hz) Step length (m) Base of support
(mm) Impulse (N.s)
1500 m 3.00 (± .17) 1.62 (± .10) 48 (± 29) 216 (± 32)
3000 m 2.99 (± .17) 1.63 (± .10) 48 (± 29) 214 (± 32) 5000 m 2.97 (± .16) 1.64 (± .10) 48 (± 28) 211 (± 30) 7500 m 2.98 (± .18) 1.64 (± .10) 48 (± 30) 207 (± 31) 9500 m 2.98 (± .17) 1.64 (± .10) 50 (± 29) 204 (± 30)
Cadence and step length remained consistent throughout the run, as did the base of support. No significant differences were found for these variables. However, impulse (in the vertical direction) did decrease significantly (F = 56.35, p < 0.01, eta2 = .824, power = 1.000). The post hoc tests showed that the values for impulse at 1500 m and 3000 m were significantly different from those at 5000 m, 7500 m and 9500 m.
[image:3.595.71.529.527.632.2]38.71, p < 0.01, eta2 = .763, power = 1.000). Furthermore, the proportion of step time spent in contact with the treadmill also changed significantly (F = 23.42, p < 0.01, eta2 = .696, power = 1.000), decreasing from 57.3% of total step time at 1500 m to 53.9% at 9500 m, leading to an increase in flight time. This is shown in Figure 1. Post hoc tests showed that the contact times and their proportion of step time at 1500 m and 3000 m were significantly different from those at 5000 m, 7500 m, and 9500 m.
Components of step time
0.00 0.05 0.10 0.15 0.20 0.25 0.30 0.35 0.40
1500 3000 5000 7500 9500
Distance run (m)
Ti
m
e
(
s
) Step time
[image:4.595.136.468.193.353.2]Contact time Flight time
Figure 1: The mean values and standard deviations for step time, contact time, and flight time (s).
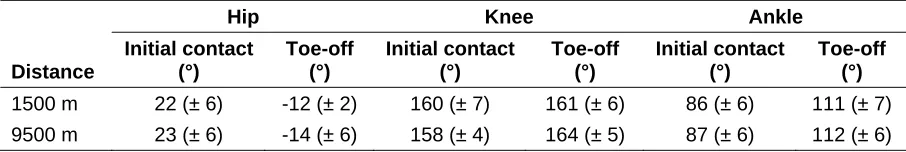
The kinematic measurements taken from the digitised video data included distances from the body’s centre of mass to the supporting foot, as well as joint angles of the hip, knee, and ankle. The average distance of the centre of mass behind the foot at initial contact was .33 m (± .04) at both 1500 m and 9500 m, while the distance of the centre of mass ahead of the foot at toe-off was .46 m (± .04) at both distances. The main findings for the lower limb joint angles are summarised in Table 3. In the neutral position, the value for the hip is 0°; the value for the knee, 180°, and the value for the ankle, 90°.
Table 3 Lower limb joint angles at 1500 m and 9500 m (mean ± SD)
Hip Knee Ankle
Distance
Initial contact (°)
Toe-off (°)
Initial contact (°)
Toe-off (°)
Initial contact (°)
Toe-off (°)
1500 m 22 (± 6) -12 (± 2) 160 (± 7) 161 (± 6) 86 (± 6) 111 (± 7)
9500 m 23 (± 6) -14 (± 6) 158 (± 4) 164 (± 5) 87 (± 6) 112 (± 6)
The hip is flexed at 22° and 23° at initial contact and hyperextended at toe-off by 12° and 14° at 1500 m and 9500 m respectively. The angle of the knee was flexed to approximately 160° at both stages, although the range of values for the knee at initial contact was 141 to 167°. Only the angle of the knee at toe-off showed a significant difference, increasing from 161° to 164° (t = -3.436, p < 0.01). Most participants’ ankles were dorsi-flexed at initial contact (those who landed on the forefoot tended to land with ankles slightly plantar-flexed, at approximately 95°). Plantar-flexion at toe-off was approximately 22° beyond the neutral position at both stages.
[image:4.595.71.524.503.579.2]cadence. This was caused by an increase in the extension of the hip and knee at take-off between 1500 m and 9500 m by 2° and 3° respectively. Although overall step time remained stable throughout the run, the percentage of time spent in contact did decrease by 3.4%. This is similar to the finding of Williams et al. (1991) who stated that step length is increased during the fatigued state through an increase in flight time. It may be that one response to increased lower leg muscular fatigue is to spend less time in weight-bearing stance. The decrease in maximum force and impulse may be a result of the leg muscles’ inability to maintain their force output.
The difference in gait parameters that were found to be significant occurred after the 5000 m point in all cases, and as early as 3000 m in some. The effects of fatigue are therefore exhibiting themselves as early as halfway during a fast run, and it could be assumed that they would exhibit themselves even earlier during an actual race. This is not unusual as many athletes run the first few kilometres of a 10 km race faster than the remainder. The athletes in the present study ran at a constant pace and their results do not show the great changes in step length and cadence which previous authors have found where athletes have run at their own pace (e.g. Elliot and Ackland, 1981). This supports the notion that it is best to run a distance race at a constant pace, from both a physiological and biomechanical point of view.
A limitation of using the Gaitway treadmill is its inability to record shear forces; thus it is not possible to measure important variables which may have changed due to fatigue (e.g. propulsive anterio-posterior forces). So, while maximum active forces decreased as the run progressed, it is possible that horizontal propulsive forces increased in order to maintain horizontal speed. Although all athletes were experienced at running on treadmills, it is an artificial setting in comparison with track or road running and therefore it is not certain that the athletes adopted their normal running technique. Further studies investigating the effects of fatigue in natural outdoor race conditions are warranted.
CONCLUSION: The gait parameters which changed significantly during a 10000 m treadmill run were maximum force, impulse, and contact time. Fatigue was shown to have an effect on important gait parameters as early as 3000 m, and these effects may be amplified in a faster race situation. Athletes and coaches should be aware that the maintenance of efficient running technique is crucial to successful racing performances and the reduction of risk of injury. A constant pace during racing and training (as appropriate) will possibly reduce the effects of fatigue and delay the stage at which they occur. Athletes should also train to maintain efficient running posture using strengthening and stabilising exercises.
REFERENCES:
Anderson, T. (1996). Biomechanics and running economy. Sports medicine,19, 76-89
Elliot, B. & Ackland, T. (1981). Biomechanical effects of fatigue on 10,000 meter running technique. Research Quarterly for Exercise and Sport, 52, 160-166.
Shim, J., Acevedo, E. O., Kraemer, R. R., Haltom, R.W., & Tryniecki, J. L. (2003). Kinematic changes at intensities proximal to onset of lactate accumulation. Journal of Sports Medicine and Physical Fitness. 43, 274-8.