© 2017, IRJET | Impact Factor value: 5.181 | ISO 9001:2008 Certified Journal
| Page 1784
Voltage Stability Enhancement in Large Power System by using
STATCOM
Punam Domkawale
1, V.K. Chandrakar
21
PG student[IPS],Dept.of EE,GHRCE,Nagpur,India
2Associate professor,Dept.of EE,GHRCE,Nagpur,India
---***---Abstract -
Incapability of the power system to keep aproper balance of reactive power and voltage control is the main factor affecting voltage instability. For voltage stability driving force is load. Shunt compensating devices can be used to maintained reactive power balance of the power system. During large disturbance improving the system voltage by upgrading the reactive power handling capacity of the system by using STATCOM is the area of study. Using Newton Raphson method power flow program is developed. PV curve has been generated by placing STATCOM at weakest bus in IEEE 57 bus system. Thus the effect of Static Synchronous Compensator (STATCOM) in voltage stability enhancement will be studied in this paper.
Key Words:
Voltage Stability, power flow, STATCOM,
IEEE 57 bus system, PV curve
1.INTRODUCTION
Three fundamental constituents of the power system are generating station which delivers power to the system, loads which consume power, transmission and distribution network which links various buses in the system and carries power from generating to load points [1]. In this highly established network, system enters a state of voltage instability when there is increase in load demand or change in system condition. It results in decline in voltage progressively [3]. Maintaining adequate voltage level economically is the primary facing problem. They are holding the determined probable capacity for their bulk transmission system to avoid the charge of building new lines and generation amenities. When a bulk transmission system is functioned close to the voltage instability limit, it turn out to be difficult to control the reactive power margin for that system. As a consequence the system stability becomes major concerns and an appropriate way must be found to monitor the system and voltage collapse.
Voltage instability problems can be solved by providing adequate reactive power support at appropriate location in the system. For these reason various compensating devices
used by utilities, each of which has its own characteristics and limitation.
Voltage stability is the ability of the power system to maintain adequate voltage magnitude such that the actual power transferred by system nominal load to that load will increase. PV curve is widely used in industry for investigating stable and unstable condition. .
In this paper, PV curve has been generated by identifying stable and unstable condition at the buses. Along with PV curve, line stability index method is used which determine the line stability factor shows best optimum location to place the STATCOM. By placing STATCOM at more sensitive bus results in increment in voltage magnitude [7].
II. STATCOM OVERVIEW
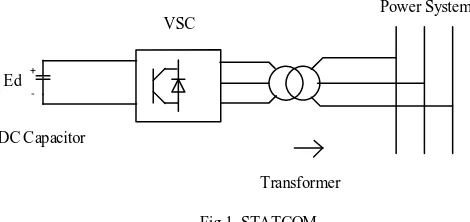
Synchronous voltage source with minimum and maximum voltage magnitude limits is signified as STATCOM. The bus at which STATCOM is connected is referred as PV, which may change to PQ bus in the events of limit being violet. Representation of STATCOM is as shown in Fig 1.
Power System VSC
Transformer DC Capacitor
[image:1.595.314.549.556.667.2]Ed
Fig 1. STATCOM +
© 2017, IRJET | Impact Factor value: 5.181 | ISO 9001:2008 Certified Journal
| Page 1785
Practically a STATCOM is mounted to support electricitynetworks that have a poor power factor and often poor voltage regulation and the most collective use is for voltage stability. A static synchronous compensator is a voltage source converter based device, with voltage source behind a reactor. With DC capacitor voltage source is created and therefore a Static Synchronous Compensator has very little active power capability. If a suitable energy storage device is connected across the dc capacitor STATCOM active power capability increased. The reactive power at the terminals of Static Synchronous Compensator depends on the amplitude of voltage source. In the principle of the STATCOM output voltage can be regulated in such a way that the reactive power of the STATCOM can be changed.
III. NEWTON RAPHSON METHOD
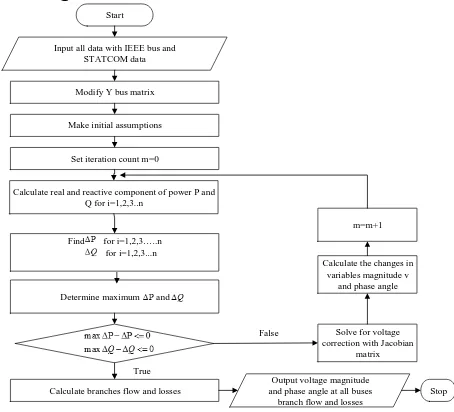
The Newton–Raphson method is very popular due to its fast convergence with a less iterations. Newton Raphson is an interactive algorithm for solving a position of simultaneous nonlinear equations with an equal number of unknowns. Flowchart of Newton Raphson method with STATCOM is as
[image:2.595.326.550.213.278.2]shown in Fig.2
Fig.2. Flowchart of Newton Raphson method with STATCOM
IV.OPTIMAL PLACEMENT OF STATCOM USING
VOLTAGE SENSITIVITY APPROACH
For present-day power systems, Voltage stability is becoming enlarging source. The problem of voltage instability is mainly examined as the incapability of the network to meet the load demand imposed in terms of poor reactive power support or active power transmission
capability or both. It is mainly concerned with the analysis and the enhancement of steady state voltage stability depends on L-index. This L-index determines how any system is close to its instability limit.
The line stability index is specified by Lmn, which depend on single line concept shown in Fig .3
R+jX
P+jQ
Vs<
s
Vr<
r
Fig 3. Single line diagram of transmission line
Here,
Vs and Vr are sending and receiving end voltages.
R+jX is the impedance.
P+JQ is the apparent power.
The real term of above equation is,
The imaginary term of above equation is,
Then after simplifying equation
Start
Input all data with IEEE bus and STATCOM data
Make initial assumptions
Set iteration count m=0
Determine maximum and Modify Y bus matrix
Calculate branches flow and losses Find for i=1,2,3…..n
for i=1,2,3...n Calculate real and reactive component of power P and
Q for i=1,2,3..n
Output voltage magnitude and phase angle at all buses branch flow and losses
Stop m=m+1
Calculate the changes in variables magnitude v
and phase angle
Solve for voltage correction with Jacobian
matrix True False ) 1 ( jX R
I
V
s
SV
r
r) 2 (
*
jQ Vr I
P ) 3 ( ) ( jX R Vr r s VsVr jQ
P
) 4 ( V -r) -s ( ) )(
(P jQ R jX VsVr
r2) 5 ( ) ( ) cos(
* 2
XQ RP V
r s
VsVr
rRQ
XP
r
s
VsVr
*
sin(
)
[image:2.595.55.282.401.607.2]© 2017, IRJET | Impact Factor value: 5.181 | ISO 9001:2008 Certified Journal
| Page 1786
V. TEST SYSTEM
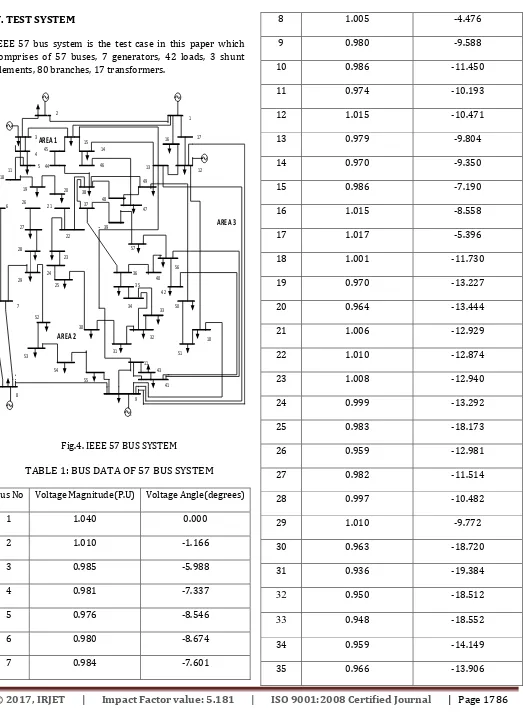
[image:3.595.42.565.87.809.2]IEEE 57 bus system is the test case in this paper which comprises of 57 buses, 7 generators, 42 loads, 3 shunt elements, 80 branches, 17 transformers.
[image:3.595.31.559.113.811.2]Fig.4. IEEE 57 BUS SYSTEM
TABLE 1: BUS DATA OF 57 BUS SYSTEM
Bus No Voltage Magnitude(P.U) Voltage Angle(degrees)
1 1.040 0.000
2 1.010 -1.166
3 0.985 -5.988
4 0.981 -7.337
5 0.976 -8.546
6 0.980 -8.674
7 0.984 -7.601
8 1.005 -4.476
9 0.980 -9.588
10 0.986 -11.450
11 0.974 -10.193
12 1.015 -10.471
13 0.979 -9.804
14 0.970 -9.350
15 0.986 -7.190
16 1.015 -8.558
17 1.017 -5.396
18 1.001 -11.730
19 0.970 -13.227
20 0.964 -13.444
21 1.006 -12.929
22 1.010 -12.874
23 1.008 -12.940
24 0.999 -13.292
25 0.983 -18.173
26 0.959 -12.981
27 0.982 -11.514
28 0.997 -10.482
29 1.010 -9.772
30 0.963 -18.720
31 0.936 -19.384
32
0.950 -18.51233
0.948 -18.55234 0.959 -14.149
35 0.966 -13.906
1 2
3
4 5 11 18
26
27
28
29
15 14
46 45
44
19 20
21
22
23
24 25
52 6
7
30
31
32
11 43
41
9 55
54 53
8
51 10 50 42
56 40 36
35
34 33 57 39 37 38
48
17 16
12 13
49
47 AREA 1
AREA 2
© 2017, IRJET | Impact Factor value: 5.181 | ISO 9001:2008 Certified Journal
| Page 1787
36 0.976 -13.635
37 0.985 -13.446
38 1.013 -12.735
39 0.983 -13.491
40 0.973 -13.658
41 0.996 -14.077
42 0.967 -15.533
43 1.010 -11.354
44 1.017 -11.856
45 1.036 -9.270
46 1.060 -11.116
47 1.033 -12.512
48 1.027 -12.611
49 1.036 -12.936
50 1.023 -13.413
51 1.052 -12.533
52 0.980 -11.498
53 0.971 -12.253
54 0.996 -11.710
55 1.031 -10.801
56 0.968 -16.065
[image:4.595.31.566.86.756.2]57 0.965 -16.584
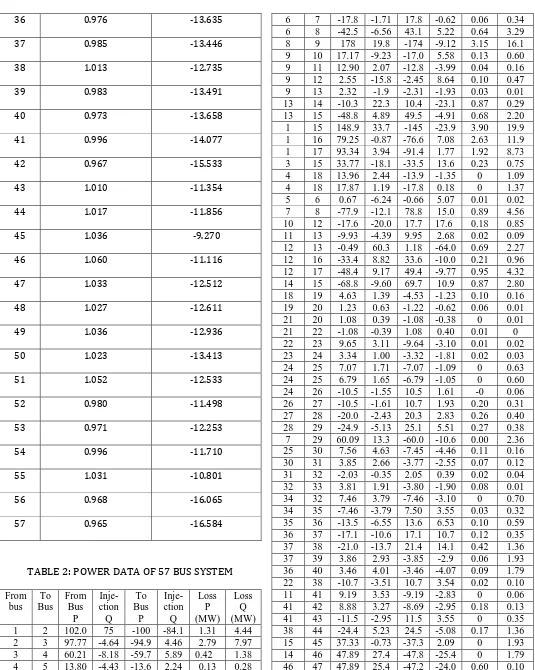
TABLE 2: POWER DATA OF 57 BUS SYSTEM
From bus
To Bus
From Bus
P
Inje- ction Q
To Bus P
Inje- ction Q
Loss P (MW)
Loss Q (MW) 1 2 102.0 75 -100 -84.1 1.31 4.44 2 3 97.77 -4.64 -94.9 4.46 2.79 7.97 3 4 60.21 -8.18 -59.7 5.89 0.42 1.38 4 5 13.80 -4.43 -13.6 2.24 0.13 0.28 4 6 14.16 -5.09 -14.0 2.08 0.09 0.33
© 2017, IRJET | Impact Factor value: 5.181 | ISO 9001:2008 Certified Journal
| Page 1788
48 49 0.08 -7.38 -0.04 6.93 0.40 0.13 [image:5.595.31.566.79.802.2]49 50 9.96 4.43 -9.58 -4.30 0.84 0.35 50 51 -11.4 -6.20 11.6 6.56 0.22 0.66 10 51 29.6 12.5 -29.6 -11.8 0 3.50 13 49 32.4 33.8 -32.4 -30.3 0 0.60 29 52 17.9 2.55 -17.4 -1.95 0.46 0.16 52 53 12.55 -0.25 -12.1 0.41 0.12 0.16 53 54 -7.57 -4.47 7.72 4.66 0.15 0.19 54 55 -11.8 -6.06 12.1 6.46 0.30 0.40 11 43 13.59 4.85 -13.5 -4.55 0 0.31 44 45 -36.5 3.28 37.3 -2.09 0.81 1.62 40 56 3.46 4.07 -3.46 -3.74 0 0.33 56 41 -5.43 0.66 5.61 -0.49 0.17 0.18 56 42 -1.58 1.46 1.59 -1.45 0.01 0.02 39 57 3.85 2.92 -3.85 -2.61 0 0.31 57 56 -2.85 0.61 2.86 -0.58 0.02 0.02 38 49 -4.66 -10.5 4.80 10.4 0.14 0.22 38 48 -17.2 -19.3 17.4 19.7 0.20 0.32 9 55 18.93 10.3 -18.9 -9.86 0 0.52
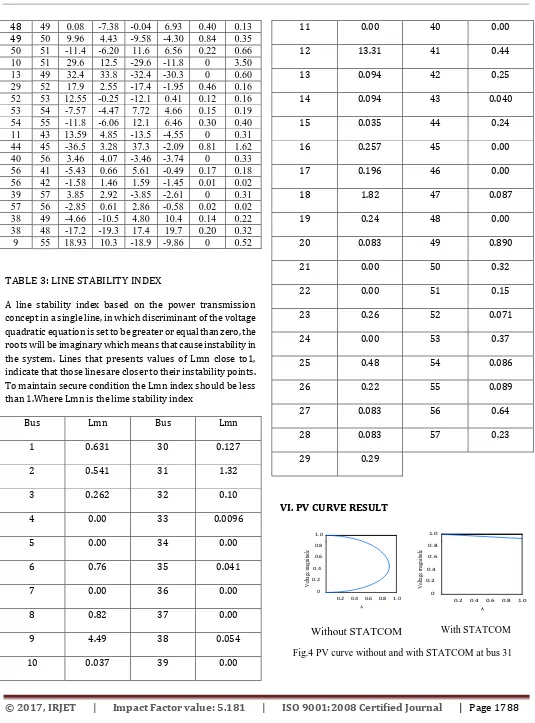
TABLE 3: LINE STABILITY INDEX
A line stability index based on the power transmission concept in a single line, in which discriminant of the voltage quadratic equation is set to be greater or equal than zero, the roots will be imaginary which means that cause instability in the system. Lines that presents values of Lmn close to1, indicate that those lines are closer to their instability points. To maintain secure condition the Lmn index should be less than 1.Where Lmn is the lime stability index
Bus Lmn Bus Lmn
1 0.631 30 0.127
2 0.541 31 1.32
3 0.262 32 0.10
4 0.00 33 0.0096
5 0.00 34 0.00
6 0.76 35 0.041
7 0.00 36 0.00
8 0.82 37 0.00
9 4.49 38 0.054
10 0.037 39 0.00
11 0.00 40 0.00
12 13.31 41 0.44
13 0.094 42 0.25
14 0.094 43 0.040
15 0.035 44 0.24
16 0.257 45 0.00
17 0.196 46 0.00
18 1.82 47 0.087
19 0.24 48 0.00
20 0.083 49 0.890
21 0.00 50 0.32
22 0.00 51 0.15
23 0.26 52 0.071
24 0.00 53 0.37
25 0.48 54 0.086
26 0.22 55 0.089
27 0.083 56 0.64
28 0.083 57 0.23
29 0.29
VI. PV CURVE RESULT
0 0.2 0.4 0.6 0.8 1.0
0.2 0.4 0.6 0.8 1.0
V
ol
ta
ge
m
agni
tude
y
With STATCOM
Fig.4 PV curve without and with STATCOM at bus 31
0 0.2 0.4 0.6 0.8 1.0
0.2 0.4 0.6 0.8 1.0
V
ol
ta
ge
m
agni
tude
y
© 2017, IRJET | Impact Factor value: 5.181 | ISO 9001:2008 Certified Journal
| Page 1789
Nose curve or PV curve for voltage magnitude with and [image:6.595.34.565.129.797.2]without STATCOM as shown in Fig.4. STATCOM is placed at bus 31 hence voltage get improved.
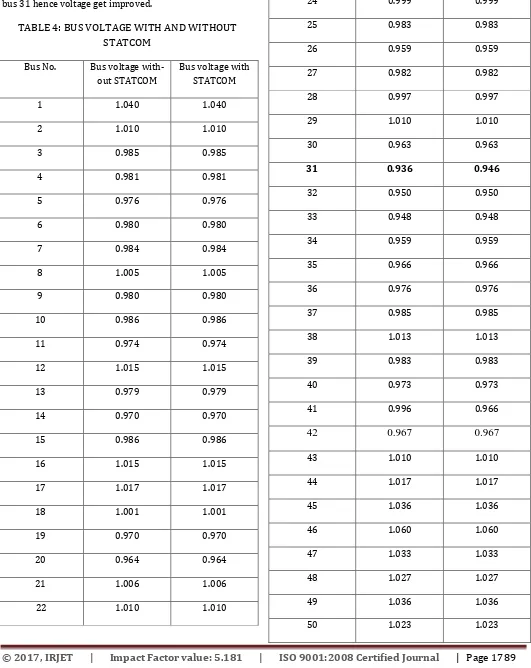
TABLE 4: BUS VOLTAGE WITH AND WITHOUT
STATCOM
Bus No. Bus voltage with- out STATCOM
Bus voltage with STATCOM
1 1.040 1.040
2 1.010 1.010
3 0.985 0.985
4 0.981 0.981
5 0.976 0.976
6 0.980 0.980
7 0.984 0.984
8 1.005 1.005
9 0.980 0.980
10 0.986 0.986
11 0.974 0.974
12 1.015 1.015
13 0.979 0.979
14 0.970 0.970
15 0.986 0.986
16 1.015 1.015
17 1.017 1.017
18 1.001 1.001
19 0.970 0.970
20 0.964 0.964
21 1.006 1.006
22 1.010 1.010
23 1.008 1.008
24 0.999 0.999
25 0.983 0.983
26 0.959 0.959
27 0.982 0.982
28 0.997 0.997
29 1.010 1.010
30 0.963 0.963
31 0.936 0.946
32 0.950 0.950
33 0.948 0.948
34 0.959 0.959
35 0.966 0.966
36 0.976 0.976
37 0.985 0.985
38 1.013 1.013
39 0.983 0.983
40 0.973 0.973
41 0.996 0.966
42
0.967
0.967
43 1.010 1.010
44 1.017 1.017
45 1.036 1.036
46 1.060 1.060
47 1.033 1.033
48 1.027 1.027
49 1.036 1.036
© 2017, IRJET | Impact Factor value: 5.181 | ISO 9001:2008 Certified Journal
| Page 1790
51 1.052 1.052
52 0.980 0.980
53 0.971 0.971
54 0.966 0.966
55 1.031 1.031
56 0.968 0.968
57 0.965 0.965
By identifying weakest bus in IEEE 57 bus system using PV curve and line stability index method STATCOM is placed. Here bus number 31 is found as weakest bus where STATCOM is placed which results in improving the voltage magnitude at that bus.
VII. CONCLUSION
This paper presents comparative model to describe voltage stability with and without STATCOM. It has demonstrated voltage stability analysis using IEEE 57 bus system model. The results on IEEE 57 bus test system have clearly shown that how STATCOM devices increased the area bus voltage level. It is believed that this paper may provide the effect of STATCOM on voltage stability.
VIII. REFERENCES
[1] M. A. Abdel-Moamen and N. P. Padhy, “Optimal Power Flow Incorporating FACTS Devices Bibliography and Survey”, IEEE PES Transmission and Distribution Conference and Exposition, 7–12 September 2003, vol. 2, pp. 669 – 676.
[2] Tyll.H.K. “FACTS Technology for Reactive Power Compensation and System Control”, IEEE/PES Conference on Transmission and Distribution, 2004, pp.976-980, Nov. 2004
[3] IEEE Publication 90 TH 0358-2 PWR, "Voltage stability analysis of power systems: Concepts, analytical tools, and industry experience," Report prepared by IEEE Working Group on Voltage Stability, 1990.
[4] N. Yorino, E. E. El-Araby, H. Sasaki, and Sh. Harada, "A new formulation for FACTS allocation for security against voltage collapse," IEEE Trans.
Power Systems, Vol. 18, No. 1, pp. 3-10,February 2003.
[5] Bulk Power System Voltage Phenomena-Voltage Stability and Security, EPRI Research Projects 2473-21,1989.
[6] G. Wu, A. Yokoyama, J. He, and Y. Yu, "Allocation and control of FACTS devices for steady-state stability enhancement of largescale power system," International Conference on Power System Technology, Vol. 1, pp. 357-361, 18-21 Aug. 1998.
[7] Jong, Su Yoon Soo, Yeol Kim Yong, Hak Kim Kyu, Chul Lee Chang, Keun Lee, “The analysis of STATCOM and SVC Cooperation Effect”, Transmission and Distribution Conference, Asia and pacific, 2009, pp1-5, Oct
[8] B. Gao, G.K. Morison, P. Kundur, “Towards the development of a systematic approach for voltage stability assessment of large-scale Power Systems,” IEEE Trans. Power Syst., Vol. 11, No. 3, pp. 1314- 1324, Aug.
[9] A. Sode-Yome and N. Mithulananthan, “Comparison of SVC, STATCOM and SSSC performance in steady state voltage improvement,” International Journal of Electrical Engineering Education, UMIST, Vol.41, No. 3, July 2004N.