ON THE CAPACITY OF MULTICELL COVERAGE MIMO
SYSTEMS IN HIGH ALTITUDE PLATFORM CHANNELS
1WALID M. RAAFAT,2HOSNY A. EL-MOTAAFY
1 Communication Engineering Department, Al Azhar University, Cairo, Egypt 2 Communication Engineering Department, H.T.I OF 10th of Ramadan, Cairo, Egypt
Email: [email protected], [email protected]
ABSTRACT
This paper is a comparative study between the performances of conventional terrestrial multicell Multiple Input Multiple Output (MIMO) working in a Rayleigh fading environment and its corresponding High Altitude Platform (HAP) system working under a different Path Loss (PL) model with the capacity as the performance metric of interest, calculated using the Singular Value Decomposition (SVD). Both systems are assumed to be affected by cochannel interference users in other cells .Simulation results show that the performance of multicell MIMO HAP dependent system outperforms its corresponding that works in terrestrial environment in terms of per user channel capacity.
Keywords: Multiple-input multiple-output (MIMO), cochannels interference, Rayleigh fading, High
Altitude Platforms (HAP), Singular Value Decomposition (SVD).
1.INTRODUCTION
The last decade has experienced an acute competition in the field of wireless communications developments either by extending the capability of existing systems or by developing new systems. Nowadays most of broad band wireless services are provided through terrestial systems or via satellites. The height of the communication platform appears to be quantized to either a near ground heights of about 50m or Satellite heights that are extremely large, about 36,000km ,for geosynchronous orbits. Intermediate heights were not allowed due to the stability considerations and limitations set by the existence of a suitable platform carrying the communications equipment. Thus; HAPs are still considered temporary solutions whose benefits appear only in disaster environments or military applications but can not as a permanent system serving civilians. Due to this limitation, terrestial systems were the best alternative to HAP systems. One of the problems limiting the system performance in a multi cell terrestial environment is the lacking of a Line of Sight (LoS) communications link between the served user and
his serving base station [1]. Nowadays,
communications platforms at intermediate heights began to appear in the form of a helicopter or a balloon, hanged at height of about 17km up to 30km. The exact mechanism of hanging the system is left as a problem to aerodynamics engineers and is
for HAP systems in the mm-wave band at 47/48 GHz, but they are not applicable in the neighborhood of the 2GHz band. Until 2008, there was no specific propagation model has been established for HAPs around 2GHz, and therefore
FSPL has been the widely used model. However, a simple FSPL propagation model is unsuitable for system simulations of mobile systems provided via HAPs in urban areas in which communications through HAPs is an ideal solution [4]. In a more
realistic statistical channel model has been proved to be suitable for HAPs based systems at least in the 2-6GHz band in which the licensed and the unlicensed versions of the 3G and 4G systems are operating . This model has been experimentally verified and validated through analytical and simulation studies validated by measurements. This propagation model, although distance dependent, has the advantage of being independent of the path loss exponent that differs according to the environment in which the system is set up. Another advantage of this model is that it is semi deterministic as it depends on the exact user location and is capable of statistically predicting the attenuation of the transmitted signal in the downlink and assuming the general large scale Log normal fading distribution as will be seen in section (III). In this paper the capacity performance of a general multi cell coverage system is investigated under both the Rayleigh and the HAPs channel models through extensive Monte Carlo (MC) simulations. The first channel model, that is the Rayleigh channel model, is considered as a typical channel model for Non Line of Sight (NLoS) terrestial communications and a HAPs channel [5]. The rest of the paper is organized as follows. In section (II) a novel description of the multi cell coverage system model is introduced along with expressions for the path loss (PL) of the HAP channel model, the Carrier to Interference plus Noise Ratio (CINR). Simulation results for both channel types are provided in section (IV) with the capacity as the performance metric of interest. Finally, the whole paper is concluded in section (V).
2. MULTICELL COVERAGE SCENARIO
2.1 Multi User Configuration
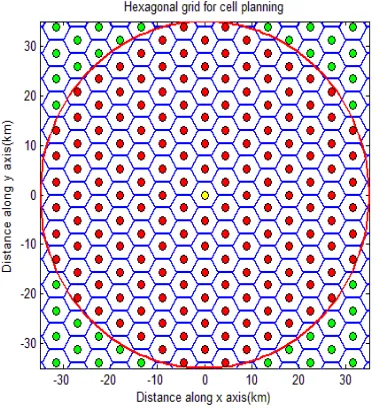
Let us consider a coverage area divided into M hexagonal cell downlinks and covered by a
communication system supporting K users. In
general K > M, thus frequency reuse concept is used due to the limited frequency resources. Due to the frequency reuse, the intended user receives interference signals leaking from antennas covering other cells which are allocated the same frequency band. This is called the cochannel interference. We shall assume a frequency reuse factor of 1, i.e., all users in all other cells will be cochannel users. Each of the M users is equipped with Nr receive antennas and is served by Nt transmit antennas hanged in the HAP payload [6].
In such a multi-cell MIMO communications scenario, depicted in Figure 1, the users conflict CCI, and for each user, there will be (M-1) Nt
interfering signals resulting from Nt transmitting antennas of the (M-1) cochannel users and arriving at each of the Nr receiving antenna of land mobile users.
Assuming that the desired user is located at the center of coverage area inside the central cell, the cell whose center is concentric with that of the coverage area, and so is the cochannel users. The HAP payload of each user has an array gain of
G
H ,whose boresight direction is directed towards the center of each cell whilek
θ
is the angle between the boresight direction of the central cell and that of theth
k
user.2.2 Interference In Multicell MIMO Cellular
Networks
In multi cell coverage systems, Additive White Gaussian Noise (AWGN) is not the only source of signal degradation and the interference power level resulting from cochannel users is also a source and is considered as one of the major parameters that limit the Quality of Service (QoS) of each of the M
[image:2.612.321.510.241.445.2]downlinks such as the link capacity (measured in bps). The Carrier to Interference plus Noise Ratio (CINR) can be expressed as
P
sI N
ζ
=
+
(1) Where ζ is the CINR,s
P is the carrier power received by the intended user, I is the average aggregate power resulting from the M-1 cochannel users and N is the average power of the AWGN. Based on the scenario introduced in section (II.A), the cochannel interference power can be expressed as [7].
1
1 1
1
, , , , , , ,
1 1 1
1
( )
(
) (
) (
)
t r
M
k k k k
N N M
H k H k i j U k i j k i j j k i
k
I
I PL d
P G
θ
G
θ
PL d
−
= ≠
−
= = = ≠
=
=
∑
∑∑∑
(2)
With I is the aggregate interference power transmitted by Nt transmitting antennas of the (M-1)
cochannel users and collected by the with Nr
receive antennas of the intended user,
,
H k
P is the power transmitted from a HAP payload, GH(.) is the antenna array gain of the HAP antenna payload,
(.) U
G is the antenna array gain of a land mobile
user and PL d( k i j, , )is the path loss experienced by a signal transmitted from the ithtransmitting antenna of the HAP payload of the cochannel users to the jth receiving antenna of the intended user. However, since the distance between the antennas carried on the HAP payload is much smaller than the HAP-land user separation; the distance between any of the receiving antennas of the desired user and any of the transmitting antennas of cochannel users are almost equal. Also we shall further assume that the receiving antenna array of a land mobile user is omnidirectional such thatGU(.)=1.
3. MODELING THE HAP PROPAGATION
CHANNEL
Up to this point the elements of a HAPs link are the HAPs antenna payload array, assumed to be a smart, the HAPs channel over which the desired signal propagates and the users' antennas, assumed to be omnidrectional. Each of which will be investigated in more detail in the next sections. Typically the elevation angle of the HAPs ranges from 10º up to 90º and the HAPs height h=17km : 30km .High elevation angles owing to the relatively small cell radius of HAP coverage technique also mean that the LOS propagation to the HAP is a reasonable assumption.
Therefore, FSPL is used in this article, and diffraction and shadowing are not explicitly considered without loss of general validity. In this paper we investigate the effect of an experimentally verified model that is suitable for the 2-6GHz broadband communications using the HAPs band for .The model is elevation angle dependent and assumes that the FSL can take place via a Line of Sight (LoS) path or a Non Line of Sight path (NLoS). This both propagation scenarios will be investigated in this paper. The model is suitable for four different types of environment were selected for the scenarios presented here and a measurement campaign demonstrated the applicability of the new propagation model [8].
1) Suburban area. 2) Urban area. 3) Dense urban area. 4) Urban high-rise area.
The path loss in built-up areas can be expressed in dB as in the following equations (7-8):
FSPL LOS
L
=
L
+
ζ
(3)With LFSPL is the free space path loss in dB is the shadowing loss and are correction factors responsible for the shadowing phenomenon that takes place in a dense urban environment and are represented as a Log normally distributed random variable that is:
L
FSPL=
20 log(
d
km) 20 log(
+
f
GHz) 92.4
+
(4)Where, dkm is the distance, in km, between the HAPs payload and the land mobile receiver andfGHz is the frequency in GHz. The shadowing lossζLoS (expressed in dB) is a function of the elevation angle θ is represented by a random variable (RV) that follows a normal distribution parameterized by:
(0, )
X
LoS XdB N
ζ = : σ (5)
The standard deviation X
σ of this normal
through an independent and identical wireless channel, that is ,each signal transmitted by one of the Nt antennas and received by any of the Nr
antennas of different users is subject to independent path loss, shadowing, and lognormal fading [9]. The probability distribution function (PDF) of the lognormal distribution can be written as
2 2
1 ( )
( ) exp
2
2 X X
X
p X
µ
σ
πσ
− = − (6)4. CAPACITY ANALYSIS
To utilize the maximum capacity of a MIMO channel, it will be assumed that the transmitting HAP antenna array of the intended user has a perfect knowledge of the channel state. This will justify the use of the Waterfilling algorithm for power distribution among the transmitting antennas based on the singular value decomposition of the channel
matrix H [9]. Thus, The CINR in (1) can be
expressed as
max
(
)
H H
P
I N
λ
ζ
=
+
HH
(7)Where
max( )
H
λ HH denotes the maximum
value resulting from singular value decomposition of the matrixHHH. Plugging the expression of the aggregate interference power of (2) in (1) and expressing the power of the AWGN in terms of its varianceσn2, the CINR in (7) can be expressed as max 1 2 , , , , , 1 1 1
1
(
)
(
)
(
)
t r H H N N Mn H k H k i j k i j
j k i
k
P
P
G
PL d
λ
ζ
σ
−θ
= = = ≠
=
+
∑∑∑
HH
(8)The elements of the channel state matrix Hare realizations of a random variable (RV) whose statistics obey either the Rayleigh distribution or the lognormal distribution representing the path loss of the HAP link as introduced in section (III), depending on the environment in which the link is established. In conventional terrestial systems, the Rayleigh distribution is the most preferred choice of most literature, however, for downlinks established via HAP, the lognormal distribution is more suitable, especially for systems operating in the 2-6 GHz band. For simplicity we shall assume
that
,
1
{1, 2,...,
}
H k
P
= ∀ ∈
k
K
, that is, equal poweris transmitted for all users in the DL. From the HAP channel model introduced in section (III), the path loss, expressed in normal units, as the product of a distance dependent FSPL and a shadowing RV
X between the ithtransmitting antenna of the HAP payload of a cochannel users to the jth receiving antenna of the intended user. Hence PL d( k i j, , )can be expressed as
PL d
(
k i j, ,)
=
PL d
(
k)
X
i j, (9)With the RV,Xi j, represents shadowing loss independent paths and uncorrelated channels. From the introduced assumptions, the CINR in (8) can be written as:
max 1 2
, , , 1 1 1
1
(
)
(
)
(
)
t r H N N Mn H k i j hap i j
j k i
k
G
PL d
X
λ
ζ
σ
−θ
= = = ≠
=
+
∑∑∑
HH
(10)The average capacity of multi-cell MIMO cellular network can be given by:
2 0
log (1
) ( )
t
C
B
ζ ζ ζ
p
d
∞
=
∫
+
E[ ]
(11)The statistics of the attenuation must be known for (11) to be analytically evaluated, however to avoid mathematical complexity, this problem will be numerically solved during simulations. A semi analytical approach will be followed to evaluate the capacity in (11) by generating a number of 10,000 channel realizations, calculating the conditional capacities and replacing the expectation operator by the arithmetic mean operator in order to average the
conditional capacities over the number of
realizations [10]-[11].
2 1
log (1
)
Q q q t
C
B
Q
ζ
=+
≈
∑
E[ ]
(12)max
2 1
1 2
, , , 1 1 1
1
(
)
log 1
( )
t r
H Q
t
N N M q
n k k i j q
k i j
k
B
C
Q
G
X
λ
σ
−θ
=
= = = ≠
=
+
+
∑
∑ ∑∑
HH
E[ ]
(13)
5. SIMULATION RESULTS
Based on the presented expression of the average capacity of the multi-cell MIMO cellular network with cochannel interference derived in Section III, the effect of various system parameters on the capacity will be analyzed and compared by numerical calculations and Monte Carlo (MC) simulations in this section [12].
5.1 Simulation Setup
In what follows, some parameters of the capacity model are configured as follows,
• Every MIMO HAP-user configuration has
no more than eight transmitting or receiving antennas used for transmission and receiving operations.
• For any user, the number of transmitting antennas is always equal to the number of receiving antennas.
• The waterfilling algorithm is used to
divide the power among transmit antenna.
• A coverage area of typical radius of 35km is divided into a hexagonal grid with a frequency reuse factor of unity.
• The desired user is located at the central cell while the remaining M-1 users are located at the centers of the cells they belong to.
• There is always a LoS path between the
HAP antenna payload and the land mobile users.
The spatial distribution of the locations of interfering users assumed above ensures that an average capacity is expected. A frequency reuse factor of 1 is assumed in order to allow all other cochannel M-1 users to be cochannel users that contribute to the interference signal. Under these assumptions, a limit on the minimum signal to interference plus noise ratio and hence a lower limit
[image:5.612.91.524.69.256.2]of capacity is set. The rest of simulation parameters are presented in Table 1, shown below.
Table 1: Simulation Parameters Of Coverage Area
Parameter Value
Radius of coverage area(km) 35 Number of cells 31 Cell radius (km) 3 Transmitter height(km) 22
Frequency reuse actor 1 Noise power (dBm) -100
5.2 Performance Analysis
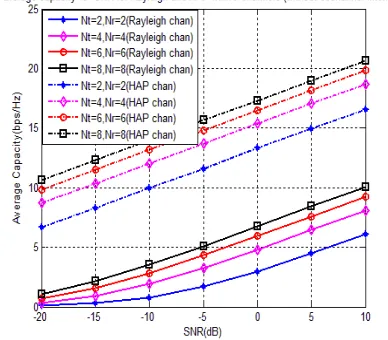
[image:5.612.320.514.522.692.2]Figure 2 illustrates the variability of the average capacity of a multi cell MIMO system with SNR, expressed in dB for different diversity orders ranging from 2
×
2 up to an 8×
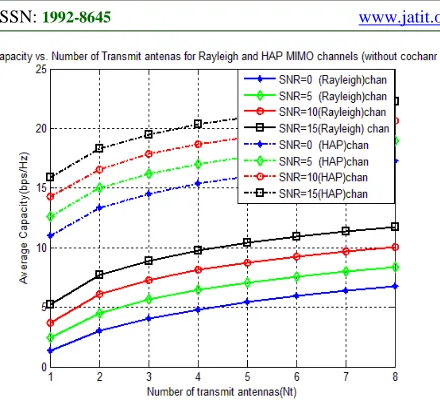
8 order system. The lower bundle of curves describe the increase of capacity with SNR is faster for low MIMO orders in links working under a Rayleigh environment, however; the average capacity of HAP links shows a constant growth rate with the SNR when working at different MIMO orders. In addition, it is clear that the average capacity of a HAP link is in general larger than that of its corresponding Rayleigh for the same MIMO order and the same SNR. In Figure 3, we first analyze the impact of increasing the number of transmit antennas, and hence the diversity order, on the average capacity per a HAP link in the absence of cochannel interference in both types of channels assumed. Simulation results show the following.For both channel types, the average capacity increases with increasing the number of transmit antennas .We also note that the rate of increase in the average capacity is the same for both channel types. However, for the same value of SNR and the same diversity order, the average capacity of a HAP link is larger than expected from a corresponding Rayleigh by about 11bps/Hz, This is true for all values of SNR and all diversity orders considered. This because the LoS nature of the HAP link that is dominant due to the very high elevation of the communications platform. Moreover, in each channel type, doubling the order of the diversity leads to an increase by an amount of 2bps/Hz in the link capacity. From Figure 4, the cochannel interference has great impact on the normalized downlink average capacity when the SNR is larger than or equal to -10 dB; however, the capacity is not much affected below a SNR of -10 dB and the performance of the HAP link in the absence of the cochannel interference is identical to the performance with it for the AWGN becomes the dominant source of signal degradation. After this turning point, the average capacity performance tends to show a very slow logarithmic increase with the SNR rather than following a linear relation in the absence of cochannel interference.
6.CONCLUSION
Throughout this paper it was proved through
7.CONCLUSION
Throughout this paper, an expression is derived for the average link capacity in a multi cell MIMO system covered by a high altitude communications platform. Simulation results show that multi cell MIMO systems covered by a high altitude communications platform outperforms conventional terrestial in terms of the per user link capacity as the performance metric of interest, for future work, it would be interest to explore the impact of different cooperative transmission schemes on the system capacity and how various multiple antenna techniques, opportunistic scheduling, and base station cooperation affect coverage.
8.FUTUREWORK
For future work, it would be interest to explore the impact of different cooperative transmission schemes on the system capacity and how various
multiple antenna techniques, opportunistic
scheduling, and base station cooperation affect coverage.
REFERENCES
[1] A. Mohammed, S. Arnon, D. Grace, M.
Mondin, and R. Miura, “Advanced
[image:6.612.94.314.73.276.2]communications techniques and applications for high-altitude platforms”, Editorial for a special issue inEURASIP Journal on Wireless Communications and Networking, vol. 2008, 2008. http://www.hindawi.com/journals/wcn/v olume-2008/si.7.html
[image:6.612.318.524.86.276.2]Figure 3: Average Capacity Vs. Number Of Transmit Antennas For Rayleigh And HAP Channels.
Figure 4: Average Capacity Vs. SNR Number Of A HAP Channel With And Without Cochannel
[2] C.-X. Wang, X. Hong, X. Ge, X. Cheng, G. Zhang, and J. S. Thompson, “Cooperative
MIMO channel models: a survey”, IEEE
Commun. Mag., vol. 48, no. 2, pp. 80–87, Feb. 2010.
[3] G. M. Djuknic, J. Freidenfelds, and Y. Okunev,
“Establishing wireless communications
services via high-altitude aeronautical platforms: A
concept whose time has come?”, IEEE
Communications Magazine, vol. 35, pp. 128-135, 1997.
[4] R. Steele, “Guest Editorial: An update on
personal communications”, IEEE
Communications Magazine, pp. 30-31,1992. [5] D. Grace, N. E. Daly, T. C. Tozer, A. G. Burr,
and D. A. J. Pearce, “Providing multimedia communications from high altitude platforms”,
International Journal of Satellite Communications, pp. 559-580, 2001.
[6] Jaroslav Holis, and Pavel Pechac, “Elevation Dependent Shadowing Model for Mobile Communications via High Altitude Platforms
in Built-Up Areas”, IEEE TRANSACTIONS
ON ANTENNAS AND PROPAGATION, vol.
56,pp. 1078–1084, APRIL 2008.
[7] Air Interface for Fixed and Mobile Broadband Wireless Access Systems-Amendment for Physical and Medium Access Control Layers forCombined Fixed and Mobile Operation in Licensed Band, IEEE Standard 802.16e-2005, 2005.
[8] K. Gulati, B. L. Evans, and K. R. Tinsley, “Statistical modeling of cochannel interference in a field of Poisson distributed interferers”, in Proc IEEE ICASSP, Mar.2012, pp.3490-3493. [9] S. R. Saunders and A. Argo-Zavala, Antennas
and Propagation for Wireless Communication Systems, 2nd ed. New York: Wiley, 2007. [10] Xiaohu Ge, Kun Huang, Cheng-Xiang Wang,
Xuemin Hong, and Xi Yang, Xiaohu Ge, Kun Huang, Cheng-Xiang Wang, Xuemin Hong, and Xi Yang , “Capacity Analysis of a Multi-Cell Multi-Antenna Cooperative Multi-Cellular Network with Co-Channel Interference”, IEEE TRANSACTIONS ON WIRELESS
COMMUNICATIONS, VOL. 10, NO. 10,
OCTOBER 2011.
[11] Foschini and Gans, Multi antenna systems for MIMO communicationns , A Publication in theMorgan & Claypool Publishers series.pp12-14,2008.
![Assessment of Physiological Health Status in Relations to Different Anthropometric and Cardio respiratory Measures of Head Supported Load Carrying Male Porters of Sikkim, India [Article Retracted]](data:image/gif;base64,R0lGODlhAQABAIAAAP///wAAACH5BAEAAAAALAAAAAABAAEAAAICRAEAOw==)