ISSN: 1992-8645 www.jatit.org E-ISSN: 1817-3195
DC/FAULT ANALYSES IN SMART GRID USING
ARTIFICIAL NEURAL NETWORK
1
LOUGHMANE CHEIKH AHMEDOU, 2M.OULD.AHMEDOU, 3EL ALAMI SEMMA
1,3
IM2I Laboratory, Department of electrical and mechanical engineering,Sciences and Techniques Faculty,
Hassan 1stUniversity, Settat, Morocco.
2
Department of electromechanical engineering, Mine School of Mauritania, Mauritania.
E-mail: [email protected] [email protected]
ABSTRACT
Detection, isolation and fault diagnosis have become necessary steps for improving the reliability of a smart grid (SG) operation. Several methods have been developed based on Kalman filter and other. Those methods allow detecting simultaneous faults, but can’t select exactly the attacked busses. In this paper, we propose an improved method for detection and insulation in real time of multiple simultaneous faults in SG. It is based on an artificial neural network (ANN). For this, a mathematical model of a multi-bus network was used for the learning of the neural network developed. At the output of the neural model, a page-Hinkly test was performed to facilitate the detection steps. This method is able to detect and isolate any simultaneous faults on each bus.
Keywords: Artificial Neural Network (ANN), Bus, Electrical Network, Matlab-Simulink, Page-Hinkly, Smart Grid.
1. INTRODUCTION
Since the appearance of Smart Grid networks, the need for a comprehensive security has increased. Particularly, there are new physical faults or cyber-attacks [1]. Several methods have been developed, using Kalman filters, which are able to ensure the detection, isolation and diagnosis of one or more faults, attacks targeting data [9] [2] [3]. In [2] the type of attack is a fault injection in a DC electrical network.
In scientific research a lot of methods have been proposed to overcome the problems resulting from fault existence. Among these methods, are: Dedicated Observer Scheme (DOS) [15], and Generalized Observer Scheme (GOS) [16], used for faults detection and isolation [9]. Both methods are based on Kalman filter bank [6].
In [6] and [5] a method was developed for the faults detection in a double-feed AC generator. In [9] GOS was used for fault detection in Smart Grid, it is used with a chi-square detector capable of deciding whether or not the fault is present [16].
In [4] and [6], DOS has been proposed while in [6] fault detection in turbine generator has been presented. The latter method is capable to detect simultaneous faults using a technique that separately generates all residues. In [13] an ANN has been presented for a load predict in Smart Grid.
For SG, the proposed methods for detection and diagnosis of faults are developed in [9], [10] and [11]. Iterative Observer Scheme (IOS) has been proposed in [9], based on the Kalman filter and a chi-square detector [16]. GOS is able to detect a single fault or attack at the same time, but IOS is capable of detecting several attacks simultaneously [9]. In [10] a method based on "Computational Data Driven" was proposed and applied to an IEEE-39 bus system. In [11] a "Machine Learning" has been designed to detect false injected data stealth in SG too.
Collecting the various previously mentioned methods, we propose in this paper an artificial neural network to observe and supervise in real-time a Smart Grid system. A test page-Hinkly was suggested after the generation of residues to facilitate the detection step. A DOS property [15] was also used for the generation of residues. This method can detect and isolate faults on each bus of an n-bus network.
The paper is organized as follows, in section II, we will present the model for a DC multi bus system. to facilitate the calculation, we have used a 9-bus network.
ISSN: 1992-8645 www.jatit.org E-ISSN: 1817-3195 results obtained by Matlab. Section V will
conclude this work in.
2. SYSTEM MODEL
For DC power transmission between consumers and producers, lines are used with large impedances [11]. The relation of the power transmitted between two points i and j is given by [9]:
(1)
With : the transmitted active power of i to bus j,
Vi and Vj are the voltage amplitudes, is the
phase angle of bus j, and is the reactance
between bus i and j, in this case Xij is the resistance.
In DC mode, we always assume that the difference between two buses is small, and that the amplitudes of voltages on the bus are close to unity [18], [11]. Then we can get the following equation which linearly links the power and the phase angle. this equation is important to simplify the study:
(2)
Concerning the system state estimation, and with it is necessary to find a
reference bus, for this we need only to estimate n-1
states [9].
By using m measured active power as one can get:
(3)
With : the m active power
measurements transmitted in the lines, the
non-linear relation between the measurements and
the phase angles (state vector).
is the Gaussian noise measurements vector. Using the Jacobean matrix:
We can write equation (3) as follows [9], [11]:
(4)
And we can now write the state equation of the system by:
(5)
With: the state vector in the moment t+1, and
is the noise process.
Therefore, we find a relation in (4) linking the measured power and phase angles.
3. PROPOSED ANALYSIS
3.1. Artificial Neural Network:
From the model developed in (4), we can create a ANN (artificial neural network), able to observe in real time the SG system.
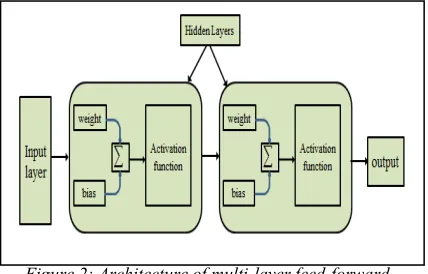
Figure (1) shows a single model of a neuron, with its activation function and its weight. However, figure (2) shows a multilayer neural network. For each layer there are several neurons and their corresponding weight.
We used in our context a multilayer network whose regression and error histogram have been shown in
[image:2.612.312.527.357.449.2]figure.6 and figure.7 respectively.
[image:2.612.314.528.482.619.2]
Figure 1: Neuron model of back propagation algorithm
Figure 2: Architecture of multi-layer feed-forward network
ISSN: 1992-8645 www.jatit.org E-ISSN: 1817-3195
Figure 3. The Structure Of Analysis Proposed For Estimating Our Model
3.2. Page-Hinkly:
The Page-Hinkley Test was chosen with the aim of evaluating the error due to its low computational burden, simplicity, and anti-noise robustness.
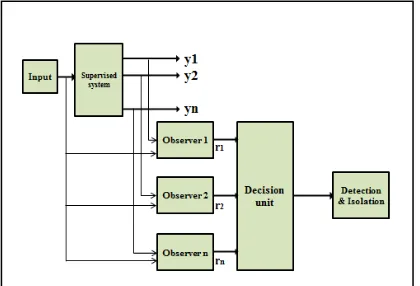
• Residue generation: the residuals are the
difference between the desired output and estimated output.
For this proposition, the ith residue is only sensitive to the i output bus.
If |ri| ≥ so the bus i is failed. with |ri| the
absolute value of residue and the
proposed threshold.
• Faults detection: after the generation of
residues and if there is a fault, the value of
corresponding residue will suddenly
exceed the threshold at that moment and the evaluator based on Page-Hinkly takes the value of the unit, otherwise it remains at zero.
Figure 4: Structure of Dedicated Observer Scheme
4. SIMULATION AND RESULTS
Matlab toolbox was used to create and to make learning ANN. Matpower was used for solving and analyzing an IEEE 9-bus system (Figure 5), and
also generating the matrix H [9], [17], [ 9], in order to simulate and test the reliability of our model. A variable load between value [Min and Max] was generated to create a learning base for the ANN. A Page-Hinkly test model was realized under Matlab- Simulink.
[image:3.612.314.521.473.641.2]After the generation of residues, the page-Hinkly test uses a threshold for testing the faults’ absence or presence. If a residue exceeds the threshold (positive or negative) the detector is set to 1. Otherwise, the detector stays at 0. In figures (8) and (9) below, we will present only the step of the residues’ evaluation.
Figure 5 : System IEEE-9 bus
Figure 6 : The ANN Regression During Learning
[image:3.612.90.300.497.640.2]
ISSN: 1992-8645 www.jatit.org E-ISSN: 1817-3195
[image:4.612.102.277.284.434.2]Figure 7 : Error Histogram
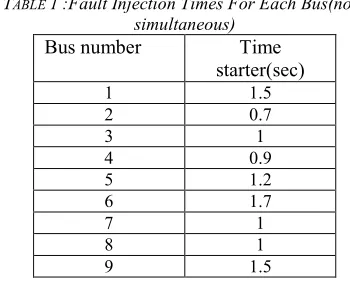
TABLE 1 :Fault Injection Times For Each Bus(non-simultaneous)
Bus number
Time
starter(sec)
1 1.5
2 0.7
3 1
4 0.9
5 1.2
6 1.7
7 1
8 1
9 1.5
4.1. Faults In Different Instants (Non-Simultaneous Faults):
The attacks’ instants are different, using Table1 this time; each bus is attacked in different times Figure (8).
Figure 8: Display faults injected on the bus using the moment shown in Table 1. The detector can detect and isolated each faults. The residues with this bus will change their default values at injection timing, then the decision unit shows and stays 1 at that point.
TABLE 2 : Same Fault Injection Times For Each Bus (Simultaneous Faults)
Bus number
Time starter
(sec)
1 1.5
2 1.5
3 1.5
4 1.5
5 1.5
6 1.5
7 1.5
8 1.5
9 1.5
4.2. Faults At The Same Time (Simultaneous):
This time using the same injection time fault Table2 to test the possibility and the power of this detector if all buses are under simultaneous attack and at the time of injection (Figure 9).
Figure 9: injected fault display on all buses at the same time 1.5 seconds, the detector can detect and isolated each fault, all residues corresponding to these buses will change their values at that moment, so the decision unit shows and stays 1 at that point..
4.3. Comparison:
ISSN: 1992-8645 www.jatit.org E-ISSN: 1817-3195
Figure 10 : Detection Of Faults Injected In Bus 2 And 8, Using IOS In [9].
Figure 11: Detection Of Faults Injected In Bus 2 And 8, Using Our Proposition In This Paper.
We can notice that our proposal can detect and isolate faults injected to each bus, and accurately determine the damaged bus. While in IOS we can say that there is a fault between 1-3 bus and another between 8- 9, but this latter method cannot accurately determine the damaged bus.
5. CONCLUSION
A fault detection system based on ANN and Page-Hinkly was proposed in this paper which is able to detect and isolate faults on each bus in DC power grid. It thus provides an accurate observation in real time on all buses in the Smart Grid.
This method uses intelligence, reliability and efficiency of ANN to supervise in real time an SG with any number of buses.
This method can be used to develop a complete system of faults diagnosis of smart grid.
In the future work, we plan to explore the possibilities of using the developed method to AC power grid.
REFRENCES:
[1]. T. Baumeister. "Literature Review on Smart
Grid Cyber Security," Technical Report,
[2]. Y. Liu, P. Ning, and M. K. Reiter, “False data
injection attacks against state estimation in
electric power grids,” ACM Transactions on
Information and System Security, vol. 14, no.
1, pp. 13:1–13:33, Jun. 2011.
[3]. Y. Mo, E. Garone, A. Casavola, and B.
Sinopoli, “False data injection attacks against state estimation in wireless sensor networks,”
in Proceedings of the 49thIEEE Conference on
Decision and Control (CDC), Dec. 2010, pp.
5967 –5972.
[4]. R. N. Clark, “A simplified instrument failure
detection scheme,” IEEE Transactions on
Aerospace and Electronic Systems, vol.
AES-14, no. 4, pp. 558–563, Jul. 1978.
[5]. B. Boulkroune, M. Galvez-Carrillo, and M.
Kinnaert, “Combined signal and model-based sensor fault diagnosis for a doubly fed
induction generator,” IEEE Transactions on
Control Systems Technology, vol. 21, no. 5, pp.
1771–1783, Sept. 2013.
[6]. D. H. Trinh and H. Chafouk, “Fault detection
and isolation using Kalman filter bank for a
wind turbine generator,” in Proceedings of the
19th Mediterranean Conference on Control
Automation (MED), Jun. 2011, pp. 144–149.
[7]. P. M. Frank, “Fault diagnosis in dynamic
systems using analytical and knowledge-based redundancy: A survey and some new results,”
Automatica, vol. 26, no. 3, pp. 459 – 474, 990.
[8]. K. Manandhar, X. Cao, F. Hu, and Y. Liu,
“Combating false data injection attacks in
smart grid using kalman filter,” in IEEE
International Conference on Computing,
Networking and Communications (ICNC),
Honolulu, USA, Feb. 2014.
[9]. Kebina Manandhar, Xiaojun Cao,
Attacks/Faults Detection and Isolation in the
Smart Grid using Kalman Filter” IEEE 2014
23rd International Conference on Computer
Communication and Networks (ICCCN) –
China, 2014.
[10]. Huaiguang Jiang , Jun J. Zhang, Wenzhong
Gao, and Ziping Wu “Fault Detection, Identification, and Location in Smart Grid
ISSN: 1992-8645 www.jatit.org E-ISSN: 1817-3195
Methods” IEEE TRANSACTIONS ON SMART
GRID, VOL. 5, NO. 6, NOVEMBER 2014.
[11]. M. Esmalifalak, N. Nguyen, R. Zheng, and H.
Z., “Detecting stealthy false data injection
using machine learning in smart grid,” in
Proceedings of IEEE Globecom, Atlanta, GA,
Dec. 2013.
[12]. K. S. Swarup and H. S. Chandrasekharaiah,
“Fault detection and diagnosis of power
systems using artificial neural networks,” in
Proc. First Int. Forum Appl. Neural Netw.
Power Syst., Seattle, WA, USA, 1991, pp.
102–106.
[13]. Hao-Tian Zhang, Fang-Yuan Xu,Long Zhou
”Artitificial Neural Network for load
forecasting in smart grid” IEEE Proceedings of
the Ninth International Conference on Machine
Learning and Cybernetics, Qingdao, 11-14
July 2010.
[14]. R. E. Kalman, “A new approach to linear
filtering and prediction problems,” Journal Of
Basic Engineering, vol. 82, pp. 35–45, 1960.
[15]. Lynn Powell “Power System Load Flow
Analysis” Edition: 1st, November 11, 2004 page 115.
[16]. B. Brumback and M. Srinath, “A chi-square
test for fault-detection in kalman filters,” IEEE
Transactions on Automatic Control, vol. 32,
no. 6, pp. 552 – 554, Jun. 1987.
[17]. R. Zimmerman, C. Murillo-Sanchez, and R.
Thomas, “Matpower: Steady-state operations, planning, and analysis tools for power systems
research and education,” IEEE Transactions on
Power Systems, vol. 26, no. 1, pp. 12 –19, Feb.