ARTIFICIAL COOPERATIVE SEARCH ALGORITHM BASED
LOAD FREQUENCY CONTROL OF DEREGULATED POWER
SYSTEM WITH SMES UNIT
1S.RAMESH KUMAR, 2S.GANAPATHY
1
Assistant Professor, Department of Electrical Engineering, Annamalai University, INDIA
2
Professor, Department of Electrical Engineering, Annamalai University, INDIA E-mail: [email protected], [email protected]
ABSTRACT
In this paper, the optimal gain tuning of an Integral controller for the solution of Load Frequency Control (LFC) problem in a Deregulated power system is proposed using Artificial Cooperative Search algorithm. Fast acting energy storage devices can effectively damp the oscillations due to sudden load changes in the power system. Hence, Superconducting Magnetic Energy Storage (SMES) units are connected in both areas of the thermal power system for optimal transient performance in deregulated environment. The Artificial Cooperative Search algorithm is a new two-population based search optimization algorithm for optimizing numerical optimization problems. The effectiveness of the proposed Artificial cooperative search algorithm is demonstrated on a two area deregulated thermal power system under different contracted scenarios and load changes. The effect of SMES on LFC operation of deregulated system is also analyzed. The results of the proposed algorithm are shown for different contract scenarios and disturbances.
Keywords: Artificial Cooperative Search Algorithm, Deregulated power system, DISCO Participation
Matrix, Load Frequency Control, Superconducting Magnetic Energy Storage
1. INTRODUCTION
Load Frequency Control is the most significant part in electric power system design, operation and control for effective and efficient supply of reliable electric power. The main objectives of LFC for a power system are matching generation to load, regulating system frequency error to zero, distributing generation amongst areas so that inter-area tie line power flows within a prescribed tolerance value and distributing generation within each area such that area operating costs are a minimum [1]. The worldwide trend towards deregulation of the power industry has been done to enhance the effectiveness in the operation of the LFC system by means of deregulation of the power industry. In deregulated environment, Load Frequency Control is an ancillary service which maintains the system reliability.
For many decades, conventional controllers have been widely preferred as the load frequency controller, where the controller parameters are tuned using a trial and error approach. Due to this, the system exhibits poor transient response. To overcome the above mentioned drawback and to provide better transient response, Artificial Intelligent techniques have been preferred [2]. In this paper, a two-population based
global search algorithm, the Artificial Cooperative Search Algorithm (ACS) is used for tuning the integral controller parameter for LFC problem in deregulated environment. However, during small disturbance and with optimal controller values, the frequency and tie-line power deviations exist for a longer time period. During such conditions, the governor might not be able to absorb the frequency deviation due to their slow response. For this purpose, an active power source with quick response, such as Superconducting Magnetic Energy Storage (SMES) is best suited [3]. To damp out the oscillations in a short time period, load frequency control including Superconducting Magnetic Energy Storage (SMES) unit in each area is proposed. The effect of SMES on the dynamic performance under deregulated environment is studied by comparing the responses of the proposed model with and without the presence of SMES unit.
2. MULTIAREA DEREGULATED POWER
SYSTEM MODEL
ISSN: 1992-8645 www.jatit.org E-ISSN: 1817-3195
environment, where the generation, transmission and distribution are owned a single utility. In the deregulated power system structure, vertically integrated utilities do not exist. The generation companies GENCOs, transmission companies TRANSCOs, and distribution companies DISCOs act as different entities. Several GENCOs and DISCOs are present in the deregulated power system structure. A distribution company has the freedom of choice to have a contract with any generation company in the environment for power transaction. A distribution company in one control area can have a contract with any generation company in another control area for transaction of power called “bilateral transactions.” All the bilateral transactions are done under the supervision of an independent system operator (ISO), for which LFC is another ancillary service [4].
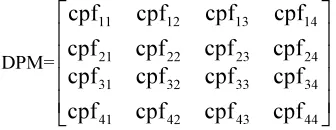
In deregulated environment, the GENCOs and DISCOs can have various combinations of bilateral contracts among them. The bilateral contracts among various GENCOs and DISCOs can be realized effectively by using DISCO Participation Matrix (DPM). The DPM provides the details of the contracts between the GENCO and DISCO. The number or rows in DPM has to be equal to the number of GENCOs and the number of columns in DPM has to be equal to the number of DISCOs in the deregulated environment. Each entry of DPM is a fraction of a total load power contract between a DISCO and GENCO in the system. The total sum of all the entries of DPM column is unity [5].
1
ij=
∑
icpf
(1)The proposed deregulated system is a two-area thermal power system with two GENCOs and two DISCOs in each area. The block diagram of LFC model in deregulated scenario is given in Figure 7. The corresponding DPM matrix is as given below, where cpf represents the contract participation factor.
DPM=
44 43
34 33
42 41
32 31
24 23
14 13
22 21
12 11
cpf
cpf
cpf
cpf
cpf
cpf
cpf
cpf
cpf
cpf
cpf
cpf
cpf
cpf
cpf
cpf
The off diagonal entries in the DPM represent the demand of DISCO in one area with the GENCO in another area. Figure. 1 shows the
two area load frequency control system block diagram in deregulated environment. The optimum values of integral controller gains for the LFC of deregulated power system are calculated using Integral Square Error (ISE) criterion. The cost function J for ISE is taken from [6] as.
J=
∫
(
∆
+
∆
+
∆
tie2)
22 2
1
F
P
F
dt (2)3. SMES SYSTEM
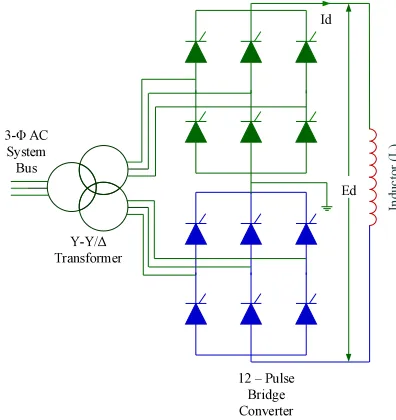
The configuration of thyristor controlled SMES unit is shown in Figure.2. A superconduc-ting inductance coil and a 12 pulse bridge converter connected to a transformer are present in SMES unit. The bridge controller monitors the exchange of energy between the superconducting coil and power system. During normal operating state of the grid, the superconducting coil is charged to a level less than the full capacity of the coil from the grid. The dc magnetic coil and ac grid are connected through a power conversion system which consists of an inverter/rectifier. Once the coil is charged to its set point, the superconducting coil conducts current, which supports an electromagnetic field, with no loss.
The temperature of the coil is maintained below the critical temperature value by immersing in liquid helium. During a sudden load disturbance, increase in the load, the energy stored in the coil is immediately released to the grid as ac line quality. Immediately, the power system control mechanisms start working to set the power system to its new equilibrium condition, the coil charges back to its initial value of current. Similarly during the sudden decrease of loads, the coil gets charged towards its full value, thus absorbing some portion of the excess energy in the system, and as the system returns to its steady state, the excess energy absorbed is released back and the coil current attains its set point [7].
In LFC operation, the sensed area control error (ACE) is used to control the dc voltage Ed
[image:2.595.122.290.636.701.2]The transfer function model used for the SMES unit is shown in Figure 3. SMES unit with suitable control can effectively reduce the frequency and tie-line power oscillations following sudden small load perturbations in power system.
Ed 3-Φ AC
System Bus
Y-Y/Δ Transformer
12 –Pulse Bridge Converter
Id
In
d
u
c
to
r
(L
[image:3.595.90.288.197.407.2])
Figure 2: Schematic diagram of SMES unit
Figure 3: Transfer function model of SMES unit
4. ARTIFICIAL COOPERATIVE SEARCH
ALGORITHM
Artificial Cooperative Search algorithm (ACS) [9] is a swarm intelligence algorithm developed for solving real valued numerical optimization problems. A mutualism based biological interaction exists between different living species in nature. The living species involved in a mutualism based biological interaction try to derive mutual benefits from the mentioned interaction. Cooperation is the interaction of homogenous living species that adopt mutualism. Mutualism and cooperation based biological interaction of two eusocial superorganisms living in the same environment inspired the ACS algorithm. The habitat concept in ACS algorithm matches the
search space concept that belongs to the related problem.
ACS is based on the migration of two artificial super organisms as they biologically interact to achieve the global minimum value to the problem. The quantity of food that can be obtained from a surrounding environment is generally dependent on seasonal climate, a change which varies rapidly. This climatic change has developed seasonal migration behavior for different feeding environments. Prior to migration, majority of the members group together to form a superorganism. The superorganisms that exhibit seasonal migration behavior have the ability to move and find more rich food habitat. Prior to the migration, many superorganisms also organize into subgroups known as sub-superorganisms. During such conditions, the character of a superorganism is determined with the coordination of sub-superorganisms. Explorers are used to search in detail a new place before attempting to migrate to a new area. The explorers then relay the data pertaining to the new migration area to the superorganism. If the superorganism considers the area proposed suitable for migration, then the relevant superorganism moves to this newly discovered area, stops and feeds there for a period, in the meantime, it repeats its behavior to find more fruitful areas and migrates again. In this manner, the living species biologically interact with each other to find their feeding and reproduction needs.
In ACS algorithm, a superorganism consisting of random solutions of the related problem corresponds to an artificial superorganism migrating to more productive feeding areas. ACS algorithm contains two superorganisms; α and β that have artificial sub-superorganisms equal to the dimension of the population (N). The dimension of the problem (D) is equal to the number of individuals within the related sub-superorganisms. In ACS algorithm, α and β superorganisms are used for the detection of artificial Predator and Prey sub-superorganisms. The Predator sub-superorganisms in ACS algorithm can pursue the Prey sub-superorganisms for a period of time while they migrate towards global minimum of the problem. When the iterative calculation process of ACS algorithm that is named as co evolution process is considered, it can be seen that the two superorganisms looking for the global minimum of the related problem, establish cooperation based biological interaction between each other. In ACS algorithm the initial values of the individuals of ith
d
ΔI
) ΔI (Id0+ d d
ΔE
SM
ISSN: 1992-8645 www.jatit.org E-ISSN: 1817-3195
sub-superorganism of α (i.e., α_(i,j)) and β (i.e., β_(i,j)) are defined by using (3) and (4);
j j j 0
g , j ,
i =rand.(up −low )+low
α
= (3)
j j j 0
g , j ,
i =rand.(up −low )+low
β = (4)
where i = 1, 2, 3, ... , N, j = 1, 2, 3, ... , D and g = 0, 1, 2, 3, ... , max cycle. The ‘g’ value here denotes the generation number expressing the co evolution level containing the related superorganisms. The rand shows a random number chosen from the uniform distribution with U∼[0 1]. The upj and lowj are the upper and lower limits of search space for jth dimension of the related problem. The productivity values (i.e., fitness values) obtained by the related sub-superorganisms are computed by using (5) and (6);
( )
i;
i f
y = α
α (5)
( )
i ;i f
y β= β (6)
The biological interaction location, X, between Predator and Prey sub-superorganisms is modeled using the equation (7);
) edator Pr ey (Pr R edator Pr
X= + − (7)
where, R is the Scale factor that controls the speed of biological interaction. The probabilistic nature of ACS algorithm causes the super-organism that is determined as the predator to be changed in each generation. Therefore, ACS algorithm provides a cooperative/coevolution process for both of the superorganisms. The pseudo code of ACS algorithm is provided in [9]. The proposed algorithm can be implemented with convergence, iteration or tolerance as the stopping criteria. In this proposed study, iteration count has been taken as the stopping criteria.
5. OPTIMAL GAIN TUNING
ACS algorithm is applied for optimizing the integral controller gain for a two area interconnected thermal power system in deregulated environment. The swarm intelligence philosophy behind ACS algorithm is based on the migration of two artificial super organisms as they biologically interact to achieve the global minimum value pertaining to the problem.
The objective is to obtain the optimum values of the controller parameters which will minimize the performance index, J [6].
J=
∫
(
∆
+
∆
+
∆
tie2)
22 2
1
F
P
F
dt (8)For LFC in deregulated environment using ACS algorithm, initially the random generated biological interaction location X (integral gain Ki)
is used to calculate fitness value. For each iteration the sub-superorganism (α and β) values are obtained using (3) and (4). The predator and prey sub-superorganisms are determined in each generation by using α and β superorganisms. The biological interaction location, X, between predator and prey is updated using (7). The objective function J is calculated for each set of X using (8). ACS algorithm provides a cooperative / co evolution process for both the superorganisms. The process is repeated until optimum gain, Ki
corresponding to global minimum objective function value is obtained.
6. SIMULATION AND RESULTS
An interconnected two-area system thermal power system having one reheat turbine and one non-reheat turbine with SMES unit in each area in the deregulated environment shown in Figure.1 is used to demonstrate the effectiveness of the proposed artificial cooperative search algorithm. The simulations are performed for different scenarios of the deregulated environment. The data required for the simulation are taken from [4]&[10].
6.1. Simulation of Scenario.1
In this scenario of case study, the participation of all GENCOs is equally distributed in LFC operation. The area participation factors are apf1=apf2=apf3=apf4=0.5. The load changes are
assumed to occur only in area 1, so the load is demanded by DISCO 1 and DISCO 2. The PU load of DISCO 1 and DISCO 2 are assumed as 0.1pu MW. Therefore the entries in DPM becomes as given below
DPM=
0
0
0
0
0
0
0
0
0
0
0
0
5
.
0
5
.
0
5
.
0
5
.
0
The generation of GENCO (∆PMi) is
expressed in terms of contract participation factor (cpf) and load demand of DISCOs (∆PLj) as given
∆PMi =
∑
j ij
cpf
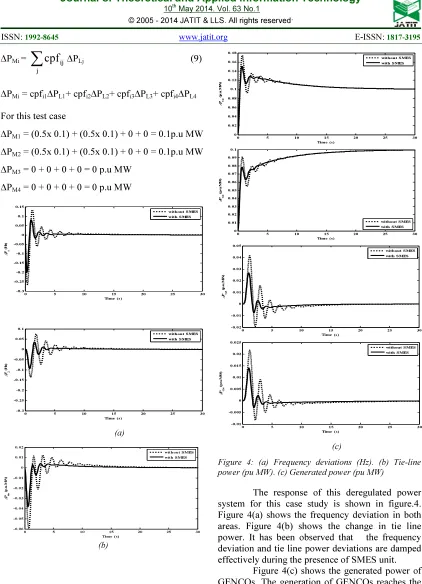
∆PLj (9)∆PMi = cpfi1∆PL1+ cpfi2∆PL2+ cpfi3∆PL3+ cpfi4∆PL4
For this test case
∆PM1 = (0.5x 0.1) + (0.5x 0.1) + 0 + 0 = 0.1p.u MW
∆PM2 = (0.5x 0.1) + (0.5x 0.1) + 0 + 0 = 0.1p.u MW
∆PM3 = 0 + 0 + 0 + 0 = 0 p.u MW
∆PM4 = 0 + 0 + 0 + 0 = 0 p.u MW
0 5 10 15 20 25 30
-0.3 -0.25 -0.2 -0.15 -0.1 -0.05 0 0.05 0.1 0.15
Time (s)
∆
F1
(
H
z)
without SMES
with SMES
0 5 10 15 20 25 30
-0.3 -0.25 -0.2 -0.15 -0.1 -0.05 0 0.05 0.1
Time (s)
∆
F2
(
H
z
)
without SMES with SMES
(a)
0 5 10 15 20 25 30
-0.06 -0.05 -0.04 -0.03 -0.02 -0.01 0 0.01 0.02
Time (s)
∆
Ptie
(
p
.u
.M
W
)
without SMES
with SMES
(b)
0 5 10 15 20 25 30
0 0.02 0.04 0.06 0.08 0.1 0.12 0.14 0.16 0.18
Time (s)
∆
PG1
(
p
.u
.M
W
)
without SMES
with SMES
0 5 10 15 20 25 30
0 0.01 0.02 0.03 0.04 0.05 0.06 0.07 0.08 0.09 0.1
Time (s)
∆
PG2
(
p
.u
.M
W
)
without SMES with SMES
0 5 10 15 20 25 30
-0.02 -0.01 0 0.01 0.02 0.03 0.04 0.05
Time (s)
∆
PG3
(
p
.u
.M
W
)
without SMES
with SMES
0 5 10 15 20 25 30
-0.01 -0.005 0 0.005 0.01 0.015 0.02 0.025
Time (s)
∆
PG4
(
p
.u
.M
W
)
without SMES
with SMES
(c)
Figure 4: (a) Frequency deviations (Hz). (b) Tie-line power (pu MW). (c) Generated power (pu MW)
The response of this deregulated power system for this case study is shown in figure.4. Figure 4(a) shows the frequency deviation in both areas. Figure 4(b) shows the change in tie line power. It has been observed that the frequency deviation and tie line power deviations are damped effectively during the presence of SMES unit.
[image:5.595.87.509.78.662.2]ISSN: 1992-8645 www.jatit.org E-ISSN: 1817-3195
6.2. Simulation of Scenario.2
In this scenario of case study, the DISCOs have a contract with any GENCO in any other area as per the DPM. The area participation factors are apf1 = 0.75, apf2 = 0.25, apf3 = 0.5, apf4 = 0.5. Each
DISCO demands 0.1 p.u MW power from GENCOs. Therefore the entries in DPM becomes as given below
DPM=
0
0
7
.
0
1
25
.
0
3
.
0
25
.
0
0
0
0
3
.
0
0
25
.
0
2
.
0
25
.
0
5
.
0
The scheduled tie line power from area 1 to area 2 is calculated from the off diagonal blocks of the DPM using the following expression,
∆Ptie scheduled = Lj
4
3 i
2
1 j
ij Lj
2
1 i
4
3 j
ij
P
cpf
P
cpf
∆
−
∑∑
∆
∑∑
= =
= =
(10)
= (cpf13+cpf23)∆PL3 + (cpf14+cpf24) ∆PL4
– (cpf31+cpf41) ∆PL1 – (cpf32+cpf42) ∆PL2
= (0+0)0.1+(0.3+0)0.1–(0+0.3)0.1–(0.25+0.25)0.1
= - 0.05 p.u MW
The generation of GENCO (∆PMi) is
calculated using (9) as follows,
For this test case
∆PM1 = (0.5x 0.1)+(0.25x 0.1)+0+(0.3x0.1)
= 0.105 p.u MW
∆PM2 = (0.2x 0.1)+(0.25x 0.1)+0+0
= 0.045 p.u MW
∆PM3 = (0x0.1)+(0.25x0.1)+(1x0.1)+(0.7x0.1)
= 0.195 p.u MW
∆PM4 = (0.3x0.1) + (0.25x0.1) + 0 + 0
= 0.055 p.u MW
The simulation results for this scenario are shown in Figure 5.
0 5 10 15 20 25 30
-0.35 -0.3 -0.25 -0.2 -0.15 -0.1 -0.05 0 0.05 0.1 0.15
Time (s)
∆
F1
(
H
z
)
without SMES with SMES
0 5 10 15 20 25 30
-0.3 -0.25 -0.2 -0.15 -0.1 -0.05 0 0.05 0.1
Time (s)
∆
F2
(
H
z)
without SMES
with SMES
(a)
0 5 10 15 20 25 30
-0.06 -0.05 -0.04 -0.03 -0.02 -0.01 0 0.01
Time (s)
ti
e-li
n
e
p
o
w
er
(
p
.u
.M
W
)
without SMES with SMES
(b)
0 5 10 15 20 25 30
0 0.05 0.1 0.15 0.2 0.25
Time (s)
∆
PG1
(
p
.u
.M
W
)
without SMES with SMES
0 5 10 15 20 25 30
0 0.01 0.02 0.03 0.04 0.05 0.06 0.07 0.08
Time (s)
∆
PG
2
(
p
.u
.M
W
)
0 5 10 15 20 25 30 0
0.05 0.1 0.15 0.2 0.25 0.3 0.35
Time (s)
∆
PG3
(
p
.u
.M
W
)
without SMES
with SMES
0 5 10 15 20 25 30
0 0.01 0.02 0.03 0.04 0.05 0.06 0.07
Time (s)
∆
PG4
(
p
.u
.M
W
)
without SMES with SMES
(c)
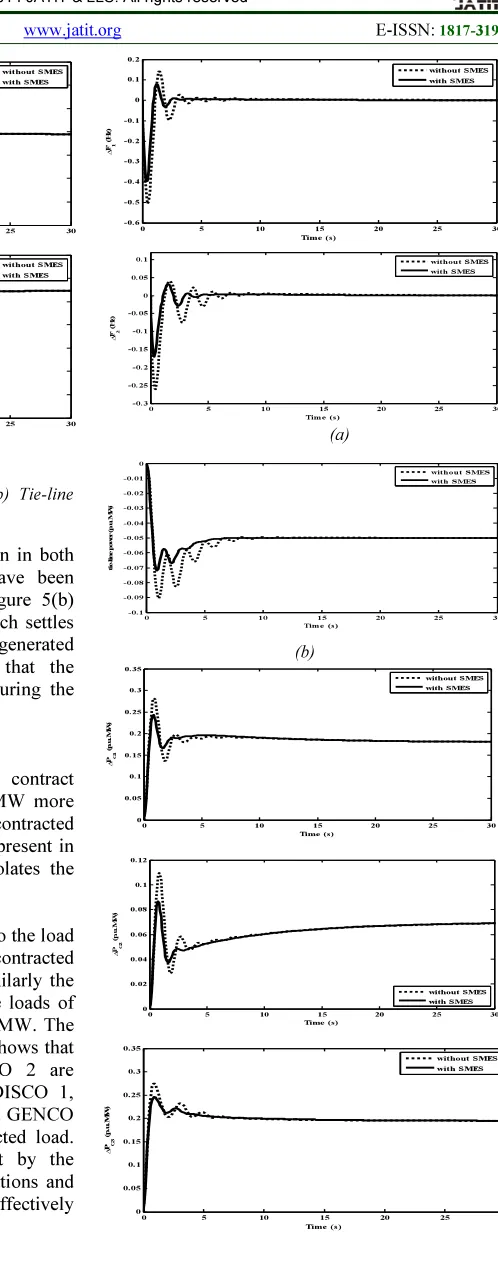
Figure 5: (a) Frequency deviations (Hz). (b) Tie-line power (pu MW). (c) Generated power (pu MW)
Figure 5(a) shows the frequency deviation in both the areas. The frequency deviations have been damped effectively by using SMES. Figure 5(b) shows the actual tie-line power flow which settles at -0.05 pu MW. Figure 5(c) shows the generated powers of GENCOs. It is observed that the generations are at their desired levels during the steady state.
6.3. Simulation of Scenario.3
In this case, the violation of contract happens as DISCO 1 demands 0.1 pu MW more power than its contracted power. The uncontracted power will be supplied by the GENCOs present in the same area of the DISCO which violates the contract.
The total load in area 1 is equal to the load of DISCO 1, load of DISCO 2 and the uncontracted load, which is equal to 0.3 pu MW. Similarly the load in area 2 is equal to the sum of the loads of DISCO 3 and DISCO 4 which is 0.2 pu MW. The DPM is same as in scenario 2. Figure 6 shows that Generation of GENCO 1 and GENCO 2 are affected by the uncontracted load of DISCO 1, where as the generation of GENCO 3 and GENCO 4 remain unaltered due to the uncontracted load. The uncontracted load demand is met by the GENCOs in area 1. The frequency deviations and tie line power deviations are reduced effectively using SMES unit in each area.
0 5 10 15 20 25 30
-0.6 -0.5 -0.4 -0.3 -0.2 -0.1 0 0.1 0.2
Time (s)
∆
F1
(
H
z
)
without SMES with SMES
0 5 10 15 20 25 30
-0.3 -0.25 -0.2 -0.15 -0.1 -0.05 0 0.05 0.1
Time (s)
∆
F2
(
H
z
)
without SMES with SMES
(a)
0 5 10 15 20 25 30
-0.1 -0.09 -0.08 -0.07 -0.06 -0.05 -0.04 -0.03 -0.02 -0.01 0
Time (s)
ti
e
-l
in
e
p
o
w
e
r
(
p
.u
.M
W
)
without SMES with SMES
(b)
0 5 10 15 20 25 30
0 0.05 0.1 0.15 0.2 0.25 0.3 0.35
Time (s)
∆
PG1
(
p
.u
.M
W
)
without SMES with SMES
0 5 10 15 20 25 30
0 0.02 0.04 0.06 0.08 0.1 0.12
Time (s)
∆
PG2
(
p
.u
.M
W
)
without SMES
with SMES
0 5 10 15 20 25 30
0 0.05 0.1 0.15 0.2 0.25 0.3 0.35
Time (s)
∆
PG3
(
p
.u
.M
W
)
without SMES
[image:7.595.254.503.100.739.2] [image:7.595.89.325.106.340.2]ISSN: 1992-8645 www.jatit.org E-ISSN: 1817-3195
0 5 10 15 20 25 30
0 0.01 0.02 0.03 0.04 0.05 0.06 0.07 0.08
Time (s)
∆
PG4
(
p
.u
.M
W
)
without SMES
with SMES
(c)
Figure 6: (a) Frequency deviations (Hz). (b) Tie-line power (pu MW). (c) Generated power (pu MW)
Table 1: Optimal Integral Gain Values
System Discription Integral gain (Ki)
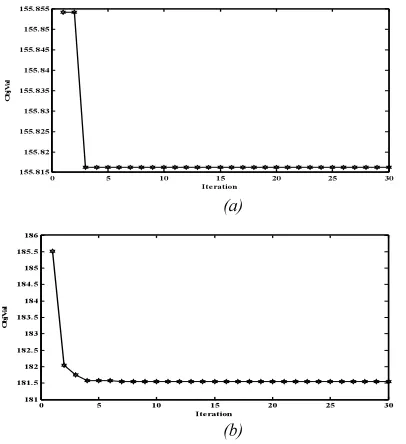
Objective function Without SMES unit 0.5765 391.2692 With SMES unit 1.1449 181.5486
The Table 1 shows the optimal integral gain values and its corresponding cost function, both during the presence and absence of SMES units in the deregulated power system. Figure 7(a) and Figure 7(b) show the convergence characteristics of the objective function with ACS algorithm during the presence and absence of the SMES units respectively. It has been observed that the ACS algorithm converges in a less number of iterations and provides an effective solution for the LFC problem in the deregulated environment.
0 5 10 15 20 25 30
155.815 155.82 155.825 155.83 155.835 155.84 155.845 155.85 155.855
Iteration
O
b
jV
a
l
(a)
0 5 10 15 20 25 30
181 181.5 182 182.5 183 183.5 184 184.5 185 185.5 186
Iteration
O
b
jV
a
l
(b)
Figure 7: (a) Performance Characteristics of ACS algorithm without SMES (b) Performance Characteristics of ACS algorithm with SMES
7. CONCLUSION
In this work, an attempt has been made to show the effectiveness of the artificial cooperative search algorithm in solving LFC problem in the deregulated power environment. The proposed algorithm has been applied to tune a two area deregulated power system has been tested under various operating conditions of load contracts. The analysis of the simulation results reveals that the proposed Artificial Cooperative Search algorithm converges quickly and provides better results. The results also show the effectiveness of the SMES unit in effectively damping out the frequency and tie-line power deviations. The area frequency responses, tie-line power flow response and generation of GENCOs exhibit less overshoot, less undershoot and minimum settling time during the presence of SMES unit.
REFERENCES:
[1] H. G. Kwatny, K. C. Kalnitsky and A. Bhatt, “An Optimal Tracking Approach to Load-Frequency Control”, IEEE Transactions on
Power Apparatus and Systems, Vol. PAS-94,
No.5, September 1975, pp. 1635 – 1643. [2] H.Shayeghi, H.A.Shayanfar and A.Jalili, “Load
frequency control strategies: A state-of-the-art survey for the researcher”, Energy Conservation
and Management, Vol.50, No. 2, February
2009, pp. 344-353.
[3] Y. Tatsuta, S. Koso, H. Abe, M. Urata, H. Ohsaki, A. Ishiyama, S. Taniguchi, S. Nagaya, S. Akita, K. Terazono,N. Hirano, T. Semba, and S. Hanai, “Development of SMES for Power System Control”, IEEE Transactions On
Applied Superconductivity, Vol. 14, No. 2,
JUNE 2004, pp. 693 – 698.
[4] V. Donde, M.A. Pai, and I.A. Hiskens, “Simula-tion and Optimiza“Simula-tion in an AGC System after Deregulation”, IEEE Transactions on Power
Systems, Vol. 16, No.3, August 2001, pp. 481 –
489.
[5] E. Rakshani and J. Sadeh, “Simulation of Two-Area AGC system in a competitive environment using Reduced- Order Observer method”, 5th
International conference on European
Electricity Market, Lisboa, May 2008, pp. 1 - 6.
[image:8.595.88.368.106.237.2] [image:8.595.90.293.492.714.2]machine systems, Vol.2, No.2, 2005, pp.942-947.
[7] S.C. Tripathy, R. Balasubramanian and P.S. Chandramohanan Nair, “Adaptive Automatic Generation Control with Superconducting Magnetic Energy Storage in Power Systems”,
IEEE Transactions on Energy Conversion,
Vol.7, No.3, 1992, pp.434-441.
[8] A. Demiroren and E. Yesil, “Automatic genera-tion control with fuzzy logic controllers in the power system including SMES units”, Electric
Power and Energy Systems, Vol.26, No. 4, May
2004, pp.291-305.
[9] P.Civicioglu, “Artificial cooperative search algorithm for numerical optimization problems”, Information Sciences, Vol. 229, No.20, April 2013, pp 58-76.
[10] S.Ganapathy and S.Velusami, “Decentralized load frequency control of Interconnected power systems with SMES units and Governor Dead Band using Multi-Objective Evolutionary Algorithm ”, Journal of Electrical Engineering
and Technology, Vol.4, No.4, September 2009,
ISSN: 1992-8645 www.jatit.org E-ISSN: 1817-3195
g11 sT 1
1 +
r12 r12 r12 sT 1
T sK 1
+ +
t11 sT 1
1 +
t12 sT 1
1
+ g12
sT 1
1
+
ps1 ps1
sT 1
K + Power system
−
−
Non-Reheat Turbine
Reheat Turbine Governor
Governor
apf 2 apf
1
g21
sT 1
1 +
r22 r22 r22
sT 1
T sK 1
+ +
t21 sT 1
1
+
t22
sT 1
1 + g22 sT 1
1 +
ps2 ps2
sT 1
K + Power system
−
−
Non-Reheat Turbine
Reheat Turbine Governor
Governor
apf 4 apf3
s 2ππ12
Tie-line
a12 PI
controller
PI controller Σ
Σ a
12
Σ B
1
B 2 +
+
+
+
cpf 11
cpf21
cpf 31
cpf 41
cpf 12
cpf 22
cpf32
cpf 42 Σ
Σ
Σ Σ
+ +
+ +
+ +
+ +
cpf13
cpf23
cpf 33
cpf43
cpf 14
cpf 24
cpf34
cpf44
Σ
Σ
Σ Σ
+ +
+ +
+ +
+ +
PU Load of DISCO 2 PU Load of
DISCO 1
PU Load of DISCO 4 PU Load of
DISCO 3
Σ
+
Demand of DISCOs in I to GENCOs in II
Demand of DISCOs in II to
GENCOs in I SMES
SMES ACE
[image:10.595.88.505.132.492.2]ACE