EFFICIENT INTRUSION DETECTION SYSTEM BASED ON
SUPPORT VECTOR MACHINES USING OPTIMIZED
KERNEL FUNCTION
1NOREEN KAUSAR, 2BRAHIM BELHAOUARI SAMIR,
3IFTIKHAR AHMAD, 4MUHAMMAD HUSSAIN
1
Department of Computer and Information Sciences, Universiti Teknologi PETRONAS Bandar Seri Iskandar, 31750 Tronoh, Perak, Malaysia
2 Department of Mathematics and Computer Science, College of Science and General Studies
Alfaisal University, P.O. Box 50927, Riyadh 11533, KSA
3
Department of Software Engineering, College of Computer and Information Sciences King Saud University, P.O. Box 51178, Riyadh 11543, Riyadh, KSA
4 Department of Computer Science, King Saud University, Riyadh, KSA
E-mail: 1 [email protected], 2 [email protected], 3 [email protected], 4 [email protected]
ABSTRACT
An efficient intrusion detection system requires fast processing and optimized performance. Architectural complexity of the classifier increases by the processing of the raw features in the datasets which causes heavy load and needs proper transformation and representation. PCA is a traditional approach for dimension reduction by finding linear combinations of original features into lesser number. Support vector machine performs well with different kernel functions that classifies in higher dimensional at optimized parameters. The performance of these kernels can be examined by using variant feature subsets at respective parametric values. In this paper SVM based intrusion detection is proposed by using PCA transformed features with different kernel functions. This results in optimal kernel of SVM for feature subset with fewer false alarms and increased detection rate.
Keywords: Intrusion Detection System (IDS), Support Vector Machines (SVM), Principal Component
Analysis (PCA), Polynomial Kernel, Sigmoid Kernel
1. INTRODUCTION
Current intrusion detection systems need adaption to the fast growing security threats in the network environment. IDS can be used for misuse or anomaly detection but still there is a need for enhancing efficiency to detect intrusions with minimum false rate [1]. Timely detection is another factor for IDS and depends upon the classifier which can detect in less time but accurately. Classifier can get confuse with the patterns from raw features which can make the architecture more complex. The first step towards solution is the appropriate feature selection and pre-processing so that essential information can be gathered with minimal number of features.
Principal component analysis is a dimension reduction approach considered as a good description for high dimension problems in classification [2]. PCA extracts the optimal feature set from the original dataset. This will speed up the
training and testing process of recognizing attacks types [3]. After features reduction, the training component of the classifier needs rapid learning of the patterns from the dataset and their associated classes. Then the system is cross-validated with another set of patterns to ensure the training abilities because this will help the testing component to test different patterns from same dataset that were not even used in training by recognizing and classifying them as member with the classes already identified in the training phase. Generalization ability of the classifier is also important which helps in classifying unknown patterns on the basis of their similarities with associated class members. Support vector machine has the ability of generalization which helps in classification to predict the patterns and their classes once the system is trained.
not only solve linear problems but also works well for non-linear data with the help of kernel trick. Different kernels can be used for classification after mapping the patterns in higher dimension but the performance rate of IDS varies with each kernel. These kernel functions depend on their parameters for mapping and their values need to be optimized in order to get the best possible results. In this paper, the main focus is on the performance enhancement of SVM by proposing an optimization approach for the kernel parameters to classify at best possible values for different subsets. This can be done by comparing different subsets and kernels so to extract a particular subset that has a maximum detection rate with a kernel which has optimized its values and detect intrusions at fewer false alarms. In this paper, Section 2 and Section 3 gives the overview of Principal Component Analysis (PCA) and Support Vector Machine (SVM) respectively. Section 4 explains the system methodology and Section 5 provides the results and their discussion. Section 6 concludes with the future direction for proposed research.
2. FEATURE EXTRACTION AND
REDUCTION USING PCA
Principal component analysis is a popular technique proposed by Karl Pearson in 1901 [4] for finding patterns in the high dimensional data. It transforms the raw features from input space to feature space using its linear dimensionality reduction algorithm. The reason of using PCA for feature reduction is its ability of mapping the high-dimensional data to low-high-dimensional space with new coordinates having all the characteristics of the original dataset of intrusion detection.
In the new feature space, the main focus is towards the directions in which the variance is maximum. Moreover, the proportion of overall variance for each features is proportional to its eigenvalue [5]. The first few components have greater proportion in the total variance of original dataset [3].
PCA solves the high dimensional problems by constructing the variance-covariance structure with few linear combinations of variables from the original dataset [2]. The covariance matrix is used to determine the principal components which is done with help of eigenvectors and eigenvalues, [6].
These principal components are further evaluated by sorting the eigenvectors in the decreasing order of eigenvalues [7, 8]. After the transformation of the features, the features are
maximum accuracy can be achieved. This decreases the computational cost as well increases the efficiency of the classifier with fewer resources. For this paper we used 38 transformed features and then the minimum feature subset with only 10 features.
3. SUPPORT VECTOR MACHINE
Support vector machine (SVM) is a supervised method introduced by Vapnik in 1995 [9] and is widely used in solving classification problems of network security. Classification is done by the training of classifier with the patterns and their related classes label so that required details can be examined to further classify different patterns from same dataset with better accuracy. SVM works well in identifying different patterns with less prior knowledge available for them to classify and associate with their respective classes [10]. In binary classification there are two classes which are separated depending upon the classifier ability.
SVM is based on structural risk minimization principal which minimizes the local minima and solves classifiers problems like over learning and provides better generalization ability [11, 12]. The classes are linearly classified using hyper plane having a maximum margin from both classes patterns. There will be less chance of misclassification, if there is any error on either side during classification [13, 14]. The data points on the line are known as support vectors [15]. The SVM based classification is shown in Figure 1.
Cl a s s L
abe l -1
Cl a s s L
abe l +1
Figure 1: Linear SVM Classification with hyper plane
used in SVM applications because of its good performance while polynomial kernel has a degree d which affects the kernel performance with its different values. Sigmoid kernel is another commonly used for solving classification problem which is also known as multi layer perception kernel. These kernels have their own parameters which need to be optimized in order to improve the performance rate of the classifier [16]. Usage of these kernels also varies the generalization ability as well the learning ability of the SVM classifier [17-19]. These kernel functions of support vector machine are expressed as below:
Polynomial Kernel:
Radial Basis Function Kernel:
Sigmoid Kernel:
4. METHODOLOGY
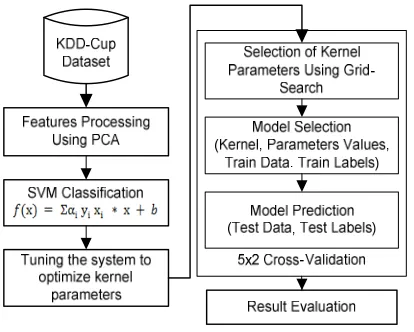
[image:3.612.90.297.378.544.2]The phases for the intrusion classification based on SVM kernel functions are mentioned in Figure 2.
Figure 2. System Methodology
4.1 Selection Of The Dataset
The dataset selected for the experiments is the experiments is the standard KDD-Cup 99 which is considered benchmark for assessing the security systems [1]. KDD-Cup contains a variety of features which are important for training the classifier. KDD-Cup features with their valuable information required by the classifier, gives good results. The other sources for network data have issues like real traffic causes high cost, simulating traffic is a tough job and sanitized is very risky to be used [20].
4.2 Pre-processing Of The Dataset Using PCA
Datasets require proper representation before training so that classifier cannot be confused with the raw features and the overhead in processing large dimension datasets can be reduced. The pre-processing of the dataset is vital because the high dimensional data makes it difficult for the classifier to differentiate it from the noise so its transformation to a feature space with the same attributes and sensitivity can be done using principal component analysis (PCA). PCA perform linear transformation of dataset to feature space and further reduced the dimension by choosing few features with largest proportion in the total variance. After the pre-processing of the features, subsets are selected for training and testing phases of the classification. The optimal case is to have minimum number of features which can give maximum detection rate. The complete set of features transformed from the original features can also be tested to evaluate the performance of the classifier improved in comparison with original features. The first case of the experiment is the set of original 38 features. Second case includes transformed 38 features while the third case takes 10 transformed features as minimum features to testify the classifier. Further different kernels are used with all the selected cases by optimizing their parameters to classify class patterns with better detection rate.
4.3 SVM Classification Using Kernel Functions
4.4 Training and Testing
The approach used for the classification is 5x2 cross validation. Grid search is used for the optimization of SVM parameters including the cost parameter C and gama to have certain value at which the selected subset can perform well. In this approach, there are 5 iterations with 2-fold cross validation [16]. Dataset is randomized before each iteration, then divided into two sets one for training and another for testing. Using 2-fold cross validation, the sets are interchange in every iteration with each other and then again they are trained and tested with different patterns. This helps in achieving better results for random patterns without giving preference to any particular set of patterns for training and tested within the dataset. All the patterns get the probability of being trained and tested without any influence of patterns from majority class. The results of all iterations are examined and mean values for classification measures are calculated at different optimized values of the parameters depending upon the feature subsets and the kernel type used for the classification. The overall system performance is measured on the basis of sensitivity, specificity and accuracy.
4.5 Result Evaluation
Kernel’s effect on the feature subsets can be determined once the results are obtained. All kernels are optimized on different values for their associated parameters but the aim is to find a feature subset and kernel that gives maximum results with fewer false alarms.
5. EXPERIMENTS AND RESULT
DISCUSSION
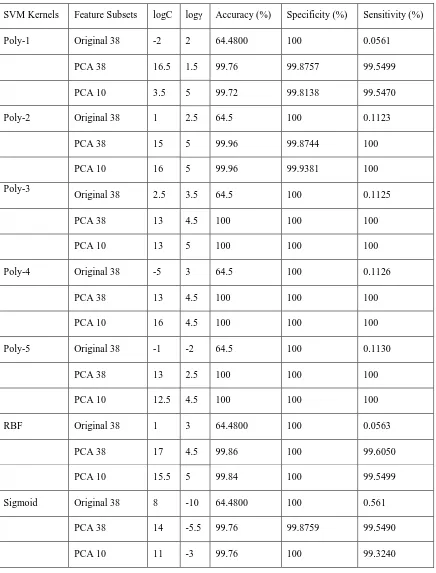
In order to evaluate the performance of the SVM kernels on the standard dataset KDD-Cup [22], different subsets from the dataset are classified by tuning and adjusting the parametric values of applied kernel. This proposed system is based on 5x2 cross validation in which the accuracy of the selected feature subsets is determined by iterations of training and testing phases. Then the mean accuracy is calculated. The system classifies the subsets with different kernels and their parametric values by optimizing them to get maximum performance. The dataset size consists of 5000 connections including both normal and intrusive patterns of 64.46% and 35.54% respectively. The kernels used are radial basis function, sigmoid and polynomial. Polynomial kernel has degree parameter which affects the performance as well other parameters while optimization.
Table 1: Classification Result of SVM Kernel Functions for Original-38, PCA-38 and PCA-10 Features.
SVM Kernels Feature Subsets logC logγ Accuracy (%) Specificity (%) Sensitivity (%)
Poly-1 Original 38 -2 2 64.4800 100 0.0561
PCA 38 16.5 1.5 99.76 99.8757 99.5499
PCA 10 3.5 5 99.72 99.8138 99.5470
Poly-2 Original 38 1 2.5 64.5 100 0.1123
PCA 38 15 5 99.96 99.8744 100
PCA 10 16 5 99.96 99.9381 100
Poly-3
Original 38 2.5 3.5 64.5 100 0.1125
PCA 38 13 4.5 100 100 100
PCA 10 13 5 100 100 100
Poly-4 Original 38 -5 3 64.5 100 0.1126
PCA 38 13 4.5 100 100 100
PCA 10 16 4.5 100 100 100
Poly-5 Original 38 -1 -2 64.5 100 0.1130
PCA 38 13 2.5 100 100 100
PCA 10 12.5 4.5 100 100 100
RBF Original 38 1 3 64.4800 100 0.0563
PCA 38 17 4.5 99.86 100 99.6050
PCA 10 15.5 5 99.84 100 99.5499
Sigmoid Original 38 8 -10 64.4800 100 0.561
PCA 38 14 -5.5 99.76 99.8759 99.5490
The comparison of the cases is based on the performance factors like accuracy, sensitivity and specificity. Accuracy is the measure of detecting normal and intrusive patterns correctly. The equations for calculating accuracy, sensitivity and specificity are as given below [1].
Accuracy = % Sensitivity = % Specificity = % where
True Positive (TP) means an intrusion is detected as an intrusion.
True Negative (TN) means a normal is detected as normal.
False Positive (FP) means an intrusion is detected as normal.
False Negative (FN) means a normal is detected as intrusion.
The results provided in Table 1 shows the performance of different kernel functions on selected feature sets. There are different parametric values and variation in accuracy rate with each kernel and feature set. These optimized values for the C and γ are found after iterations of training and
testing on different patterns from the dataset. Same procedure is done for all kernels. For original 38 features, polynomial kernel has better results from degree 2 to 5 with same accuracy but little change in their optimized parameters. The specificity remains constant for all the cases but sensitivity did not contribute more than 1% for any of the kernel. It means that attacks are not detected by the classifier whereas all normal patterns are detected accurately. As there are raw features used in the experiments so more time was taken along with space complexity by using all 38 features. Although the same number of features is used for transformed 38 feature subset but they are reduced dimensionally which decreases the classifier overhead to process raw features. The kernels are optimized at different values with significant increase in accuracy rate of the classifier. The sensitivity and specificity is above 99% for all the kernels and increased to 100% for the polynomial kernel from degree 3 to 5. Even the parametric values also remain same for degree 3 and 4. The performance for transformed subset containing 10 features also remains 100% with less processing time and better efficiency.
These experiments show that the usage of different kernels of SVM affects the performance through their parameter optimization. Using
[image:6.612.315.521.376.539.2]These cases are further compared using receiver operating characteristic (ROC) curve to observe the results of binary classification by plotting the variations appeared. It is plotted by taking the results of sensitivity or true positive rate and the false negative rate on the x-y scale. The kernel used in roc is polynomial kernel at degree 3 as it gives maximum performance in all the cases. The scale used for roc is [0,1] and the dots indicates the positioning of the case. For optimal case, the dot is to be on the upper left corner showing 100% of sensitivity and 0% false positive rate at coordinate (0,1). In our case of polynomial degree 3, the sensitivity is 0.001125 with zero false positive rate for raw features which overall shows poor results with red dot on lower left corner. The yellow dot on the upper left corner for PCA transformed 38 features and PCA transformed 10 features is showing 100% of sensitivity and 0% false positive rate which indicates optimal performance for the polynomial kernel at degree 3. The comparison between the original 38 features, PCA transformed 38 features and 10 transformed features are shown in Figure 3.
Figure 3: ROC Comparisons for KDD-Cup Original 38 Features, PCA Transformed 38 Features and PCA
Transformed 10 Features
kernel that can work well for the classifier in nonlinear separation. The results for the feature subsets used with each of the kernel vary in performance. It shows that the feature subset have improved performance even after the elimination of irrelevant features. Such optimal combination of kernel with minimum features contributes in intrusion detection for prompt detection of the intrusions in less time instead of taking much time in detecting the same intrusion by using additional features. The parameters are optimized using a grid search to locate those possible values that can increase the success ratio in intrusion detection. The classifier performed well without being biased towards particular features or patterns in training and testing by randomizing the subset each time and perform training and testing with shuffled patterns. This also helps in generalizing the model for SVM classification so that it cannot be confused with any of the pattern provided for testing.
The methodology proposed in this paper is based on the SVM classification by using its different kernel functions with optimized value of associated parameters. The results are further compared with the existing approaches of support vector machines in intrusion detection that have used various dimension reduction techniques.
5.1 Comparison with Other Approaches
Apart from PCA, different other techniques were also used for features selection of KDD-Cup in combination with SVM. The kernel mostly used was radial basis function. In [23], the author performed the comparison between PCA and Genetic Algorithm (GA) for the pre-processing of the features. The purpose of using GA was to found the optimal feature subset selection depending upon the sensitivity of the features. Feature sets GA 10 and GA 12 include 10 and 12 features respectively, while PCA 38 used 38 features and PCA 22 perform classification with 22 features. In [24], the authors used kernel independent component analysis (KCIA) for feature extraction of the raw features and then provided it to the SVM for classification. The KCIA performs well with the SVM and increased the accuracy to 98.9% which was 87.7% when only SVM was used with the raw features. SVM has even detected the attacks in the testing phase that were not used in the training set. Different probabilities of the patterns were used in training and testing set. Rough set theory (RST) was also used with SVM for classification of attacks by reducing the number of features to improve the performance of the classifier [25]. It used 29 features and achieved accuracy of 89.13% which was better in comparison of using all 41
features with 86.79%. It also outperforms the entropy which only detected the patterns at 73.83% accuracy rate when used with SVM.
Another SVM based approach in intrusion detection was done by [26] in which enhanced support vector decision function (ESVDF) was used for feature selection. They used two techniques to select features in which support vector decision function (SVDF) was used by considering feature rank, while forward selection ranking (FSR) and backward elimination ranking (BER) were used for correlation between the features. Different features were selected in each of the case and SVM was applied for classification. The results of these approaches [12] are shown in Table 2.
Table 2: Accuracies of SVM Approaches In Intrusion Detection.
Techniques Accuracy (%) PCA 38 98.95 PCA 22 99.265
GA 12 99.515 GA 10 99.47
KCIA 98.9 ESVDF/FSR 99.46 ESVDF/BER 99.58 FSR 99.43 BER 99.64 Rough Set Theory 89.13
Many other approaches have also been applied for feature selection and reduction to help the SVM classifier in detecting possible attack types. The work proposed in this paper performs well with SVM and also focused on the usage of kernel functions for non-linear separation of patterns in high dimension.
6. CONCLUSION AND FUTURE
DIRECTION
The architectural complexity and feature dimensionality issues can also be resolved by using enhanced dimensional reduction techniques which can overcome computational cost in term of time and resources. Better IDS can solve the security issues of authorized users by providing maximum performance at low false rate.
REFRENCES:
[1] N. Kausar, B. Belhaouari Samir, I. Ahmed, and M. Hussain, "An Approach towards Intrusion Detection Using PCA Feature Subsets and SVM " in International Conference on
Computer & Information Sciences (ICCIS 2012), 2012.
[2] X. Dong-Xue, Y. Shu-Hong, and L. Chun-Gui, "Intrusion Detection System Based on Principal Component Analysis and Grey Neural Networks," in 2010 Second International Conference on Networks Security
Wireless Communications and Trusted
Computing (NSWCTC), 2010, pp. 142-145.
[3] G. Zargar and P. Kabiri, "Selection of Effective Network Parameters in Attacks for Intrusion Detection Advances in Data Mining. Applications and Theoretical Aspects." vol. 6171, P. Perner, Ed., ed: Springer Berlin / Heidelberg, 2010, pp. 643-652.
[4] K. Pearson. (1901) On Lines and Planes of Closest Fit to Systems of Points in Space.
Philosophical Magazine. 559-572.
[5] H. F. Eid, A. Darwish, A. E. Hassanien, and A. Abraham, "Principle components analysis and Support Vector Machine based Intrusion Detection System," in 2010 10th International
Conference on Intelligent Systems Design and Applications (ISDA),, 2010, pp. 363-367.
[6] L. J. Cao, K. S. Chua, W. K. Chong, H. P. Lee, and Q. M. Gu, "A comparison of PCA, KPCA and ICA for dimensionality reduction in support vector machine," Neurocomputing, vol. 55, pp. 321–336, 2003.
[7] B. Chen and W. Ma, "Research of Intrusion Detection Based on Principal Components Analysis," in Second International Conference
on Information and Computing Science ICIC '09, 2009, pp. 116-119.
[8] L. Smith. (2002, A tutorial on Principal Component Analysis.
[9] V. N. Vladimir, The Nature of Statistical
Learning Theory. Berlin Heidelberg New
York: Springer, 1995.
[10] J. Yuan, H. Li, S. Ding, and L. Cao, "Intrusion
Third International Symposium on Intelligent
Information Technology and Security
Informatics, 2010, pp. 465-469.
[11] M. Gao, J. Tian, and M. Xia, "Intrusion Detection Method Based on Classify Support Vector Machine," presented at the Proceedings of the 2009 Second International Conference on Intelligent Computation Technology and Automation - Volume 02, 2009.
[12] N. Kausar, B. Belhaouari Samir, A. Abdullah, I. Ahmad, and M. Hussain, "A Review of Classification Approaches Using Support Vector Machine in Intrusion Detection," in The
International Conference on Informatics
Engineering & Information Science, 2011, pp.
24-34.
[13] I. Ahmad, Feature Subset Selection in
Intrusion Detection: Germany: LAMBERT
Academic Publishing, 2012.
[14] W. Härdle, R. A. Moro, and D. Schäfer, "Rating Companies with Support Vector Machines", DIW BerlinMarch 2004.
[15] S. A. Mulay, P. R. Devale, and G. V. Garje, "Intrusion Detection System Using Support Vector Machine and Decision Tree,"
International Journal of Computer
Applications, vol. 3, pp. 40-43, 2010.
[16] M. Hussain, S. K. Wajid, A. Elzaart, and M. Berbar, "A Comparison of SVM Kernel Functions for Breast Cancer Detection," in
Eighth International Conference on Computer Graphics, Imaging and Visualization (CGIV),
2011, pp. 145-150.
[17] D. S. Broomhead and D. Lowe, "Multivariable Functional Interpolation and Adaptive Networks," Complex Systems, vol. 2, pp. 321-355, 1988.
[18] S. Jiancheng, "Fast tuning of SVM kernel parameter using distance between two classes," in 3rd International Conference on Intelligent
System and Knowledge Engineering (ISKE 2008), 2008, pp. 108-113.
[19] C.-C. Li, A.-l. Guo, and D. Li, "Combined Kernel SVM and Its Application on Network Security Risk Evaluation," in International
Symposium on Intelligent Information
Technology Application Workshops (IITAW '08) 2008, pp. 36-39.
[21] N. Kausar, "On The Provisioning of Extending The Efficiency of Intrusion Detection Through Optimal SVM's Kernel," MS IT, CIS, Universiti Teknologi Petronas, TRONOH, 2013.
[22] (1999, 14 July 2013). KDD Cup Data 1999. Available:
http://kdd.ics.uci.edu/databases/kddcup99/kddc up99.html
[23] I. Ahmad, "Feature Subset Selection in Intrusion Detection Using Soft Computing Techniques," Ph.D. dissertation, CIS, UTP, Tronoh, 2011.
[24] L. Yuancheng, W. Zhongqiang, and M. Yinglong, "An intrusion detection method based on KICA and SVM," in 7th World
Congress on Intelligent Control and
Automation (WCICA 2008), 2008, pp.
2141-2144.
[25] C. Rung-Ching, C. Kai-Fan, C. Ying-Hao, and H. Chia-Fen, "Using Rough Set and Support Vector Machine for Network Intrusion Detection System," in First Asian Conference
on Intelligent Information and Database Systems (ACIIDS 2009) 2009, pp. 465-470.
[26] S. Zaman and F. Karray, "Features Selection for Intrusion Detection Systems Based on Support Vector Machines," in 6th IEEE
Consumer Communications and Networking Conference (CCNC 2009), 2009, pp. 1-8.