209
EFFORT RATE ON USE CASE POINT METHOD FOR
EFFORT ESTIMATION OF WEBSITE DEVELOPMENT
SHOLIQ1), TEGUH SUTANTO 2), ARIFIN PUJI WIDODO3), WAHYU KURNIAWAN4)
1)
Department of Information System, Sepuluh Nopember Institute of Technology (ITS), Indonesia E-mail: [email protected]; [email protected]
2, 3, & 4)
Department of Information System, STMIK STIKOM Surabaya, Indonesia
ABSTRACT
The purpose of this research is to gain Effort Rate (ER) on the Use Case Point method (UCP) for estimating effort of the website development. The Effort estimation is an activity that is carried out to predict how amount of effort required to complete a software development project. Effort estimation is very important be know before the project is executed to determine how resources should be spent to complete the project. In this context, resources include the work hours and expenses. Commonly UCP was one of method used to estimate software development effort.
The studies that have been conducted by several researchers carried out to estimate the regular software development. Until now, it is not found research using UCP to estimate effort for the website development project. The UCP that is used to estimate the effort of website development projects requires different ER from the ER for regular software project. Effort is obtained by multiplying the value of UCP and ER. The ER value proposed by some researchers varies between 18 to 36 staff-hours per UCP, while ER proposed by Karner was 20 staff-hours per UCP.
The final results of this study obtain ER value of 4.41. This value is smaller than the value proposed earlier researchers. Decline of the ER values can decrease value of effort estimation, furthermore decline of value effort estimation will decrease resources that it will be required for software development. This may be due to the website development project which can use Content Management System (CMS) as component or framework that facilitate the development of a website project easier.
Keywords: Effort Rate, Use Case Points, Website Development Effort
1.
INTRODUCTIONPlanning the right resources before executing a software development project is essential. In the United Stated, the failure rate of software development projects in the range of 2002 to 2010 is very high. The Standish Group in the study reported that 31.1% of projects cancelled before completion and 52.7% of projects experiencing over budget up to 189% (Standish, 2011). It requires a proper budget planning. The budget planning can be initiated by effort estimation of software development project.
An effort estimation method that was widely used was the Use Case Point method (UCP). UCP was a method to estimate software development effort based on the number and complexity of use cases (Karner, 1993). The UCP initialized by Gustav Karner in 1993 (Karner, 1993). Several previous studies that have been conducted by several researchers gave the following results: (i) Comparison of UCP with actual effort to have a deviation of 19%, while the estimate of the experts
have a deviation of 20% (Anda, 2002). (ii) In another study, it was reported that UCP has a deviation of 6% (Nageswaran, 2001) and 9% (Carrol, 2005) compared to actual effort. At the above explanation, it can be said that the UCP is a reliable method for estimating the effort.
In the UCP method, the value of effort is usually expressed man-hours/UCP or staff-hours/UCP. The values of UCP is obtained from multiplying UCP and constant that is called ER. The UCP values be obtained from calculations as will be discussed in section 2: literature review. The ER values in several papers known as the Productivity Factor (PF) (Ochodek, Nawrocki, & Kwarciak, 2011), (Yu, Liu, Li, & Ji, 2011). The other paper referred to as Person-Hours (PH) (Yavari, Afsharchi, & Karami, 2011).
210 staff-hours per UCP based on the complexity of the project with reference to the Technical Complexity Factor (Schneider & Winters, 1998). (3) The value of ER ranged from 15 to 30 staff-hours/UCP were based on the quality of team personnel (Clemmons, 2006). (4) ER values be obtained from historical data if available. It used the formula ER=ActualEffort/UCP (Ochodek, Nawrocki, & Kwarciak, 2011).
Some researchers used value of ER by 20 staff-hours per UCP as proposed by Karner (1993), although the basis of Karner’s study was based only on three software development projects. The next ER value corrected to 8.2 staff-hours per UCP (Subriadi, Sholiq, & Ningrum, 2014). Subriadi’s consideration was situation in software development today difference from Karner’s situation in 1993. Situation in this context include technology, tool, person, subject of business, environment, and others.
At above studies, the UCP method was used for business application software development in general. It has no studies focus on software development in particular. In this study, UCP is used exclusively for the development of the website. This research question is how much value of ER for a software development website?
2.
LITERATURE REVIEW2.1. Use Case Point
UCP was first proposed by Gustav Karner in 1993 that developed from Function Point Analysis for object-oriented applications (Karner, 1993), (Ibarra & Vilain, 2010). UCP calculation process requires the use case diagram and use case descriptions. Use case description contains the steps of how a use case is executed. This steps are known as term ‘transaction’ of use case. The UCP calculation has seven steps, they are:
Step 1: Calculating Unadjusted Actor
Weights (UAW). Actors of each use case is categorized into simple, medium, or complex. Each actor is set into the groups with the criteria as presented in Table 1.
Table 1. Classification Of Actor
Actor
Category Description
Actor Weight
Simple
If actor interacts application through Application
Programming Interface (API), as Command Prompt
1
Medium If actor interacts application
through protocol, as TCP/IP 2
Complex
If actor interacts through Graphic User Interface (GUI) or Web Page
3
UAW obtained as the sum of the weights of each actor (formula 1).
UAW ∑ ActorWeight୧
୬
୧ୀଵ (1)
Where,
n = number of actor
ActorWeight = weight of each actor category (see Table 1)
Step 2: Calculating Unadjusted Use Case
Weights (UUCW). The UUCW expressed the use case complexity that is measured by the number of transactions in a use case. Same with the previous, each use case in the system are categorized into simple, medium, or complex as the criteria listed in
Table 2. The UUCW is obtained by sum the weight of each use case using formula 2.
Table 2. Classification Of Use Case
Use case
category Description
Use Case Weight
Simple
A use case has 3 or less transactions including alternative transactions. You should be able to realize a use case by using with less than 5 objects of analysis.
5
Medium
A use case has 3 to 7 transactions including alternative transactions. You should be able to realize a use case by using with less than 5 to 10 objects of analysis.
10
Complex
A use case has more than 7 transactions including alternative transactions. You should to able to realize a use case by using with at least 10 object of analysis.
15
UUCW ∑ UseCaseWeight୧
୬
୧ୀଵ (2)
Where,
n = number of use case
211
Step 3: Calculating Unadjusted Use Case
Points (UUCP). The UUCP is obtained from the sum of the Unadjusted Use Case Weights (UUCW) and Unadjusted Actor Weights (UAW) (formula 3).
UUCP = UUCW + UAW (3)
Step 4: Calculating Technical Complexity
[image:3.595.312.503.181.293.2]Factor (TCF). The TCF is one of factor to estimate the size of software in order to take into count the technical considerations of the system. This is determined by assigning a score between 0 (factor not relevant) to 5 (important factor) for each of the 13 technical factors listed in Table 3.
Table 3. Technical Factor Weight
Ti Technical Factor Weight
T1 Required Distributed Systems 2
T2 Response Time Is Important 1
T3 End User Efficiency 1
T4 Required Complex Internal
Processing 1
T5 Reusable code to Focus 1
T6 Installation Easy 0.5
T7 Usability 0.5
T8 Cross-Platform Support 2
T9 Easy To Change 1
T10 Highly Concurrent 1
T11 Custom Security 1
T12 Dependence On Third-Part Code 1
T13 User Training 1
This score is multiplied by the weighted value assigned to each factor. The TF is obtained from sum of multiplying score and weight as shown in formula 4.
TF ∑ Score୧
ଵଷ
ଵ ∗ Weight୧ (4)
The TF is used to obtain the value of the Technical Complexity Factor (TCF), as in formula 5 follows:
TCF 0.6 0.01 ∗ TF (5)
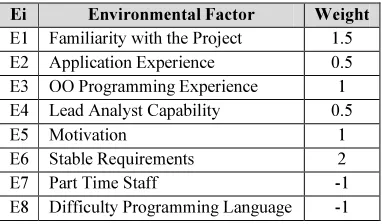
Step 5:Calculating Environmental Complexity
Factor (ECF). The ECF is another factor that applied to estimates software size by count environmental considerations of the system. It is determined by assigning a score between 0 (no
experience) to 5 (expert) for each 8 environmental factors that are listed in the Table 4.
Table 4. Environmental Factor Weight
Ei Environmental Factor Weight
E1 Familiarity with the Project 1.5
E2 Application Experience 0.5
E3 OO Programming Experience 1
E4 Lead Analyst Capability 0.5
E5 Motivation 1
E6 Stable Requirements 2
E7 Part Time Staff -1
E8 Difficulty Programming Language -1
Similar by the calculation of the TCF, this score is multiplied by weighted value of each factor. This score is multiplied by the weighted value assigned to each factor. The EF is obtained from sum of multiplying score and weight as shown in formula 6. Furthermore, the value of EF will be used to obtain Environmental Complexity Factor (ECF). It given the formula for the calculation of the ECF is formula 7.
EF ∑ Score୧
଼
ଵ . Weight୧ (6)
ECF 1.4 0.03 ∗ EF (7)
Step 6:Calculating the Use Case Point (UCP). The
UCP obtained by multiplying unadjusted use cases points and technical complexity factors and the environmental complexity factor (formula 8).
UCP UUCP ∗ TCF ∗ ECF (8)
Step 7: Final step in UCP method is calculating Effort. Effort values obtained by multiplying the value of UCP and constant ER in staff-hours/UCP (formula 9). Researchers typically use a value of ER = 20 staff-hours/UCP as proposed by Karner. Furthermore, in this research will be discussed ER values.
Effort UCP ∗ ER (9)
2.2. Regression and Correlation Analysis
212 variable Y based on the value of the independent variable X. We can get correlation and prediction, if we have two or more variables (Mason & Lind, 1996).
Regression analysis obtained by studying the relationship expressed in mathematical equation that states the functional relationship between the variables. Functional relationship between the predictor variables with the criterion variable is called simple regression analysis (single), while the functional relationship of more than one variable is called multiple regression analysis.
Linear regression equation of Y on X defined in equation 10.
Y a bX (10)
Where,
Y= the dependent variable X = independent variable a= intercept
b = regression coefficient / slop
Whereas the correlation is basically a value indicating the existence of a relationship between two or more variables and the magnitude of the relationship. This means that the correlation does not indicate a causal relationship. When understood as a causal relationship, it's not because it's known as the correlation coefficient referral theory or logic to interpret the results of the calculation. Therefore, correlation analysis that supports the theory of reference require the existence of a causal relationship in the variables analyzed relationship. The correlation coefficient of n data for the two pieces of the variables X and Y can be calculated using the formula developed by Karl Pearson given in equation 11 (Mason & Lind, 1996).
௫௬
∑ୀଵ ∑ୀଵ∑ୀଵ
∑ୀଵଶ ∑ୀଵଶ ∑ୀଵଶ ∑ୀଵଶ
(11)
By using formula 11 to obtain a correlation value, if the correlation value is not equal to 0, then it can be said to occur the correlation between the two variables. Description of the correlation between the two variables are presented in Table 5 (Sarwono, 2009).
Table 5. Description Of The Correlation
Value of relationships Description
0 there is no correlation 0 to 0.25 very weak correlation 0.25 to 0.50 correlation is quite 0.50 to 0.75 strong correlation 0.75 to 0.99 very strong correlation
1 perfect correlation
Before the test correlation, the data must meet a set of assumptions of normality, linearity, ordinal, and homogeneity. Normality means that the distribution of correlated variables must be normally distributed. Linearity means that the relationship between the two variables must be linear. Ordinal variables to be measured by means of at least ordinal scale. Whereas, homogeneity means that the variability of scores in a variable Y should remain constant at all values of variable X.
3.RESEARCHMETHODS
The steps of this research consists of 6 steps, namely:
1. Data collection
2. Calculating actual effort
3. Creating use case document and use case description
4. Calculating UCP 5. Correlation Analysis 6. Determining effort rate
3.1 Data Collection
Data were used in these study include: the characteristics of a website development project, actual effort, and requirements document of website development. Data were collected through three ways, namely: interview, questionnaire, and document review.
Interview conducted for the website development team leader got the project characteristics, the duration of the completion time, and number of personnel involved in the project. While the questionnaire was used to obtain the complexity of the project and the quality of the development team.
213 3.2 Calculating Actual Effort
After the interviews conducted, it can be seen how the number of personnel involved, the respective roles of personnel, and the duration required for each personnel to complete the project. Actual effort for each project was obtained from the multiplication of the number of personnel and time required to complete the project by the respective personnel, as shown in formula 12.
Actual effort ∑ TimeRequired୧
୬
ଵ (12)
n = number of personnel
Time Required= duration of time required of each personnel
3.3 Creating Use Case and Use Case Description All website development project used in these study did not have SRS document, but they have user guide documents. Therefore, in order to get a use case diagram and use case descriptions derived by researchers from the document user guide. The use case diagram and use case description was used to calculate UCP in the next step.
3.4 Calculating UCP
Based on the use case diagram and use case description that has been completed, it can be calculated UCP for each project. The UCP was calculated using the formula 8, but the first UUCP previously calculated using formulas 1-3. The UCP was a multiplication value between UUCP, TCF, and ECF. The UUCP, TCF, and ECF obtained as follows below:
a) Calculating the UUCP
The UUCP was obtained from the formula UUCP = UAW + UUCW. UAW using formula 1 with the categorization of each actor in the use case diagram with parameters as given in Table 1. Likewise UUCW obtained by using the formula 2 with categorization of the number of transactions each use case in the use case description is based on the criteria as given in Table 2.
b) Calculating the TCF and ECF
The TCF was obtained by performing assessments of the thirteen items such technical factors are presented in Table 3. This assessment was based on a questionnaire that was filled by each team leader of a website development project. TF value obtained using formulas 4, then use the formula 5 to get the value of TCF.
Similarly above, to get the ECF conducted assessments of the eight items of environment factors as presented in Table 4. The EF values obtained using the formula 6, then use a formula 7 to get the value of the ECF.
3.5 Correlation Analysis and Regression
After actual effort and UCP obtained, then the next step was the correlation analysis. Correlation is a statistical technique used to examine the relationship between two or more variables. In these study, correlation analysis was conducted to test the relationship between actual effort and UCP. Actual effort as the dependent variable (Y) and UCP as an independent variable (X). While regression was intended to examine the extent to which the effect of independent variables on the dependent variable after the relationship between these variables have been found.
In this study, the correlation and regression analysis used statistical tools for data processing, namely SPSS. Correlation and regression calculations performed to determine whether the results of the calculations are valid. Searching independent variables are correlated with each other to determine the shape of the relationship.
3.6 Determining the Effort Rate
If there correlation between UCP (the independent variable) and Actual effort (the dependent variable), the regression equation can be derived by using SPSS. The ER values can be attributed to the "b" in the linear regression equation in the formula 10.
4. RESULT
4.1 Characteristics of the projects
This study was based on eight government website development project. A brief explanation of the project were presented in Table 7. The project was given ID from A to H. As the project developed by a small team with a number of personnel with 3 to 5 people.
Table 6. List Of Website Development Project As Research Object
No Project
ID Team
Project Name/
Categories Technology
1. A 4 Website of the
District ‘B’
PHP, MySQL,
jQuery, SuperFish,
214
No Project
ID Team
Project Name/
Categories Technology
Intent, Fancybox
2. B 3 Online job fair
website of the Department of Labor of the District ‘S’
PHP, Oracle
3. C 3 Website of
Population and Family planning Agency of the Province ‘Y’
ASP, MySQL
4. D 5 Website of the
District ‘T’
PHP, MySQL
5. E 4 Website of the
Agriculture Department of the Province ‘Y’
PHP, MySQL
6. F 3 Website of the
Industry Department of the Province ‘Y’
PHP, Perl, JQuery
Oracle
7. G 3 Website of the
Integrated Licensing Service of the Investment Coordinating Board of Province ‘Y’
PHP, Oracle
8. H 3 Website of the
Health Department of the District ‘T’
PHP, MySQL
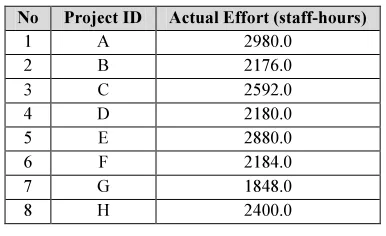
4.2 Actual Effort Values
Actual effort was calculated using data from interviews with the development team leader of the website project include the number of workers involved in the project and the duration of time required of each worker in the project. Actual effort of each project obtained using formula 12.
[image:6.595.93.286.630.748.2]Table 7 shows the actual effort for website project using in this study.
Table 7. Actual Effort Of Each Website Project
No Project ID Actual Effort (staff-hours)
1 A 2980.0
2 B 2176.0
3 C 2592.0
4 D 2180.0
5 E 2880.0
6 F 2184.0
7 G 1848.0
8 H 2400.0
4.3 Use Case Point
As stated in the section of research methods, that to get the UCP must first be found to the UAW, UUCW, UUCP, TCF, and ECF. The above items are presented below:
1) Unadjusted Actor Weight (UAW)
The UAW value is obtained by calculating the sum of the weights degree of complexity of an actor to all actors in the system to be developed. The UAW of all the projects are presented in Table 8.
Table 8. The UAW, UUCW, And UUCP Of All Projects
No Project ID UAW UUCW UUCP
1 A 15 465 480
2 B 12 275 287
3 C 9 270 279
4 D 12 280 292
5 E 12 310 322
6 F 12 295 307
7 G 9 205 214
8 H 12 295 307
2) Unadjusted Use Case Weight (UUCW)
The UUCW value is obtained by calculating the sum of the weights of all the complexity level use case that refers to Table 2. The UUCW of all the projects are also presented in Table 9.
3) Unadjusted Use Case Points (UUCP)
The UUCP was obtained by summing the UAW and UUCW which has been obtained previously. Table 9 displays the UUCP for all website projects.
4) Technical Complexity Factor (TCF)
The TCF is obtained by performing assessments of the thirteen items such technical factors are presented in Table 3. This assessment was based on a questionnaire that was filled by each team leader of a website development project. TF values obtained using formulas 4, and then use the formula 5 to get the value of TCF. The TCF result based on formula 5 was presented in Table 9. 5) Technical Complexity Factor (ECF)
215
Table 9. The UUCP, ECF, ECF, And UCP Of All Projects
No Project
ID UUCP TCF ECF UCP
1 A 480 1.015 0.890 433.6
2 B 287 1.055 0.650 196.8
3 C 279 1.005 0.995 279.0
4 D 292 1.045 0.875 267.0
5 E 322 1.025 1.055 348.2
6 F 307 1.035 0.695 220.8
7 G 214 1.045 0.875 195.7
8 H 307 1.065 0.845 276.3
6) Use Case Point (UCP)
The UCP was obtained by multiplying UUCP and TCF and ECF in accordance with the formula 8. The results of the calculations of UCP was presented in Table 9 (the last column).
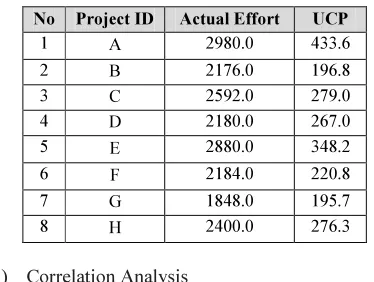
4.4 Effort Rate (ER)
[image:7.595.87.292.123.294.2]To get the ER, prior to correlation and regression analysis. From Table 7 about the actual effort and Table 9 to about UCP, then made Table 10 that contains the actual effort and UCP. Table 10 will be used to perform correlation and regression analysis.
Table 10. Actual Effort And UCP Value
No Project ID Actual Effort UCP
1 A 2980.0 433.6
2 B 2176.0 196.8
3 C 2592.0 279.0
4 D 2180.0 267.0
5 E 2880.0 348.2
6 F 2184.0 220.8
7 G 1848.0 195.7
8 H 2400.0 276.3
1) Correlation Analysis
[image:7.595.311.501.354.443.2]After we know the value of actual effort and UCP, before performing correlation tests, first it must be ensured that the data used are normally distributed. Normality test can be done by using the Kolmogorov-Smirnov test by SPSS tools. Figure 1 shows the test results stating that the data are normally distributed, so correlation test can be done.
Figure 1. Results Of Normality Test
The correlation test between the Actual Effort and UCP to determine the level of their correlation. By using SPPS as a tool, the relation between actual effort and UCP is given in Figure 2. Figure 2 shows that the Pearson correlation coefficient is 0.921, it means that according Table 5, the linear correlation between Actual Effort and UCP including very strong (approaching +1).
Figure 2. Results Of Pearson Correlation Test Between Actual Effort And UCP
Pearson correlation is one measurements used to measure the degree of linear correlation of two variables. Other measurements are significance. Significance can be defined through the sig. line (2-tailed). If the sig (2-tailed) <0.05, then the correlation is considered significant. At Figure 2 can be known that significant level at 0.01 (<0.05), so that data used in this study has a significant correlation.
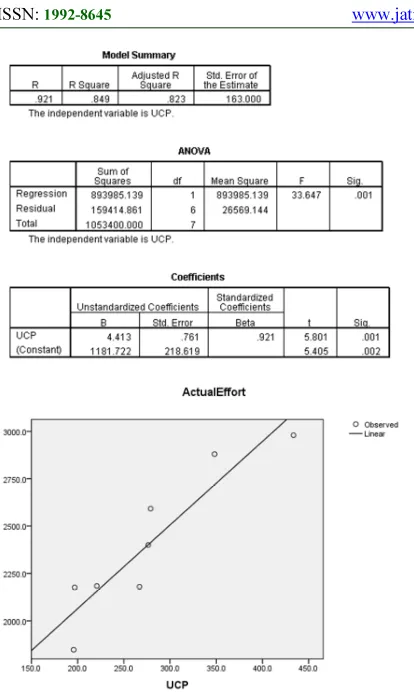
2) Linear Regression Analysis
[image:7.595.92.279.449.590.2]216
Figure 3: Results Of Regression Analysis Between Actual Effort Value And UCP
To determine whether the results of the regression analysis is valid and can be used for prediction, it can be observed from the two tests as follows, namely: (1) Based on the ANOVA, if the value of F> F<table>, then the linier regression
equation is valid and it can be used for prediction . (2) Moreover, it may also by comparing the level of significance, if the Sig. <0.05, the linear regression equation is valid and it can be used for prediction.
Based on Figure 3 that F=33.647 compared value of F<table> = 5.99 (from table ANOVA) with
df1=1 and df2=6, likewise, sig = 0:01 <0:05. With these two parameters, it can be stated that regression equation is valid and can be used to predict.
At Figure 3, it can be obtained regression coefficient b=1181.7 and intercept a=4.41, then the linier regression equation can be defined as follow:
Y = 1181.7 + 4.41 X (13)
Where: Y = Actual Effort, and X = UCP
4.5 Effort Rate Value
After the linear regression equation was found, then it was simple to determine the value of ER. According to section 4.6, the effort rate can be derived from the formula (13) and concluded that the object of this study, the ER was 4:41 staff-hours per UCP for a website development project.
5. DISCUSSION AND CONCLUSION. 5.1 Analysis of the ER
The ER that has been obtained in this study is 4:41 staff-hours per UCP. The ER values smaller than proposed by previous researchers, including the value of ER which was proposed by Karner (1993), which is 20 staff-hours/UCP.
The results of this study support the results of research conducted by Subriadi et.al (2014) who obtain ER value of 8.2 for commonly software development. While the research was done for a particular software development, namely the project website.
Subriadi, et.al (2014) gives fours possibilities about the decline of the value of the ER, namely: (a) The existence of models of software development, such as such as waterfall, prototyping, spiral, agile, and others. (b) The development of software engineering technologies for which there are tools at every stage of software development, such as the phase of requirements analysis, design, coding, testing, or deployment. (c) The presence of components or frameworks for software development. With components or frameworks allow the use or reuse of ready-made components or frameworks, thus the software development becomes easier and faster. (d) As a result of the effects of the internet becomes easier for to search literature, reference, source code, or components on the internet.
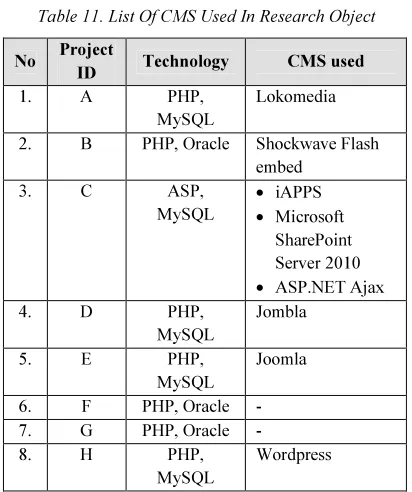
Subriadi, et. al (2014) gives four reasons above about a possible decline in the value of ER. This study supports research that was done Subriadi, et. al (2014), especially the presence of components or frameworks that are already available. For website development, the decline of ER value might be caused by the Content Management System (CMS) as component or framework. In practice, CMS greatly simplify and accelerate the development of the website. In this study, six of the eight objects of research using a CMS for website development, namely: Lokomedia, Shockwave Flash embed,
217
Table 11. List Of CMS Used In Research Object
No Project
ID Technology CMS used
1. A PHP,
MySQL
Lokomedia
2. B PHP, Oracle Shockwave Flash
embed
3. C ASP,
MySQL
• iAPPS
• Microsoft
SharePoint Server 2010
• ASP.NET Ajax
4. D PHP,
MySQL
Jombla
5. E PHP,
MySQL
Joomla
6. F PHP, Oracle -
7. G PHP, Oracle -
8. H PHP,
MySQL
Wordpress
By using a CMS for website development to provide convenience to the users to manage and change the contents of a dynamic website without prior equipped with knowledge about things that are technical. Thus, every person, writer and editor, at any time can use it freely to create, delete or even update the website content.
5.2 Effect of Effort Rate on the Estimated Cost of
the Project
As described above that the ER effect on effort estimation (based on the formula 9), where the value of effort is directly proportional to the ER. The greater the value of the ER, it will increase the value of Effort, as well as the smaller value of the ER, it would also reduce the value of Effort.
The value of the effort generated by the formula 9 is overall effort for software development phase. The next overall effort will be distributed to each step / phase of software development. Overall effort is distributed into three groups of main activities of software development, namely: (1) 37% for activities related to quality assurance, (2) 21% for ongoing activities, such as project management, configuration management, documentation, and support and training. (3) 42% for software development activities, Including requirements, specifications, design, implementation and deployment (Shaleh, 2011).
After we know the effort of each phase of software development, the cost of each phase is calculated by multiplying the effort in each phase
and the cost rate (each phase) per hours. The total cost of software development is obtained by sum the cost of each phase.
Lower ER value will make the effort also lower, eventually the lower the cost required for development. This study gives the results of ER = 4.41 staff-hours/UCP for a website development project. This result was lower with ER = 20 staff-hours/UCP which proposed by Karner (1993). It was also lower compared ER which was proposed by earlier researcher including ER = 8.2 staff-hours/UCP which proposed by Subriadi, et.al (2014). This justifies the development of website requires less effort compared to common software development.
The benefits of this research can be used for project manager of website development to estimate effort. Finally, the results of the effort estimation can be used to estimate costs necessary for the development of the website.
5.3 Conclusion
The results of this study, the ER value for the development of a website by 4:41 staff-hours per UCP. The ER value is lower than the value of ER for regular software development. Lower ER value required lower effort for the development of the website is getting lower as compared to regular software development. This is due to the development of a website might use a Content Management System (CMS) component that can simplify and accelerate the process of website development.
6. LIMITATIONS AND FUTURE RESEARCH However this study has limitations, among others:
1. Object data used in this study were all of the government website development. For the next study needs to be done to re-review using the data objects other website development, among others: the company profit oriented company, non-profit oriented companies, foundations, and others.
218 is being executed as object of research, so that the recording of the time required by each team personnel can be carried out by researchers in order to obtain more accurate actual effort.
7. REFERENCES:
[1] Anda, B. (2002). Comparing effort estimates based on use cases with expert estimates. Empirical Assessment in Software Engineering (EASE), (p. 13). Keele UK. [2] Carrol, E. R. (2005). Estimating Software
Based on Use Case Points. Object Oriented Programming Systems Languages and Applications (OOPSLA) Conference (pp. 257–265). San Diego: ACM.
[3] Clemmons. (2006). Project Estimation with Use Case Points. CrossTalk–The Journal of Defense Software Engineering , 19 (2), 18-22. [4] Ibarra, G. I., & Vilain, P. (2010). Software Estimation Based on Use Case Size. Brazilian Symposium on Software Engineering, (pp. 178-187).
[5] Karner, G. (1993). Resource Estimation for Objectory Projects. Objective Systems SF AB . [6] Mason, R. D., & Lind, D. A. (1996). Teknik Statistika untuk Bisnis dan Ekonomi (Vol. 1). (E. G. Sitompul, U. Wikarya, & A. Hendranata, Trans.) Jakarta: Erlangga. [7] Nageswaran, S. (2001, June). Test Effort
Estimation Using Use Case Points. Retrieved December 2, 2012, from Test_Effort_Estimation.pdf:
www.cognizant.com/cog
community/presentations/Test_Effort_Estimat ion.pdf
[8] Ochodek, M., Nawrocki, J., & Kwarciak, K. (2011). Simplifying effort estimation based on Use Case Points. Information and Software Technology Science Direct , 53 (3), 200-213. [9] Sarwono, J. (2009). Statistik Itu Mudah:
Panduan Lengkap untuk Belajar Komputasi Statistik Menggunakan SPSS 16. Yogyakarta: Universitas Atma Jaya Yogyakarta.
[10] Schneider, G., & Winters, J. (1998). Applying Use Cases – A Practical Guide. Addison-Wesley.
[11] Shaleh, K. (2011). Effort and Cost Allocation in Medium to Large Software Development Project. International Journal of Computer , 5 (1), 74-79.
[12] Standish, G. (2011). Chaos Reports. Retrieved 1 2, 2013, from news: www.standishgroup.com/news
[13] Subriadi, A. P., Sholiq, & Ningrum, P. A. (2014). Critical Review of The Effort Rate Value In Use Case Point Method for Estimating Software Development Effort. Journal of Theoretical and Applied Information Technology , 59 (3), 735-744. [14] Yavari, Y., Afsharchi, M., & Karami, M.
(2011). Software Complexity Level Determination Using Software Effort Estimation Use Case Points Metrics. 2011 5th Malaysian Conference in Software Engineering (pp. 257-262). IEEE.