2017 3rd International Conference on Computer Science and Mechanical Automation (CSMA 2017) ISBN: 978-1-60595-506-3
Effect Analysis of Resampling Techniques on the Performance of
Customer Credit Scoring Models
Jing CHEN
1,a, Ling XIE
2,b, Dun-Hu LIU
3,cand Jin XIAO
4d,*
1,2,4
Business School, Sichuan University, Chengdu 610064, Sichuan Province, China.
3
Management Faculty, Chengdu University of Information Technology, Chengdu 610103, Sichuan Province, China
Email: [email protected], [email protected], [email protected]
Keywords: Customer credit scoring, Class imbalance, Resampling technique, Classification model.
Abstract. In customer credit scoring, the class distributions of credit scoring datasets are usually imbalanced, which severely affects the performance of credit scoring models. To solve the problem, we introduced 4 evaluation criteria, used 9 classification methods, analyzed the performance of 5 commonly used resampling techniques by extensive experiments on 3 real credit scoring datasets, and performed nonparametric tests on the results. We can conclude that: resampling improves the performance of credit scoring, and the degrees of improvement depend on the evaluation criteria selected; generally, SMOTE performs best; the best resampling technique varies with different models and SMOTE works well with most models. Therefore, the application of resampling techniques should be based on evaluation criteria and models selected.
Introduction
With the development of China's economy, credit consumptions have been developing rapidly. Enterprises and banks are facing severe credit risk, and the main reason for bank bankruptcy is credit risk. Therefore, it is important to establish a scientific customer credit scoring model for accurately and effectively predicting customer fraud.
In customer credit scoring, commonly used models include artificial neural network (ANN), naive bayesian (NB), support vector machine (SVM) and so forth. In recent years, scholars have drawn attention to ensemble classification models in credit scoring. Commonly used ensemble models include bagging, AdaBoost, random forest (RF), and random subspace (RSS). However, it is found that the distributions of many customer datasets are uneven, that is, poor credit samples are far more than the good credit samples. In this case, those commonly used models often reach higher misclassification rates when classifying the defaulters, causing greater loss. To solve the problem, resampling is used to balance the distribution of training sets. Commonly-used resampling techniques include random over-sampling (ROS), random under-sampling (RUS), and synthetic minority over-sampling (SMOTE). Crone et al. [1]used RUS to balance the distribution of credit scoring datasets, then trained different classification models. Mahdi et al. [2]trained C4.5 decision tree and introduced evaluation criteria including AUC (area under ROC curve), accuracy, precision. It is shown that ROS can improve the performance for each model.
Experimental Datasets
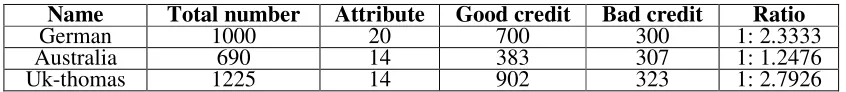
This study was conducted on three credit scoring datasets, as is seen from Table 1.
[image:2.612.95.518.191.237.2]The German dataset comes from UCI [3] international public database and includes 1000 customer samples. Each sample contains 20 attributes. There are 300 good credit samples and 700 poor credit samples. The imbalance ratio is 1: 2.3333. The Australia dataset is also from the UCI[3]and the UK-thomas dataset is a UK credit scoring dataset [4]. We can see the details in Table 1.
Table 1. Empirical datasets.
Name Total number Attribute Good credit Bad credit Ratio
German 1000 20 700 300 1: 2.3333
Australia 690 14 383 307 1: 1.2476
Uk-thomas 1225 14 902 323 1: 2.7926
Resampling Techniques
This study employed 5 resampling techniques, RUS, ROS, SMOTE, OSS and cluster-based oversampling (CBOS).
RUS randomly reduces the majority class samples until the number of the majority class equals to that of the minority class. While ROS randomly expands the minority class with replacement until the number of the majority class equals to that of the minority class.
In 1997, Kubat and Matwin [5] proposed one side selection sampling (OSS). OSS balances the class distribution through intelligently removing the majority class samples considered to be redundant or noisy.
In 2002, Chaw [6] proposed SMOTE resampling technique. In SMOTE, the minority class is oversampled by taking each minority class sample and introducing synthetic examples along the line segments joining any/all of the k minority class nearest neighbors. In the experiment of this paper, k = 3.
In 2004, Jo and Japkowicz [7] proposed cluster-based oversampling (CBOS). There may be subsets of the examples of one class that are isolated in the feature-space from other examples of the same class, which is called small disjunctions. Small disjunctions often cause degraded classifier performance. CBOS aims to eliminate them by performing K-means clustering and random over-sampling.
Classification Methods
This study adopted 9 classification methods, including 5 single models (NB, C4.5 decision tree, ANN, SVM, logistic regression) and 4 ensemble models (Adaboost, Bagging, RSS, RF). We briefly introduce the ensemble models since they are relatively new in credit scoring.
Ensemble learning can improve the learning effect by integrating and training multiple weak classifiers.
In 1995, Freund et al. [8] proposed Adaboost. Through the iterative process, it increases the weights of the misclassified samples and reduces the weights of correctly classified samples to obtain different base classifiers, then integrates the final classifier by weighted voting. In 1996, Breiman [9] proposed Bagging by randomly selecting base classifier training sets from the original training set with replication.
Then Ho et al. [10] proposed RSS. RSS randomly extracts a series of feature subsets from the original feature space, then trains the base classifier based on each feature subset, finally integrates the classification results. In 2001, Breiman [11] proposed RF, which is an integration of unpruned decision trees.
Experimental Design
For each dataset, 10 different runs of five-fold cross validation were executed. The experiment went as follows:
First, 5 resampling techniques were applied to balance the training sets. Then various classification models were trained on the balanced training sets. Here we represent no sampling as "NONE".
Second, we used the models trained in the previous step to classify the samples in the test sets. To evaluate the performance of classification models, we adopted 4 evaluation criteria based on the confusion matrix. In the confusion matrix, TP represents the number of samples that are actually positive and predicted as positive; FN represents the number of samples that are actually positive and predicted as negative; FP and TN can be understood in the same manner.
(1) Area under the ROC curve (AUC). In the ROC curve, the horizontal axis represents the false positive rate= FP / (FP + TN) × 100% and the vertical axis represents the true positive rate = TP/ (TP + FN) × 100%. We often use the area under the ROC curve (AUC) to compare the performance of models.
(2) True positive rate (TPR) =TP/ (TP+FN) × 100%
(3) F measure = 2 × precision × recall / (precision + recall), where precision= TP/ (TP + FP), recall = TP/ (TP + FN)
(4) Geometric mean (G-mean) =ඥTP/(TP+FN)×TN/(TN+FP)
The larger the value of the above four evaluation criteria, the better the performance of the model. All the resampling techniques were implemented by Matlab and the classification models were constructed using WEKA 3.5.8.
Experimental Results and Analysis
In Section 6.1, we made a comparative analysis of the performance of resampling techniques. In Section 6.2, we analyzed the match between resampling techniques and classification models.
The Comparison of Different Resampling Techniques
In Section 6.1.1, we compare the AUC value of the classification models when using 6 sampling strategies. In Section 6.1.2,we compare the TPR, F measure and G-mean of the classification models when using 6 sampling strategies.
The Comparison of AUC
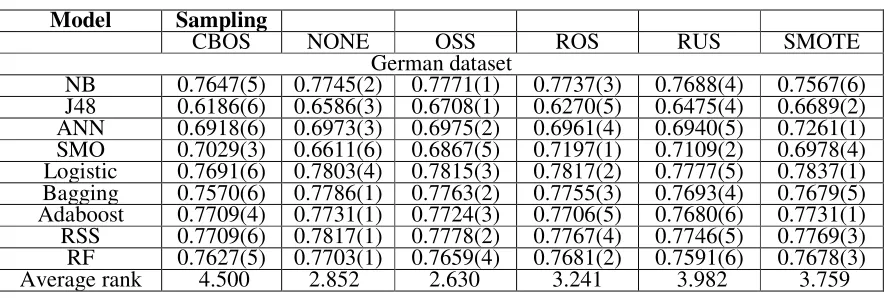
[image:3.612.85.530.574.723.2]Due to space limitation, Table 2 shows the AUC value of the classification models on German dataset using 6 sampling strategies. The last row gives the average rank of the 6 sampling strategies on three datasets. The smaller the rank, the better the performance.
Table 2. The AUC value of sampling strategies and the average ranks.
Model Sampling
CBOS NONE OSS ROS RUS SMOTE
German dataset
NB 0.7647(5) 0.7745(2) 0.7771(1) 0.7737(3) 0.7688(4) 0.7567(6)
J48 0.6186(6) 0.6586(3) 0.6708(1) 0.6270(5) 0.6475(4) 0.6689(2)
ANN 0.6918(6) 0.6973(3) 0.6975(2) 0.6961(4) 0.6940(5) 0.7261(1)
SMO 0.7029(3) 0.6611(6) 0.6867(5) 0.7197(1) 0.7109(2) 0.6978(4)
Logistic 0.7691(6) 0.7803(4) 0.7815(3) 0.7817(2) 0.7777(5) 0.7837(1)
Bagging 0.7570(6) 0.7786(1) 0.7763(2) 0.7755(3) 0.7693(4) 0.7679(5)
Adaboost 0.7709(4) 0.7731(1) 0.7724(3) 0.7706(5) 0.7680(6) 0.7731(1)
RSS 0.7709(6) 0.7817(1) 0.7778(2) 0.7767(4) 0.7746(5) 0.7769(3)
RF 0.7627(5) 0.7703(1) 0.7659(4) 0.7681(2) 0.7591(6) 0.7678(3)
As is seen from the table, OSS has the smallest average rank. Therefore, according to the evaluation criteria AUC, it performs best. Then follows NONE, ROS, SMOTE, RUS and CBOS. It is worth mentioning that NONE (no sampling), comes in second, indicating that resampling cannot effectively improve the AUC of customer credit scoring models.
Furthermore, to compare whether there are statistical significant differences in AUC value of the 6 sampling strategies, we adopted nonparametric test. First, we used the Friedman test. Then we used Iman and Davenport test [12].
If the null- hypotheses of the two statistical tests are rejected, we can proceed with a post-hoc test. The Nemenyi test [13] is used when all strategies are compared to each other. The performance of two classifiers is significantly different if the corresponding average ranks differ by at least the critical difference (CD).
Table 3 shows the results of the Friedman test and Iman-Davenport test for the AUC value of the sampling strategies. According to Table 3, we reject the null hypotheses and believe that there are significant statistical differences in the performance of the 6 sampling strategies at 95% confidence level.
Table 3. Test results for AUC value of sampling strategies.
Test method statistics Critical value
Friedman 17.6757 11.0710 Reject
Iman-Davenport 3.9171 2.2800 Reject
[image:4.612.213.394.419.493.2]Figure 1 shows the results of Nemenyi test. Here we connect the groups of strategies that are not significantly different. When the number of strategies is 6 and the confidence level is 95%, CD is 1.451. According to Figure 1, OSS and NONE performs significantly better than CBOS, while there are no significant statistical differences in the remaining groups.
Figure 1. Test results for AUC value of sampling strategies.
The Comparative Analysis of the Other Three Criteria
Using the same method, we calculated the average ranks of TPR, F measure and G-mean and analyzed them.
Table 4. Average ranks for the other three criteria of the sampling strategies.
Model
Criteria CBOS NONE OSS ROS RUS SMOTE
TPR 4.000 5.704 4.148 3.463 2.611 1.074
F measure 4.000 5.346 3.712 2.889 2.704 2.278
G-mean 3.611 5.019 3.926 2.482 2.333 3.630
ROS, CBOS, SMOTE, OSS and NONE. It is indicated that all the 5 resampling techniques improve the value of TPR, F measure and G-mean.
Then we used Friedman test and Iman-Davenport test to compare the performance of resampling strategies based on 3 evaluation criteria respectively. All the statistics are greater than the critical value, indicating there are significant statistical differences in the 3 evaluation criteria.
Furthermore, we used Nemenyi test to compare TPR, F measure, and G-mean. Due to space limitation, we don’t show the results of Nemenyi test here. On TPR, at 95% confidence level, each sampling method performs significantly better than NONE; SMOTE performs significantly better than other methods; RUS performs significantly better than OSS and NONE; there are no significant differences in the remaining groups. It is indicated resampling effectively improves TPR, and SMOTE performs especially well. On F measure, in addition to CBO, the other sampling methods perform significantly better than NONE, and SMOTE performs significantly better than CBOS. While there are no significant differences in the remaining groups, indicating that resampling effectively improves F value. On G-mean, only RUS and ROS perform significantly better than NONE; RUS performs significantly better than OSS. While there are no significant differences in the remaining groups. It is indicated that resampling effectively improves G-mean.
The Match between Resampling Techniques and Classification Methods
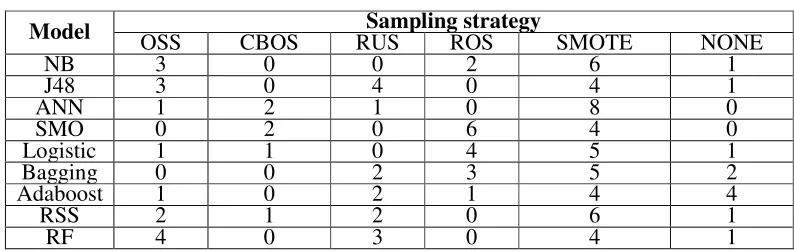
[image:5.612.106.503.362.488.2]To analyze the match between resampling techniques and classification methods, Table 5 shows the numbers of times each sampling strategy performs best on each model. For example, SMOTE performs best 6 times on NB model.
Table 5. The fit between resampling techniques and classification models.
Model Sampling strategy
OSS CBOS RUS ROS SMOTE NONE
NB 3 0 0 2 6 1
J48 3 0 4 0 4 1
ANN 1 2 1 0 8 0
SMO 0 2 0 6 4 0
Logistic 1 1 0 4 5 1
Bagging 0 0 2 3 5 2
Adaboost 1 0 2 1 4 4
RSS 2 1 2 0 6 1
RF 4 0 3 0 4 1
It can be seen that there is a match between resampling techniques and classification methods. For instance, ROS performs well on SMO model (6/12), but performs poorly on ANN model (0/12).
On NB, ANN, Bagging, Adaboost and RSS, SMOTE performs best; on J48 model, ROS and SMOTE are equal in performance; on RF model, OSS and SMOTE are equal in performance; on Logistic model, ROS and SMOTE have similar performance; on SMO model, ROS performs best. Therefore, we can conclude that SMOTE has extensive applicability and works well with most models. It is worth noting that SMOTE is the best-performing sampling method for the 4 ensemble classification models, while the sampling method CBOS gets poor performance on each model.
Results and Discussions
Through the experimental analysis, we can draw the following conclusions
1) Generally, SMOTE performs best, followed by RUS and ROS. Overall, the resampling techniques can improve the classification effect of customer credit scoring datasets.
3) There is a match between resampling techniques and classification methods, that is, the best resampling method varies on different models. SMOTE has the most extensive applicability, while CBOS is in poor performance on each model.
Therefore, the application of resampling should be based on classification models and evaluation criteria.
Conclusions and Further Directions
In this study, we conducted numerous experiments to analyze the impact of resampling on credit scoring models. It is shown that the performance of resampling depends on the evaluation criteria and models selected. SMOTE works well in the experiment.
In future study, we will add more complex customer credit scoring datasets in the experiment and apply more resampling techniques to further explore the impact of resampling techniques on customer credit scoring models.
Acknowledgment
This study is partly supported by the Natural Science Foundation of China under Grant Nos. 71471124, 71273036 and 71673011, Youth Foundation of Sichuan Province under Grant No. 2015RZ0056, Excellent Youth Fund of Sichuan University under Grant Nos. skqx201607, and skzx2016-rcrw14. Jin Xiao is the corresponding author.
References
[1] S. F. Crone and S. Finlay, "Instance sampling in credit scoring: An empirical study of sample size and balancing", International Journal of Forecasting, 28, 1, 224–238, 2012.
[2] S. M. Sadatrasoul, M. R. Gholamian and K. Shahanaghi, "Extracting Rules from Imbalanced Data: The Case of Credit Scoring", Information Systems & Telecommunication, 3, 1, 22–28, 2015.
[3] C. Merz and P. Murphy, "UCI repository of machine learning databases", 1995, http://www.ics.uci.edu/~ mlearn/MLRepository.html.
[4] L. C. Thomas, D. B. Edelman and J. N. Crook, "Credit Scoring and its Applicationss", Society for Industrial and Applied Mathematics, 2002.
[5] M. Kubat and S. Matwin, "Addressing the Curse of Imbalanced Training Sets: One-Sided Selection", International Conference on Machine Learning, pp.181–183, 2000.
[6] N. V. Chawla, K. W. Bowyer, L. O. Hall and W. P. Kegelmeyer, "SMOTE: synthetic minority over-sampling technique", Journal of Artificial Intelligence Research, 16, 1, 321–357, 2011.
[7] T. Jo, "Class imbalances versus small disjuncts", AcmSigkdd Explorations Newsletter, 6, 1, 40– 49, 2004.
[8] Y. Freund and R. E. Schapire, "A Decision-Theoretic Generalization of On-Line Learning and an Application to Boosting", Journal of Computer & System Sciences, 55, 1, 119–139, 1997.
[9] L. Breiman, "Bagging predictors", Machine Learning, 24, 2, 123–140, 1996.
[10] T. K. Ho, "The random subspace method for constructing decision forests", IEEE Transactions on Pattern Analysis & Machine Intelligence, 20, 8, 832-844, 1998.
[11] L. Breiman, "Random Forests", Machine Learning, 45, 1, 5–32, 2001.
[12] R. L. Iman and J. M. Davenport, "Approximations of the critical region of the Friedman statistic", Annual meeting of the American Statistical Association, Washington, DC, USA, 12 Aug 1979, pp.571–595, 1979.