2017 2nd International Conference on Computer Science and Technology (CST 2017) ISBN: 978-1-60595-461-5
An Algorithm of Combining Delaunay TIN Models and Region
Growing for Buildings Extraction
Man-yun HE, Ying-lei CHENG
a,*, Yu-ze NIE
, Zhong-yang ZHAO
and Feng-qin ZHANG
Information and Navigation College, Air Force Engineering University, Xi’an China
*Corresponding author
Keywords: LiDAR, TIN, Region growing, Building point’s extraction
Abstract. LiDAR technology has been widely applied in remote sensing and computer vision. Aiming at drawback of inefficient filtering and then extracting methods, the algorithm of combining Delaunay TIN models and region growing is proposed for more efficient building extraction. At First, Delaunay TIN models were built on raw LiDAR points to get connection of discrete points. Based on the geometry properties of triangles which edge points are located, protrusions edge points were extracted. Then, the extracted edge points were assigned as seed points in region growing. It yielded a point set of protrusion based on triangle network connections. Finally, since the size of non-building points is usually much smaller than the building points and non-building point sets can be deleted by threshold. The algorithm extracted building points without filtering operation, the simulation results indicate that it can improve efficiency in building extraction and guarantee the accuracy in different scenarios.
Introduction
Algorithm Theory
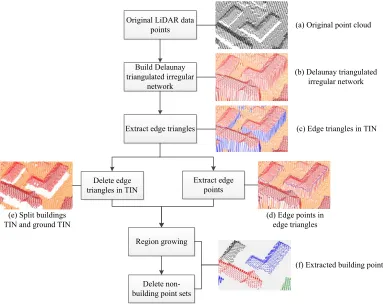
The algorithm proposed in this paper can extract building points from raw LiDAR data without filtering. We build Delaunay Triangulated Irregular Network based on original LiDAR points, as shown in Fig.1 (a) and Fig.1 (b), then extract edge points triangles according to the normal vector of the triangles, length of the sides and elevation, delete the edge triangles in the TIN, as shown in Fig.1 (e), regard the extracted edge points as the seed points and implement region growing to capture points set of different protrusions. Finally, we obtain the point sets of different buildings by deleting the point set whose amount of points is smaller than threshold.
Original LiDAR data points
Build Delaunay triangulated irregular
network
Extract edge points Extract edge triangles
Delete edge triangles in TIN
Region growing
Delete non-building point sets
(a) Original point cloud
(b) Delaunay triangulated irregular network
(c) Edge triangles in TIN
(d) Edge points in edge triangles (e) Split buildings
TIN and ground TIN
[image:2.612.112.495.198.502.2](f) Extracted building points
Figure 1. Flow chart of the algorithm.
Extract Building Edge Points
Extracting building edge points from raw LiDAR points is based on the Delaunay TIN. Generating 3D TIN of discrete points, the first steps is building 2D Delaunay TIN and then add points’ elevation. The points located at edges of protrusions such as buildings and trees have higher elevation than the surrounding ground points. Therefore, the regular triangles in 2D will be deformed in 3D. Meeting the following three conditions are defined as edge upside-down triangles which are shown in Fig.1 (c) and are blue
colored:
1. Angle between normal vector and vertical direction (z axis) is nearly 90 degrees. Set angle thresholdT . Angle between normal vector and vertical direction should bigger than the angle thresholdT; angle thresholdT is normally set to 50 degrees;
2. Set side thresholdB. Two sides in the triangle should be bigger than the side thresholdB; the other side is smaller than the side thresholdB. Two long sides are near
most buildings in urban area are usually higher than 4 meters, we set side thresholdB=4m;
3. In the triangle, two points are higher than the average height of three pointsH,
the other point is lower thanH.
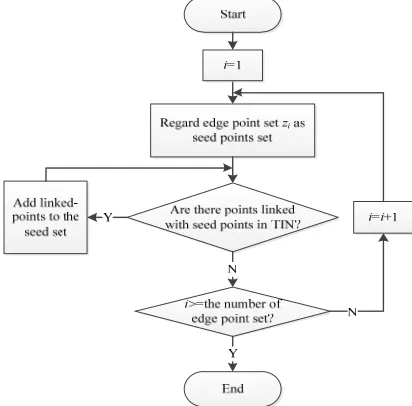
Improved Region Growing Algorithm
Region growing is an image segment method which is usually used in digital image processing [17]. The main idea is selecting seed points and collecting pixels which have similar feature to form a region [18]. In LiDAR data processing, scholar regarded ground points as seed points to classify ground points and other points. But they can’t avoid the influence of noise points in some conditions. And the growing rule that judging the height or angle between other point and seed points, traditional region growing algorithm has high computation complexity.
[image:3.612.208.414.343.546.2]The improved region growing algorithm regards extracted edge points as seed points. Region growing rule is based on the connection relationship between discrete points in TIN. In this way, seed points are more reliable in region growing and we can avoid the influence of noise points which may cause dissatisfied results and guarantee accuracy of building extraction. We can only judge whether the point has connection relationship in TIN with current seed point set, thus computation in the traditional algorithm can be saved. The flow chart of improved region growing is shown in Fig. 2.
Figure 2. Flow chart of improved region growing.
Simulations Results and Analysis
Simulations Environment and Data. All the simulations are based on MATLAB platform, LiDAR data are saved in ASCII file in the form of geodetic coordinates, and each line represents each LiDAR point’s 3D space information(x, y, z). Data sets of three scenarios named Samp12 (containing 52119 data points), Samp42 (containing 42470 data points) and Samp23 (containing 25095 data points) respectively are provided by International Society for Photogrammetry and Remote Sensing (ISPRS).
that the number of LiDAR points isn, number of region isa, the time complexity of
algorithm proposed in the paper is ( 2)
O an . Time complexity of traditional region
growing algorithm based on TIN is ( )3
O n .
Table 1. Running time comparison of algorithms
Running time[s] growing algorithm Traditional region Algorithm in this paper
Samp12 1507.653 129.811
Samp42 1048.736 117.763
Samp23 670.308 69.919
Under the similar building extraction effect, the efficiency of two algorithms were compared in this test. The test compares average 3 times running time of traditional region growing algorithm which based on TIN and algorithm proposed in the paper. Table 1 indicates that algorithm proposed in the paper have shorter running time than traditional region growing algorithms’ which based on TIN from loading data points to obtaining different building data sets. Up to now, the algorithm proposed in the paper has achieved point’s classification in building extraction but traditional region growing algorithm based on TIN has not. We should classify the points in the next step.
(a-1) original TIN of Area1 (b-1) original TIN of Area2 (c-1) original TIN of Area3
(a-2) extracted buildings in Area1 (b-2) extracted buildings in Area2 (c-2) extracted buildings in Area3
(d-1) original TIN of Area4 (e-1) original TIN of Area5 (f-1) original TIN of Area6
[image:4.612.111.518.326.664.2](d-2) extracted buildings in Area4 (e-2) extracted buildings in Area5 (f-2) extracted buildings in Area6
Figure 3. Comparison diagram of different areas LiDAR Delaunay TIN and buildings extracted result.
colored according to the elevation. Six different data sets are used to test whether the algorithm can be applied in different conditions. Area1 has buildings near to each other; Area2 has vegetation next to the buildings; Area3 is flat ground area; Area4 contains low elevation buildings; Area5 contains vegetation region; Area6 is mountainous area with buildings. From the test results, extraction effect is satisfied in most conditions, especially mountainous area and rich vegetation area. But, since the side threshold is 4m, there are some omission extraction buildings such as the lowest building in Area4 original TIN shown in Fig.3 (d-2) cyan colored. Some error extraction occurs in the areas where tree points and building points have similar height and are connected together as shown in Fig.3 (b-2).
80 100
120 140 150
200 250 320 340 360
x[m] y[m]
elev
ati
on[
m
]
Figure 4. The effect of traditional region growing algorithm based on TIN in vegetation region.
Conclusions
The algorithm of combining Delaunay TIN models and region growing for building extraction has following advantages: classifying building points and edge points directly from raw LiDAR points; overcoming the influence from noise and non-building points; simulation results present that the algorithm improved efficiency under the guarantee of accuracy in extraction and can be applied to different scenarios and it provides a solid foundation for building reconstruction. Further research shall be aiming at accuracy improvement of building extraction method and high-accuracy, high-speed building reconstruction.
Acknowledgement
This research was financially supported by the Natural Science Basic Research Plan in Shaanxi Province (No.2015JM6346).
References
[1] J. Jiang, Z. Zhang, and Y. Ming. Filtering of lidar points clouds for complex cityscapes, J. Geomatics and Information Science of Wuhan University. 32 (2007)402–405. In Chinese.
[2] Y. Sun, X. Zhang, and G. Luo. Improved active contour model for building roof boundary extraction from lidar point cloud, J. Acta Geodaetica et Cartographica Sinica. 43(2014):620–625,636.
[4] Q. Zeng, J. Mao, X. Li, and et al. Building reconstruction from airborne lidar points cloud data, J. Geomatics and Information Science of Wuhan University. 36(2011):321–324. In Chinese.
[5] Z. Zhao, Y. Duan, and Y. Zhang. Extracting buildings from and regularizing boundaries in airborne lidar data using connected operators, J. International Journal of Remote Sensing. 37(2016):889–912.
[6] D. Chen, L. Zhang, J. Li, and et al. Integrating morphological grayscale reconstruction and tin models for high quality filtering of airborne lidar points, J. International Journal of Remote Sensing. 33(2012):6497–6515.
[7] N. Polat and M. Uysal. Investigating performance of airborne lidar data filtering algorithms for dtm generation, J. Measurement. 63(2015):61–68.
[8] J. Wu, W. Li, and Z. Peng. Integrating morphological grayscale reconstruction and tin models for high-quality filtering of airborne lidar points, J. Geomatics and Information Science of Wuhan University. 39(2014):1298–1303.
[9] G. Sithole and G. Vosselman. Experimental comparison of filter algorithms for bare-earth extraction from airborne laser scanning point clouds, J. ISPRS Journal of Photogrammetry and Remote Sensing. 59(2004):85–101.
[10] W. Y. Yan, A. Shaker, and N. EI-Ashmawy. Urban land cover classification using airborne lidar data: a review, J. Remote Sensing of Environment. 158(2015):295–310. [11] S. Nicholas and K. Takis. Triangulated, connected sets for building detection from irregularly spaced lidar, C. International Symposium on Communications, Control and Signal Processing. IEEE Xplore, 2008:560-565.
[12] G. Sithole and G. Vosselman. Experimental comparison of filter algorithms for bare-earth extraction from airborne laser scanning point clouds, J. ISPRS Journal of Photogrammetry and Remote Sensing. 59(2004):85–101.
[13] H. Zhao, Y. Cheng, and Y. Qu. A filtering algorithm of airborne lidar points cloud based on least square, J. Science Technology and Engineering. 14(2014):234–239. In Chinese.
[14] W. Su, Z. Sun, D. Zhao, and et al. Hierarchical moving curved fitting filtering method based on lidar data, J. Journal of Remote Sensing. 13(2009):827–832.
[15] S. M. Abdullah, M. Awrangjeb, and G. Lu. Automatic segmentation of lidar point cloud data at different height levels for 3d building extraction, C. IEEE International Conference on Multimedia and Expo Workshops. 2014:1–6.
[16] N. Ekhtari, M. Sahebi, M. Zoej, and A. Mohammadzadeh. Automatic building detection from lidar point cloud data, J. The International Archives of the Photogrammetry, Remote Sensing and Spatial Information Sciences. 37(2008):473–477.
[17] R. C. Gonzalez, R. E. Woods, and S. L. Eddins, Digital image processing using matlab, second ed. Publishing House of Electronics Industry, Beijing, 2014, pp. 231–234. In Chinese.