2017 2nd International Conference on Artificial Intelligence: Techniques and Applications (AITA 2017) ISBN: 978-1-60595-491-2
Surface Defect Detection of Solar Cell
Based on Difference Image Method
Heng-hua CAO
1, Qing-hua SHENG
2,*and Qiang CAI
31,2
School of Electronic Information, Hangzhou Dianzi University, Hangzhou Zhejiang 310018, China 3
Yangtze Delta Region Institute of Tsinghua University Zhejiang, Jiaxing Zhejiang 310027, China
*Corresponding author
Keywords: Surface defect inspection, Solar cells, Differential image method, Recognition.
Abstract. Aiming at the problem of the inefficient and poor anti-interference ability in solar cell detection, a novel detection method based on differential image method is proposed. This method consists of three steps: firstly, we extract the R-channel gray-scale image from the solar cell surface image; then, the gray-scale image is preprocessed and segmented to obtain the defect-free connected region; finally, the defect area is determined by the differential of the gray-scale image. Experimental results show that the proposed method can identify the defect area precisely, and the detection accuracy is greater than 98%. Moreover, the computational burden of the proposed method is very low, it only takes only 10ms to process one image with a heterogeneous multi-core processing Unit. This method can greatly improve the efficiency of solar cell detection.
Introduction
Now as the problem of pollution of the environment and pollution of the environment increasingly prominent, Environmental problems is arousing high attention in industries. So it is the inevitable choice for energy sustainable development in china to develop renewable energy. As one of the important renewable energy resources, the solar cell technology has ushered in rapid development. As technology advanced, all the manufacturers of solar-power cells want to reduce the thickness of solar cell to help lower costs. At present The thickness of the silicon wafer are Hundred microns level, but this will caused problems such as cracks, corner breakage. The qualified rate of product is one of the crucial factors of increasing core competence of the enterprise, so it is important to inspect the defective timely and improve production technology specifically.
Most of the present equipment in the world are eddy current inspection instrument, detectors ultrasonic detectors and so on. But these equipment are usually very expensive. Most manufacturers of solar-power cells in china are small-to-medium businesses, it is hard for this manufacturers to spend a whole lot of money on this. So far, the domestic major ways are manual testing, electroluminescent and so on. Manual testing has strong subjectivity and fatigue workers eyes quickly. So manual testing not only affect the efficiency of factories, but also bring many unreliable factors that directly affect product quality and cost. Electroluminescent need higher environment requirement such as light and temperature.
So in order to adapt to increasingly complex production technique and the growing scale of production. It in need to research a cost-effective approach to detect solar cells. In order to solve this problem, in this paper, a solution which based on machine-vision and worked with heterogeneous multi-core processor was proposed, this solution can enhance the efficiency of Surface Defect Inspection of Solar Cell
Detection Platform
Imaging unit: CCD Industrial Camera, LED light source. The Camera used by this solution is VCXG-53M which derived from Baumer in Germany. This camera using a new progressive scan CMOS image sensor, the power consumption below traditional CCD Industrial Camera and it running faster.
Main control unit: JETSON TX1 module, this module features NVIDIA Maxwell™ architecture, 256 NVIDIA CUDA® cores, 64-bit CPUs, and a power-efficient design.
Man-machine interface: using a mouse and keyboard as input elements, and a monitor as feedback. Can display and make defects of solar cells.
System Structure and Detection Steps
Structural Sketch Map of System
Figure 1. Structural sketch map of defect detection system.
The structural sketch map of defect detection system shown in figure 1. The system has three major components: 1) the imaging unit capture images of solar cell image. 2) the main control unit receives pictures to detect and discern. 3) show the defects on upper computer.
Detection Steps
Figure 2. Flow chart of defect detection.
Step 1: CCD Industrial Camera capture images of solar cell image and transfer images to the main control unit.
Step 2: Main control unit transform the three channel images to three single channel Grayscales (R,G,B).
Step 3: By threshold binarization algorithm, the gray images get linearized, then process grayscale image for the application of mathematical morphology, next eliminate noises by median filtering.
Step 4: the shape of silicon on solar cells are regular, according to this instance segment gray images base on regions. For the defect of broken gate and cracks should remove connected regions of margins, but for the defect of corner breakage should keep connected regions of margins. Because of the areas of connected regions of defects have changed, the differences between the before processed connected regions and after processed connected regions can be get through Difference Image Method,
Step 5: Treat with the gray images processed by step4 using methods of erosion and expansion, then extract features using 8-connected sign [4]. Then send the result to the upper computer to display.
Image Preprocessing
Image Preprocessing
image always content more characteristics to identify defects. The surface of solar cells consist mainly of silver-white grating line and blue silicon wafers.
[image:4.612.101.509.101.217.2](a)Three-channel image (b)R-channel (c)G-channel (d)B-channel Figure 3. Image of each channel after processing.
See figure 3, to differentiate grating line and silicon wafers, R-channel Grayscale image is best choice. So choice R Grayscale image for detecting.
Image Segmentation. This paper contain threshold segmentation and segmentation of region. Images processed by threshold segmentation and median filter firstly to filter out image noise, then segmentation of region for defect detection.
Threshold segmentation [5]: To strengthen image so that differentiates grating line and silicon wafers clearly in accordance gray value. Formula of threshold segmentation:
1, ( , )
g( , )
0, ( , )
f x y T
x y
f x y T
≥
=
<
(1)
[image:4.612.150.462.416.492.2]Selection of threshold is the crux of Threshold segmentation. The difference of solar cell’s grey value is clearly, so the crux in this paper is relatively easy to select. The experimental results show that T values 150~160 is best. Such as figure 4, region of silicon wafer can identified effectively.
Figure 4. Effect of Threshold segmentation.
Segmentation of region[1]: Its purposes is distinguish all defect-free single-connected region. Because of shape and area of solar cells are regularly, so segment the connected regions taking the value of areas as index. If the solar cell have defects of broken gate and corner breakage. In this trial, the areas of silicon wafers have two size: 3500~5000 pixels and 8500~10000 pixels. As figure5, silicon wafers without defect were extracted.
Figure 5. Effect of Region segmentation.
Difference Image for Defect Detection
[image:4.612.169.444.585.672.2]( , ) A( , ) B( , )
C x y = x y − x y (2)
A(x,y) is original gray picture, B(x,y) is defect-free connected region, C(x,y) is defective regions. As figure 6(a), a 3x3 matrix, assumes 6(b), 6(c) correspond to A(x,y), B(x,y) respectively, and the difference coefficient δ=2, | |
b c
X X
∆ = − . If ∆ <δ, the grey value is 0, else is 255. Figure 6(d) is the
[image:5.612.132.482.307.408.2]matrix after difference image.
Figure 6. Principle of Difference Image.
The method in this paper using difference image. The differences of defect-free connected region and original Grayscale image just are defected regions. The two image used by difference image method roots in one Grayscale image so there is no need to processing of Registration.
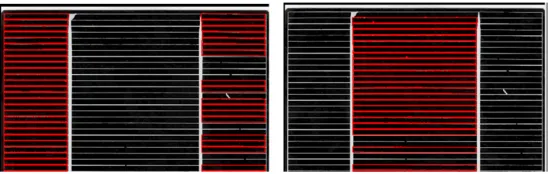
Figure 7(a) is R-channel Grayscale image. Figure 7(b) and figure 7(c), in the red box is defect-free connected region. So 7(a) Subtract 7(b) and 7(c) is defect region
Figure 7. Example of Difference Image.
Experiment Results and Analyses
Experiment Result Analysis
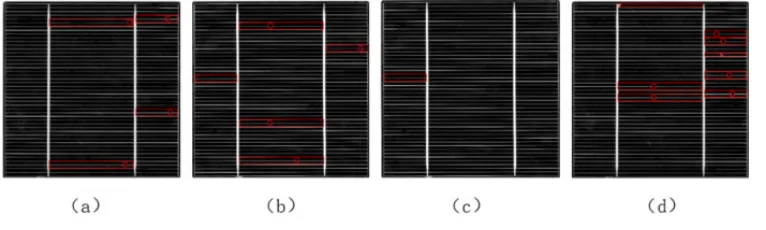
This experiment tested 500 solar cells with the size of 125mm×125mm. Some results as figure 8, all
the defect such as cracks, broken gate and corner breakage can effectively detected. Such as 8(d): 1 corner breakage, 1 crack and 6 broken gates has been detected.
Figure 8. Some results of defects detection.
For the defects of crack and corner breakage can effectively detected, after Detection and Statistical analysis, get table 1:
Table1. Accuracy of Detection.
Detect type broken gate cracks corner breakage
Actual number 672 357 264
Detect number 660 349 260
[image:5.612.118.501.526.641.2] [image:5.612.173.439.698.750.2]See table 1, accuracy of the three detects more than 97 percent, so the algorithm have the higher recognition rate and stronger robustness. There is no difference in different light intensities and difference temperatures. So the system have strong anti-interference ability.
The main control unit of detection system based on heterogeneous multi-core architecture, it assembles 256 core GPU and 64 bit CPU, has extremely capacity to handle data. In tests the time of processing each image is about 45~50ms, however the camera collect an image need 47ms, so the system has fully achieved the real-time requirement.
Experiment Results Compare
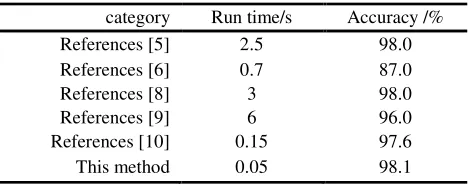
[image:6.612.189.423.261.353.2]For now the method in business are not many, the method in this paper will be compared with some main methods. References [5] based on projection difference, references [6] based on Tensor Voting, references [8] based on infrared imagery, references [9] based on electroluminescence, references [10] based on deep learning.
Table 2. Compare of each major method.
category Run time/s Accuracy /%
References [5] 2.5 98.0
References [6] 0.7 87.0
References [8] 3 98.0
References [9] 6 96.0
References [10] 0.15 97.6
This method 0.05 98.1
See table 2, Difference image method is better than others. Difference image algorithm compare with the heterogeneous multi-core architecture can run very fast.
Conclusion
The method presented in this paper based on difference image algorithm, effectively resolves the problems of low efficiency and low ability of anti-jamming. The method using simple algorithm and has strong robustness. From the experimental results, this method in this paper achieves quite high detection accuracy and high speed. For small-to-medium businesses it’s achievable to get high detection accuracy with low cost. However, this method affected by the angle of camera, when photograph images the camera should perpendicular to solar cells.
Acknowledgement
This research was financially supported by the National Key Scientific Instrument and Equipment Development Project (2012YQ15008705); the National Natural Science Fund (21627812); ZheJiang college students' science and technology innovation project (Xinmiao Talents Plan) (2016R407064).
References
[1] Rafael. C. Gonzalez, Richard. E. Woods. 2003. Digital Image Processing (2nd Edition). Beijing: Publishing House of Electronics Industry. 2011. (482-500).
[2] Jing Guo. Machine Vision and Applications[J]. Electronic Science and Technology. 2014, (07):185-188.
[3] Tao Kang. the research and design of detection system based on the image processing[D]. Xi`an University of Science and Technology. 2005.
[5] Huiyang Zhao. Research on surface defect inspection of solar cell based on machine vision [D]. Yanshan University. 2011.
[6] Bo Feng. Research and implementation of crack detection algorithm on the surface of solar cell[D]. Jilin University. 2014.
[7] Yubao Li. Research of surface defects detection algorithm based on machine vision [D]. Central South University. 2013.
[8] Yali Wang. Research and method of defect detection of solar panels based on infrared imaging [D]. China JiLiang University. 2015.
[9] Wenzhi Chen Defect detection of solar cells based on electroluminescence imaging. [J]. Chinese Journal of Luminescence. 2013, (08):1028-1034.
[10] Baoxian Wang. Solar cells surface defects detection based on deep learning [J]. Pattern Recognition and Artificial Intelligence. 2014, (06):517-523.