University of Huddersfield Repository
Wright, Daniel
Introduction of a Semi Automatic Quality Control Process into an SME Original Citation
Wright, Daniel (2011) Introduction of a Semi Automatic Quality Control Process into an SME. Masters thesis, University of Huddersfield.
This version is available at http://eprints.hud.ac.uk/id/eprint/17554/
The University Repository is a digital collection of the research output of the University, available on Open Access. Copyright and Moral Rights for the items on this site are retained by the individual author and/or other copyright owners. Users may access full items free of charge; copies of full text items generally can be reproduced, displayed or performed and given to third parties in any format or medium for personal research or study, educational or notforprofit purposes without prior permission or charge, provided:
• The authors, title and full bibliographic details is credited in any copy; • A hyperlink and/or URL is included for the original metadata page; and
• The content is not changed in any way.
For more information, including our policy and submission procedure, please contact the Repository Team at: [email protected].
INTRODUCTION OF A SEMI AUTOMATIC QUALITY
CONTROL PROCESS INTO AN SME
DANIEL WRIGHT
A Thesis submitted to the University of Huddersfield in partial
fulfillment of the requirements for the degree of Master of
Research
Knowledge Transfer Partnership between the University of
Huddersfield and Craftsman Tool Ltd.
I Abstract
The purpose of this thesis is to show considerations made when designing and
implementing a semi automatic quality control process into an SME; Craftsman Tools
Ltd. Small batches are produced at any one time, usually of quantities of around 5 to
10 parts. The drive for change arises because the tolerances required becoming ever
tighter.
Investigation has been made in to other systems and processes in operation for
comparisons. Most systems, however, are aimed at large batch, mass manufacture,
and not at an SME producing small quantities, which this research will address.
Machine Analysis has been conducted to evaluate and monitor the condition of the
machine during the project and beyond. This information will be used to create a
solid benchmark for machine performance.
A system was selected, implemented and tested on the machine tool for automating
part manufacture and inspection providing closed loop feedback information for
“right first time” part manufacture.
Results are discussed and conclusions made for the feasibility of the systems and the
II Acknowledgements
I would like to thank all those involved throughout the project and for their belief and
support for making the project possible.
The academic team for their contribution and support, Professor Alan Myers, Dr
Andrew Longstaff and Dr Simon Fletcher.
The company, Craftsman Tools, for the investment made in the project, Mr. Robert
Johnson – Managing Director, Mr. Stephen Murgatroyd – Company Supervisor and
Wilfred Morrow – Staff Technician.
I would also like to thank my family for their support during the project period.
This Partnership received financial support from the Knowledge Transfer Partnerships
programme (KTP). KTP aims to help businesses to improve their competitiveness
and productivity through the better use of knowledge, technology and skills that
reside within the UK knowledge base. KTP is funded by the Technology Strategy
III Contents
I Abstract ... 2
III Contents ... 4
IV Table of Figures ... 7
V Table of tables ... 8
Chapter 1 – Introduction ... 9
1.1 Aims ... 10
1.2 Objectives ... 11
1.3 Chapter Outline ... 11
1.4 Summary ... 12
Chapter 2 – Literature Review ... 13
2.1 Introduction ... 13
2.2 Machine Tool Errors ... 13
2.3 Machine Tool Maintenance ... 16
2.4 SPC and Quality Control ... 17
2.5 Probing Systems... 18
2.6 Systems in use ... 20
2.7 Software Systems ... 21
2.8 BallBar ... 22
2.9 Summary ... 23
Chapter 3 – Initial Processes and Systems ... 24
3.1 Introduction ... 24
3.2 Initial Processes and Systems ... 24
3.3 Summary ... 33
Chapter 4 – Proposed Processes and Systems ... 34
4.1 Introduction ... 34
4.2 Description of Processes and Systems ... 34
4.3 System Time Comparison ... 39
4.4 Machine Analysis and condition ... 41
4.5 Summary ... 43
Chapter 5 – System Selection ... 44
5.1 Introduction ... 44
5.2 System Selection ... 44
5.2.1 Justification for Purchase ... 44
5.2.2 Selection of Equipment ... 46
5.2.3 Purchase of Equipment ... 48
5.3 Companies Investigated for Probes and software ... 48
5.3.1 Probes ... 48
5.3.2 Software ... 49
5.3.3 System Selection Scoring Matrix... 51
5.4 Costing Analysis ... 52
5.4.1 System Costs ... 53
5.5 Hardware and Software Selection ... 56
5.6 Hardware and Software Functionality ... 57
5.7 Machine Maintenance ... 57
5.7.1 Benefits ... 58
5.7.3 Costs ... 60
5.7.4 Training ... 61
5.8 Summary ... 61
Chapter 6 – Implementation... 63
6.1 Introduction ... 63
6.2 Implementation ... 63
Identification of Key Processes ... 63
6.2.1 Priority Cell ... 63
6.2.2 Priority Machine ... 63
6.2.3 Probe ... 64
6.2.4 Software ... 64
6.3 Processes ... 70
6.3.1 Processes for Implementation ... 70
6.3.2 Testing... 70
6.3.3 Investment Requirements... 71
6.3.4 Implementation Plan ... 72
6.3.5 Process Pyramid Stages ... 78
6.3.5.1 Preventative... 78
6.3.5.2 Design for manufacture ... 78
6.3.5.3 Feed rates and spindle speeds ... 78
6.3.5.4 Machine capability ... 79
6.3.5.5 Probe qualification ... 79
6.3.5.6 Predictive ... 80
6.3.5.7 Machine check ... 80
6.3.5.8 Tooling suite check ... 80
6.3.5.9 Component in fixture check ... 80
6.3.5.10 Correct part check ... 80
6.3.5.11 WPC set ... 81
6.3.5.12 Tool set... 81
6.3.5.13 Active ... 82
6.3.5.14 Thermal track ... 82
6.3.5.15 Tool offsets ... 82
6.3.5.16 Broken tool check ... 82
6.3.5.17 Informative ... 83
6.3.5.18 Updates ... 83
6.3.5.19 Finished and roughing sizes ... 83
6.4 BallBar ... 85
6.4.1 Hardware ... 85
6.4.2 Software ... 85
6.4.3 Process – Test Method ... 85
6.5 Summary ... 92
Chapter 7 – Testing and Results ... 93
7.1 Introduction ... 93
7.2 Testing and Results ... 93
7.2.1 Development of Systems – M&H Systems ... 93
7.2.2 Development of Systems – Renishaw... 114
7.2.3 Gauge R&R Data ... 115
7.3 Probing of the Part – Test Results... 118
7.6 Production Data ... 126
7.7 BallBar testing and results ... 128
7.8 Summary ... 133
Chapter 8 – Conclusions and Further Work ... 134
8.1 Introduction ... 134
8.2 Conclusions ... 134
8.3 Cost savings brought about from the system ... 136
8.3.1 Direct Savings ... 136
8.3.2 Indirect savings ... 136
8.3.3 Maintenance costs ... 137
8.4 Further Work ... 137
Chapter 9 – References ... 138
Chapter 10 – Appendices ... 141
10.1 ISO Programs ... 141
10.2 BS EN ISO Standards ... 150
10.3 BallBar Method ... 152
10.4 BallBar Test Part Programs ... 154
IV Table of Figures
Figure 1: Process flow from customer input through to shipment of part to customer25
Figure 2: Current processes for manufacture on the factory shop floor ... 29
Figure 3: Benchmark flow chart ... 38
Figure 4: Parts made comparison ... 40
Figure 5: Example BallBar trend graph ... 43
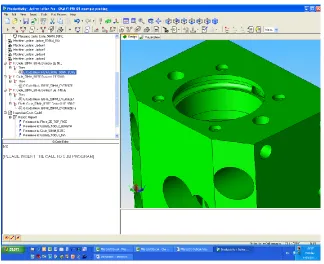
Figure 6: Test part model in the Renishaw AE PRO Software... 66
Figure 7: A feature being created on the model for inspection. ... 66
Figure 8: The tool, which will be updated from the feature. ... 67
Figure 9: Logic statement being built within the software to control a specific update. ... 67
Figure 10: Customised error messages can be displayed for the operator ... 68
Figure 11: Another feature measurement being created. ... 68
Figure 12: Writing the measured value in to a variable number on the machine tool controller. ... 69
Figure 13: Manual G-code inserted ... 69
Figure 14: General implementation flow chart ... 72
Figure 15: Calibration procedures ... 73
Figure 16: Process flow chart ... 76
Figure 17: Process Pyramid ... 77
Figure 18: Tooling file ... 84
Figure 19: Renishaw BallBar 20 software Advanced mode home screen ... 86
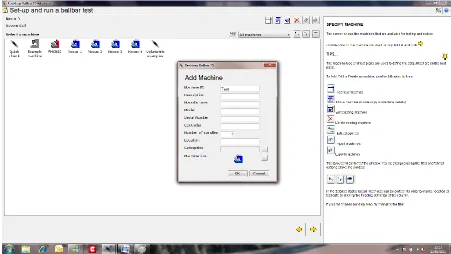
Figure 20: BallBar test setup screen - machine creation or selection ... 86
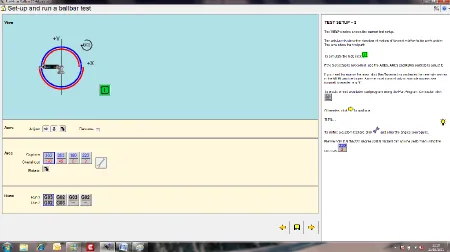
Figure 21: BallBar test setup screen - plane selection ... 87
Figure 22: BallBar test results selection screen ... 87
Figure 23: BallBar test setup - machine addition screen ... 88
Figure 24: BallBar test setup - parameter screen ... 88
Figure 25: BallBar test setup - direction and limits screen ... 89
Figure 26: BallBar test setup - part program creation ... 89
Figure 27: BallBar test running on probing implementation machine ... 91
Figure 28: BallBar test running on probing implementation machine ... 91
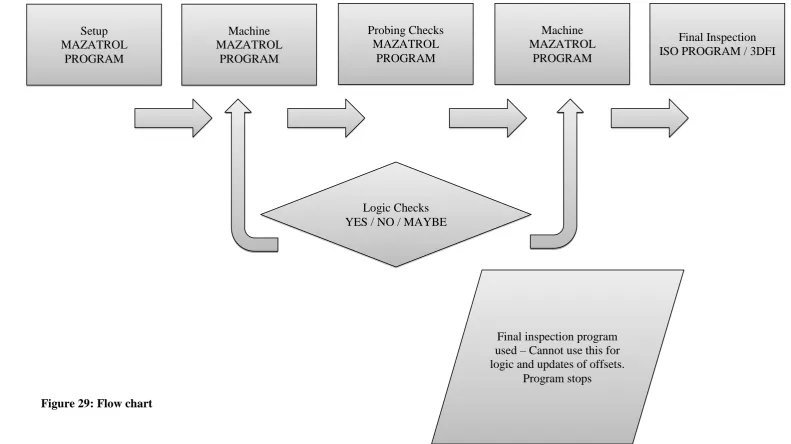
Figure 29: Flow chart ... 96
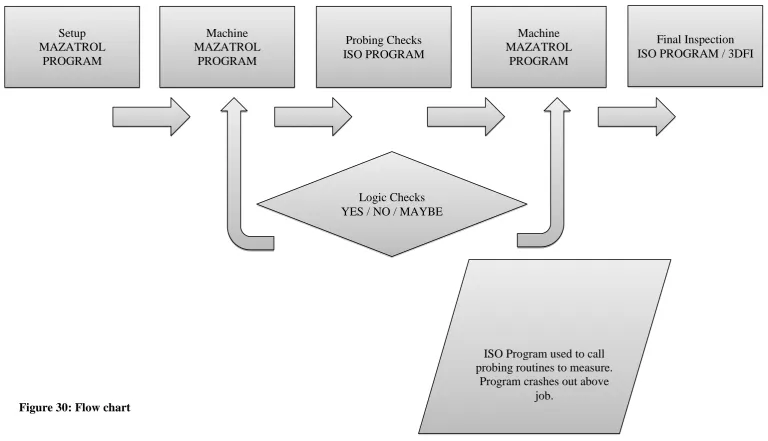
Figure 30: Flow chart ... 99
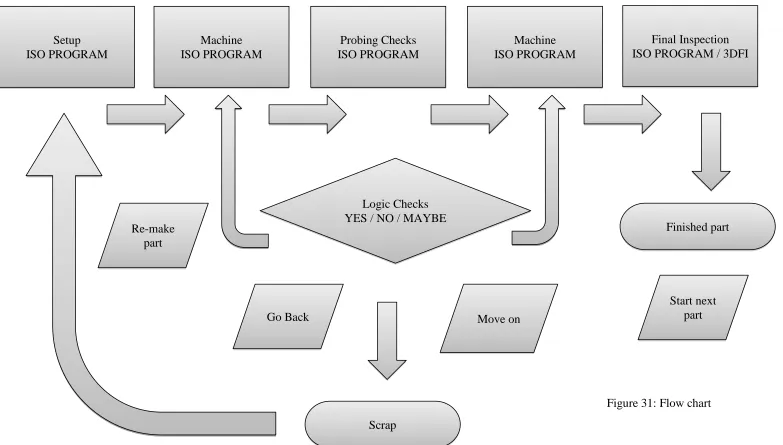
Figure 31: Flow chart ... 102
Figure 32: Flow chart ... 106
Figure 33: Flow chart ... 109
Figure 34: Mazatrol program screen capture ... 113
Figure 35: Measurement comparisons graph ... 119
Figure 36: CMM Report ... 120
Figure 37: CMM Report ... 121
Figure 38: CMM Report ... 122
Figure 39: Component inspection report ... 123
Figure 40: Component inspection report ... 123
Figure 41: Component inspection report ... 124
Figure 42: Component inspection report ... 124
Figure 43: SPC Graph ... 125
Figure 46: Smashed Probe following an accident on machine ... 129
Figure 47: Ballbar test results ... 130
Figure 48: Ballbar test results ... 130
Figure 49: Ballbar test results ... 131
Figure 50: Ballbar test results ... 131
Figure 51: Ballbar test results ... 132
Figure 52: Ballbar test results ... 132
V Table of tables
Table 1: Probing hardware scoring matrix ... 51Table 2: Probing software scoring matrix ... 52
Table 3: 2009 Cash flow ... 54
Table 4: 2008 Cash flow ... 55
Table 5: Process responsibilities ... 75
Table 6: Initial Mazatrol trials ... 95
Table 7: Revised Maztrol trial ... 98
Table 8: ISO only programming ... 101
Table 9: Mazatrol - ISO - Mazatrol ... 105
Table 10: ISO - Mazatrol - ISO ... 108
Table 11 - Gauge R&R test results ... 116
Table 12: 63.5mm bore comparison ... 118
Table 13: 63.75mm bore comparisons ... 118
Table 14: 63.75mm bore comparisons ... 118
Table 15: 63.75mm bore comparisons ... 118
Chapter 1 – Introduction
Quality control is an area of engineering that is becoming ever more critical.
Demands on suppliers are stretching the capacity of companies and are requiring
more stringent testing of every part produced. The traceability of each part has
become a given rather than an ideal and creates more paperwork for each part.
The extra work created, however, must not impact upon the production lead times and
therefore systems and processes must meet these capabilities, whilst trying to reduce
costs and improve overall quality.
Craftsman Tools Ltd is a family owned SME based in Otley, Leeds employing around
55 people and has been operating for almost 60 years. The company operates in a
worldwide market with the specialist products being in-house designed work holding
equipment and tool holders for most major machine tool builders worldwide. The
company also produces parts for many large companies in the oil and gas industry as
sub-contractors where the global market is highly competitive for both cost and
quality of the finished parts in a time conscious manner. Most items produced are
"one offs" or small batches.
The content of the following thesis is the result of research and work undertaken as a
Knowledge Transfer Partnership (KTP) programme 007057 between Craftsman Tools
Ltd and the University of Huddersfield. The project provided a significant strategic
impact for the company, helping to provide reductions in manufacturing costs and
improved quality, which greatly enhance the company‟s reputation for high quality,
precision manufactured parts.
The aim of the collaborative program was to address specific issues around process
quality, such as machining accuracy, whilst also aiming to reduce significant
manufacturing costs through automation of product testing, validation and
certification. The lack of confidence within the company for the processes accuracy
and reliability forced the undertaking of manual inspection, measurement and testing
of components, which has major implications for cost of quality and overall
manufacturing costs.
The company has previously attempted to automate the machining and validation of
parts on a number of occasions, which all proved troublesome and ineffective, and
requiring good change management as well as providing a technologically suitable
solution.
The manufacture of the parts is currently a complex process involving many people
and pieces of machinery and equipment. Simplifying the processes and amount of
equipment required will help to reduce the amount of human intervention for
manufacture of parts and also for dimensional measurement.
The current manufacture of a designed part has the following procedures:
Block of material placed in vice
Program written in Mazatrol according to drawing sizes
Work Piece Co-ordinate (WPC) set
Program run to rough first off
Part removed from machine and taken to manual inspection
Work co-ordinates manually updated to suit
Part re-machined to finish size
Final manual inspection to check against tolerance and dimensioning
Next parts run on full cycle if inspection passed
Base is now completed
Part moved to indexer for Capto bore cycle
Hole rough bored
Part taken to manual inspection for first off check
Final boring of hole
Part taken for final inspection and dimensions manually recorded
This process requires around four visits to the quality control department, which
ultimately leads to delays in production. It is not always possible to get
measurements immediately and queuing can occur lengthening the process further.
A test case system has been identified using the Severn Cell within the company.
There are a number of machines present including milling and turning. The testing
will begin on one of four Mazak Nexus 510CII machines. The system will be rolled
out factory wide when successful.
1.1 Aims
Aim 2 – Evaluate against accuracy and cost benefits
1.2 Objectives
Objective 1 – Validation of the machines capability and continued monitoring
Objective 2 – Reduction of manufacturing costs within the company
Objective 3 – Automated measurement and reporting of parts
Objective 4 – Evaluation of the monitoring of the machines, accuracy and capability
Objective 5 – Evaluation of the cost savings made with the introduction of a semi
automated system
Objective 6 – Evaluation of the benefits brought by the research
1.3 Chapter Outline
Chapter 2 – Literature review
Looking at past work and reviewing current systems or those that are being
developed.
Chapter 3 – Initial processes and systems
Review of the company‟s current processes and systems, with identification of areas
for development.
Chapter 4 – Proposed processes and systems
Proposal of processes and / or systems that will improve the company‟s working
practices. This will have been compared to a benchmark set out in chapter 3.
Chapter 5 – System selection
A system will be selected using the proposals of chapter 4. Different solutions will be
presented and trials for suitability where possible.
Chapter 6 – Implementation
The systems and processes outlined in chapter 4, and the equipment selected in
Following on from the implementation in chapter 6, the results of the implementation
will be discussed.
Chapter 8 – Conclusion and further work
After implementation and testing, a review of the achievements will be made against
the original aims and objectives and stating any further work that could be
undertaken.
1.4 Summary
The aim of the research is to implement a semi automatic quality control process and
systems into an SME whilst also evaluate against the accuracies and cost benefits.
In the following chapter a literature review is presented and shows what has been
done previously that could impact upon the project and the likely implications as a
Chapter 2 – Literature Review
2.1 Introduction
The aims and objectives of the research are to implement a semi automatic quality
control process in to an SME and to evaluate against accuracy and cost benefits. To
achieve this it is necessary to review literature regarding present systems and any
reported future developments that are planned. The areas for research will be
machine tool errors, probing systems, software systems, machine tool maintenance
and present systems in use.
2.2 Machine Tool Errors
Machine tool accuracy is affected by the following types of errors [1]:
Geometric errors
Non-rigid errors
Thermal errors
Wear
Geometric errors are inherent within the machine tool as it is made up of many
mechanical assemblies, each of which having inaccuracies due to design and
manufacture constraints.
The geometric errors of a machine tool are made up of the following errors and
amounts, giving a total of 21 per machine for a 3-axis machine [1][2]:
Positioning – 3 per machine
Straightness – 6 per machine
Angular – 9 per machine
Squareness – 3 per machine
Error compensation is an effective way of reducing the nature of errors present in the
machine. This is done through measurement of the 21 standard geometric errors
during a "downtime" period on the machine. A system interprets the results and then
corrects the errors in real time. Re-verification of the machine is then made. A
Okafor and Ertekin [4] also provide vast amounts of information on the geometric
errors within a three-axis machine tool. The errors are mathematically calculated to
form an error model, which is volumetric. From the matrices formed in these
equations for the model, error compensation components were derived and used to
create a new model.
As with many other papers in the field of machine tool errors, Ramesh et al. [5] and
Barman and Sen [6] describe error sources and methods for error elimination through
many different methods including use of measurement tools, such as laser
interferometers.
Thermal errors appear within the machines structure during the heating and cooling
whilst in operation. The heat can come from both internal and external sources.
Internal sources will include:
Heat from the cutting operation
Motors for spindles and axes
Motors for swarf conveyors
Pumps for coolant feed
Friction within moving mechanical mechanisms
External sources will include:
Draughts from doors, roller shutters and loading bays
Heating equipment
Sunlight (warm and hot days)
Thermal errors provide complex issues within the machine tool and give rise to
change in geometric errors as previously described.
Most machine tool manufacturers will provide a specific warm up and cool down
procedure to ensure that an optimum temperature is reached before cutting takes place
to reduce the errors that could be transposed to the work piece. As materials vary,
coefficients of expansion this can prove difficult to compensate for.
There has been a great level of research undertaken in the field of thermal errors
within machine tools, and for compensation. The causes of thermal errors and
methods for reduction within the machine tool structure are described by
Postlethwaite et al. [7]. The paper concludes that even though there has been a large
amount of time spent in researching this area, there still remains a significant problem
thermal distortion would require its own project within the company and will be noted
when implementation of systems takes place for future work.
Non-rigid errors occur from loads placed on the machines structure such as the weight
of the work piece and any fixturing, loads transferred whilst cutting the metal and
weights of tools in the spindle. In many tool data files on the machine tool controller
there is designation for heavy tools, which can be assigned.
Discussion is made by Wang [8] for the use of volumetric analysis of the machine
tool becoming more common and to give a better understanding of the machines
accuracies, as previous linear measurements do not provide enough information. The
measurement of all 21 errors are required to understand the machines capabilities as
machine tool manufacturers improve quality of machines through time. The
Renishaw QC20-W BallBar system allows for some volumetric analysis [2]. The
extent to which this is capable is determined by the volume that can be covered by the
BallBar for length and restriction to three planes. The measured and monitored
volume should match that of the active area used within the machine for most jobs.
There are a large number of ISO standards, which relate to the calibration of machine
tools and CMM‟s. These are listed in the appendix.
Although all of these standards play an important part in the machine tools, there are a
few which stand out as necessary for review during the project including BS ISO 230
– 4 : 2005 - Test code for machine tools - circular tests for numerically controlled
machine tools [46], which will be linked to the BallBar tests. The ISO standard sets
out the principals for measurement of contouring circles to be measured on the
machine tool being tested. It is very similar to the way the BallBar software guides
you through set up of tests, which is very useful as it makes auditing far more simple
under the maintenance programs. A useful guide similar to the help file of the
BallBar 20 software can be found as the annex to the standard showing the likely
errors to be found and where they are likely to originate. The software can provide
the results to this particular standard for easy reference. The BS ISO 230 – 10 : Draft
- Test code for machine tools - determination of measuring performance of probing
systems of numerically controlled machine tools [52] is also quite important as it
could play a future part in any probing systems that are employed on the machine
tool.
provided for positioning errors and 3D volumetric errors. The 3D volumetric
positioning error is defined as the RMS (Root Mean Square) of the maximum errors
of each axis. This is now considered inadequate due to the largest errors being
straightness, squareness and angular errors in modern machines. The volumetric error
is defined as the maximum of the RMS of the total errors in each axis direction. The
volumetric error for angular errors is defined as the maximum of the RMS of the
deviations in three angular directions.
2.3 Machine Tool Maintenance
Machine tools are a complex structure of many mechanical assemblies, which
degrade over time and require maintenance to ensure that accuracies and capability
are maintained over its lifetime. Willoughby et al. [9] discusses how in many cases
machines will be calibrated to an ISO standard and be certified but produce parts that
are incorrect due to a lack of proper maintenance. Machines are then used with
updated offsets to ensure production continues without addressing the specific
breakdown.
Munzinger et al. [10] looks at the maintenance activities that take place and how
machine availability can be improved through use of use of algorithms for parts and
assemblies within the machine tool that are maintenance friendly and also the
associated parts of that failure model. Taking a machine tool apart to its bare
structure would not be maintenance friendly for an operator. It is categorised for
levels of knowledge and training, difficulty, maintenance, costs and other activities.
All of which are formulated and work out which are the most and least friendly
maintenance activities, and which will require follow up work. This can be a useful
approach if there are enough skilled staff within the production team capable of the
tasks presented, however, in most circumstances it is more feasible to call in a service
engineer due to their knowledge and level of training. The downtime for both
methods could be monitored.
Within an American Machinist article [11] a small amount of text focuses upon the
need for maintenance of machines if they are being used for inspection as well as
measurement. A discussion is made for the regular calibration of the machines in a
similar way to the CMM, and that a BallBar test would be ideally run around every
yearly testing could be questioned. As it is a simple test, it should be run frequently
and also as a reactive measure when something happens to cause change.
Planned maintenance scheduling and calibration methods are discussed by Wang and
Thomas [12]. The authors describe the way in which the planned maintenance can be
scheduled through knowledge gained from regular a benchmark for when the machine
tool should be calibrated and serviced. With this knowledge the maintenance can be
scheduled to cause least disruption to production. Many methods for calibration are
mentioned within the article for both linear and rotary axes including grid plate
encoders and laser interferometers with their method for use described.
For multi axis and mill turn machines there are systems available for calibration of the
rotary axis by companies such as Renishaw. The system offered is called Axiset [13]
and gives users the ability to check the pivot point of a rotary axis against its centre.
In a similar way to the BallBar system, a history file can be created for the machine to
monitor any changes over time. This is not a current issue within Craftsman as the
priority implementation machines are 3 axis. It is useful for future equipment
requirements to know systems are available to maintain the calibration of the
machine. Companies such as Heidenhain and Fidia amongst other produce versions
of this test equipment.
Also for multi axis machines is a volumetric distortion assessment method for five
axis machines using un-calibrated master ball artefacts. Erkan et al. [14] uses
measured values for the probing of the artefacts against an expected position to work
out the overall volumetric distortion within the machine tool. The work however
proved to show large variations between machine tool and CMM results, meaning the
author required further work to determine the errors present within the machine tool
to explain the large unexplained errors.
2.4 SPC and Quality Control
Quality control is becoming an issue for many companies with demands on suppliers
for finer tolerances to be achieved. This extra strain is passed through the entirety of
manufacture and inspection. It is therefore starting to become critical to know
accurate levels of scrap and use root cause analysis to find the reason for scrapping
manual processes as possible. These generally go hand in hand with each other. The
use of a pyramid based system, such as the Productive Process Pyramid provides a
structured, systematic approach to ensuring machining consistency. The paper
discusses the need for multiple machines and work of the same type for in-process
inspection to be a viable option; otherwise there will be a vast level of time
consumption. The paper suggests that the machine should not become a replacement
for a CMM however as each machine has its specific purpose with the effects of
thermal error being noted.
Saunders [16] also discusses the Productive Process Pyramid, which was the prior
design to the one shown in the IM110 white paper [15]. Over time it has become
more refined and user friendly, however still benchmarks against previous processes
to continually improve.
Wu and Jiao [17] look at the use of charts in SPC and how they can implement a
system that looks at interval between suspect samples and uses control limits for
determination of non conformance. A study is made into the length of time taken to
calculate the values for the chart with a simple inspection of an attribute and ring
gauge. If more complicated measurement systems are used the time vastly increases.
For the measurements of critical features of the companies manufactured components,
a simple system would be ideal for taking the measured values and calculating its
deviation.
2.5 Probing Systems
Probing systems are becoming more common on machine tools, and can be used for a
variety of purposes such as part location and dimensional metrology. The systems are
more common within large organisations than an SME however where large batches
are produced and output is critical. The method by which the probe functions has
been described by Weckenmann et al. [18].
Use of machine tools as measurement instruments has been long debated, and the
validity of the dimensional measurement on the same machine the part is cut on
questioned due to the same errors being subjected to measurement as those during
cutting. The use of the in-process inspection can however detect errors that were not
picked up during standard maintenance and servicing. The use of compensation
for rectification of manufacturing errors and means that the use of in-process
inspection is becoming more acceptable according to Davis et al [19]. The author
also describes the lack of systems for manufacture of parts that use in-process
inspection to create a closed loop system for cutting and measurement. All such
processes and systems can be related back to the idea of the Productivity Pyramid and
how all levels are used as informative data, which can be used to continually improve
from the foundations up.
Arguments for and against the use of the machine tools is made by Bates [11] as
cutting time is taken away from the machine to measure parts. It is argued, however,
that if parts are left at CMM with faults, there will be longer periods of downtime.
Suggestion is made that a sample inspection of a batch could be made instead of
inspecting every part on the machine. The company previously sub-contracted the
parts requiring CMM checks. This adds extra cost and lead-time to any job that is
going through manufacture.
Kim and Chung [20] show how errors generated due to discrepancies between the
machine tool and contact positions are affected by the geometric errors within the
machine tool, probing error or measurement and also any error within the mechanical
assembly probe unit itself. This leads to error compensation systems being developed
and implemented into a system for measuring parts at an effective feed rate so as to
not affect the rate of production of parts on the machine tool. This however is present
in most software provided with touch trigger probes by the manufacturer in the form
of ISO G-code programs in the current market, and proves how quickly developments
are being made on a technological basis.
Choi et al [21] discuss how conventional measurement on a CMM can lead to
bottlenecks of production and providing need for measurement on the machine tool.
Error models are created for the machine tool to compare against the CMM with an
artefact plate comprising of multiple cubes. The models are used to generate
algorithms for error compensation, and fed into a closed loop system for probing and
cutting with reduced machining errors.
Modern Machine Shop [22] discusses how many manufacturers do not release the full
potential of on machine probing. They have stated that if machines are maintained
correctly and tools such as the BallBar and calibrated artefacts are used that offline
attention and how it can be accommodated for using the artefact methods in a similar
way that Renishaw manufacture their own parts [23].
A case study company in Quality magazine [24] display benefits gained from the
incorporation of probing systems within the company including the time saved
through probing, additional capacity created and the levels of scrap parts. The levels
of scrap in the case study fell from up to 50% to virtually zero with the use of probing
systems. A third unmanned shift can run due to the probing system, which increases
productivity. Offset errors caused 20% of parts to be scrapped, which has been
corrected automatically with software for offset updates. Within the project there will
be a similar benchmarking made for these timesavings to determine the overall
benefits brought about from the new technologies.
Tseng et al. [25] discuss the relationship between in process inspection and inspection
on the CMM following machining. Suggestion is made for capability studies to be
carried out on the machine tool due to the inherent machine tool structure errors
influencing the manufacture of the parts.
Choi et al. [26] discuss the use of Probing systems as a method of error detection
within the machine tool. This method uses an artefact cube based system for
measurement of results found from created models. It uses a compensation system
based on measured cutting values to update a positional value. This method is in
practice within software systems commercially available, such as the Renishaw AE
Pro software.
2.6 Systems in use
Koc and Bozdag [27] investigate the use of advanced manufacturing techniques
within a sample of SMEs. The SMEs were asked about current systems in place such
as CAD and CAM and any automated inspection. Results of their survey show that
just 43% of the companies used some form of automated inspection.
Renishaw‟s RAMTIC (Renishaw‟s Automated Milling, Turning and Inspection
Centre) system [28] uses carousels to automate processes. The carousels contain
tools, work pieces and calibrated artefacts for measurement comparison. Such
systems are well suited for use in mass production environments where time and
used for manufacture, such as their pyramid processes can however be adopted and
developed to suit different applications.
Mazak offer full factory systems called FMS (Flexible Manufacturing Systems),
which are linked in to the Mazatrol CNC controllers [29]. It is essentially a palletised
system (Palletech) that can be placed factory wide. The work pieces are called to the
machines through CNC commands made at the machine as part of automated systems.
This method again is suited to larger organisations and is generally used with larger
parts. The system can be seen in use within their own factory for manufacture of their
machines.
Xu and Newman [30] discuss the advances being made in CNC programming through
use of STEP-NC. The aim of the new programming is to make use of new intelligent
workstations and incorporates CAD and CAM to create programs for the machine
tool controller. With this simple architecture, there could be possibility for linking in
of many systems, which could include in-process inspection.
2.7 Software Systems
Bates [11] shows use of software developed for machine tool use in inspection. The
design is based around a CMM style design and communicates through a PC-Dmis
NC system. In the example shown, Lockheed Martin in Orlando, America, uses the
measurement software. The on machine inspection systems are used to skip or
eliminate previously required quality steps and eliminates bottlenecks at the CMM.
Part programs and probing programs are stored on a standalone server and called
when required directly to the controller. The inspection of parts is now limited to a
first off to check for processes being within specification, and then taking samples
from a batch instead of measurement of all parts.
The uncertainty within software changes dependent upon the algorithms used for
calculation. Raffaldi and Shakarji [31] suggests how efforts are being made to
standardise the testing frameworks for machines. The uncertainties are presented in a
chart for all typical contributors to uncertainty. Similar tests could be used or
2.8 BallBar
Renishaw‟s BallBar system is commonly known throughout industry and is accepted
as a quick health check of a machine. There are systems available from other
manufacturers such as Heidenhain and API, but are not so commonly used in the UK.
The QC20-W BallBar system literature [2] for the product states that it can be used as
a quick 10-minute check of a machine tool. The BallBar software, BallBar 20, offers
flexibility for result output and can be displayed in many standard formats to associate
with ISO, JIS and ASME. Renishaw also offer their own output format, which breaks
down the results to show 15 contributory errors within the machine tool. The
positioning accuracy is recorded in the software to provide information on circularity
and deviation.
The software is also used to build up profiles of the machine tools it is used to test and
graphically records all of the changes over time. There is an ability to generate part
programs within the software, which are post processed to suit the many different
types of machine tool controller allowing full factory flexibility.
For different levels of use within the factory, different modes are selectable within the
software front end [32].
A system using 3 BallBars has been developed by Jywe et al. [33] for 3 dimensional
calibration of machine tools. The solution is offered as a quicker and cheaper
replacement for laser calibration by using triangulation methods. This would
however require a substantial amount of time and knowledge to apply in a factory
environment. The use of laser interferometers would provide greater practicality and
are known for the highest levels of accuracy available.
Kwon and Burdekin [34] demonstrate the errors that are shown through use of a
BallBar system such as backlash, stick slip, servo mismatch and positioning errors.
These are also described within the help files of the Renishaw BallBar 20 software
[32]. The research presented was for the development of a different link system for
the BallBar, which essentially changed the balls and cups around with different
amounts of kinematic motion translation points and was tested against a standard
2.9 Summary
Following the review of literature, decisions can be made to the extent in which
previous research can be applied to the project. Much of the past work has been
suited to large companies producing batches of parts at a time with no variation in
Chapter 3 – Initial Processes and Systems
3.1 Introduction
This chapter will describe the current processes and systems in place within the
company. A flow chart will be created and used as a benchmark on which to build
the new systems.
3.2 Initial Processes and Systems
To understand the current processes, a benchmark flow chart was created and used as
a basis for the additional processes.
As an appendix to this thesis, the processes as set out to satisfy the ISO 9001:2008
Quality manual are included. This discusses the flow of jobs through the Severn Cell
within the company. The Severn Cell is the tool holding area of the company, which
primarily manufactures Capto tool holders and also standard Mazak tool holders.
New developments are currently being investigated and manufactured as part of
research and development in the cell also. If there are drastic changes through the
addition of extra systems and processes, this document will require rectification to
suit and pass any future audits.
Benchmarking of any future processes and systems must start with how the current
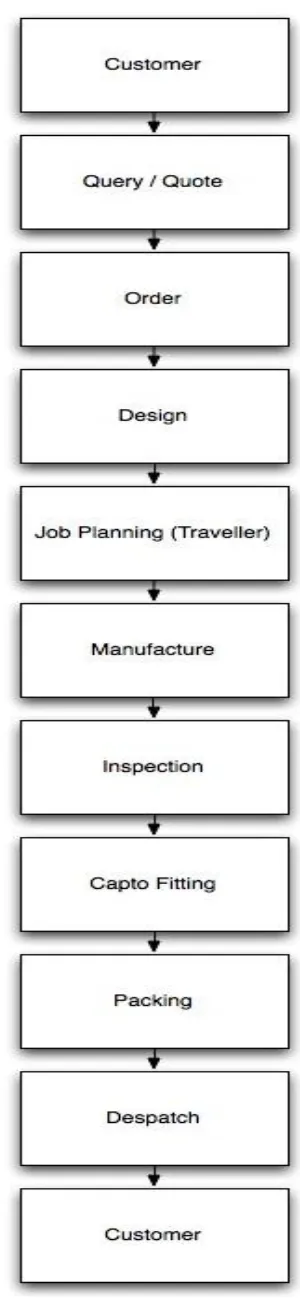
The flow charts show a basic routing from input through to output. The stages are
described below:
Customers can be the end user or a distributor. Whichever category they fall in to, they will require a solution to a current problem. The company has key customers
and as such are provided with preferential rates and lead times. The goal for
achieving these lead times can easily be delayed if parts are scrapped or there is
machine downtime.
A query or quote comes from the customer to enquire about a solution for their problem. A price and lead-time will be provided for their consideration. This will
reflect the current production capabilities; material costs and exchange rates for
export items.
Customers place an order for the goods or service that were previously quoted and a contract is entered in to for this to be fulfilled. If the original date is unachievable, a
new date will be negotiated and agreed upon. This happens in instances where a
quote will have been sent off and the customer comes back a few weeks later.
At some point in the products life cycle, it will have had to be designed. This is a time consuming exercise and can involve extensive research in to the machine tool it
will fit.
If the product is being specially designed, drawings will need to be sent out to the
customer for manufacturing drawing approval before a final general assembly and
detailed manufacturing drawings can be produced.
Conversion of 3D model to relevant format to use in alternative software is completed
where required. The 3D CAD models may require converting to formats other than
the AutoDesk Inventor .IPT format that they are created in.
Every job requires some planning. The companies system provides a job traveler document, which details all processes required for manufacture with barcodes for
operators to clock on and off jobs allowing costing to be made. If the part has been
manufactured previously, the information can be copied across for the routing of the
material from saw to inspection and packing. Where a product is manufactured for
the first time, all information has to be entered for how the part is to be manufactured
and the stages required to do so. The traveler sheets have each operation bar-coded
for tracking of jobs in the computer system.
The machine operators are encouraged to write their own Mazatrol machining
programs for the parts. The staff inspector can check these where necessary, for
operators such as apprentices and trainees. The Mazatrol conversational
programming format is used on the Mazak Nexus Machines for simplified
programming of part programs with graphics to illustrate the part that is being
created.
The parts are firstly rough finished and then taken to inspection for checks to be made for position of bores and slots or tenons. These are all manufactured so that
adjustments can be made, such as a bore would be started with a test hole.
After parts have been produced at the roughing stage, machine datum‟s are updated to
allow the final cuts to take place and be in the correct position and to size. The first
finished machined part will be checked at inspection prior to all other parts being
finish machined.
Program files can be transferred between machines. Currently this is done with
Floppy disks and USB sticks, dependent upon the controller.
Most parts are inspected manually with use of Trimos height gauge or other manual
measuring equipment such as bore micrometers.
The CMM is generally used for measurement of other parts produced in the factory.
It is kept for measuring of complex parts or measurement that is not easily made. The
CMM was purchased following completion of the project meaning that any CMM
required for parts prior to this were sub contracted out, again creating additional cost.
Most inspection is made manually, and will use a Trimos height gauge with test bars
and specially made fixture cubes.
The Capto unit is fitted following manufacture and tested using a Capto test bar for its alignment and run-out. All values are recorded and assigned against an individual
serial number. All information is kept in a database in case of query.
Parts are packed according to customer and include labeling for particular customers or Craftsman branding where appropriate.
Parts are despatched following adequate packing and invoices are generated. Customers receive the parts at the end of the long process flow and pay invoices. If
there are any issues then the customer makes the cell manager aware for rectification.
From the above flow chart of processes, the aims and objectives will use the
following areas; manufacture through to Capto fitting, with the rest being outside the
scope of the project currently.
To effectively improve the current processes and systems it is necessary to review
The shop floor receives drawings from the office as part of job bag, with traveler
documentation detailing the machining operations to take place in the manufacture of
the part.
The staff inspector decides what size material is required for the part and sends the
order to saw for the bar to be cut. In some cases castings are used where available,
and dramatically help to cut down on the time used for material removal compared
with solid bar. Some instances require large flame cut pieces of material, which are
ordered to suit.
The machine operators receive manufacturing drawings from the job traveler packets,
which are stored with the relevant material, and begin to create the part programs
within the Mazatrol conversational programming language on the machine tool
controller.
Where necessary the operators will get the staff inspector to check through the part
program to ensure that it is correct, and simple errors have not been made, such as a
decimal point in the wrong place.
For manufacture the material will initially be loaded into a vice on the machine table
where it will have the top face machined as well as creating a profile whilst traveling
in the Z Axis.
Once the part program reaches the cutting depth that it has been programmed for
(usually clearance of vice and cutter length when using large face mills) it is turned
over and machined in a similar manner to give a profiled part.
Features are added to the block as the next operations and some extra stock removal
for profiles where required.
Holes will be drilled to allow for the part to be attached to its fixture, which resembles
the machine the part is being manufactured to suit. Where required, tenons and slots
or diamond locators are added also.
The fixturing is usually mounted to an indexer, which enables the part to be cut from
5 of the 6 faces.
The first operation in the indexing fixture would be to add pilot holes. It is when
these pilot holes are in place that the part can be removed from the machine for first
off inspection. The centre lines are checked to ensure the position of the main bores
the machining program for offsets that may be required to bring the part within
specification.
The part will be cut just smaller than its dimensioned size with the updated offsets and
then removed as part of the first off checking again and monitored to make sure the
position has not drastically changed, and that it now falls within its drawn values.
Where the part is found to be ok, and no further adjustment required, the part will be
finish cut and then once more inspected as a fool proof.
For all remaining parts of the batch, the program will be run with updated offsets on
the trust of operator knowledge of how much wear takes places against time for
cutting tool wear.
Once manufactured, all parts will go to assembly and be set, with the measured values
recorded in an inspection record sheet against a serial number.
The whole process will vary for time taken per part due to sizes and features. The
average for time taken can be spread over a period however and used to evaluate the
amount of parts produced.
Time taken for measurement of the parts however is more of a constant and can be
evaluated against any other systems that are implemented. An average time for
inspection of a part would be around ten minutes.
Where manual inspection is required the following processes would occur:
The part is mounted to a ground flat fixture, which has been manufactured to replicate
the machine tool the part has been manufactured to fit.
Measurement is required for the centre height of the main bore and also against the
centre line of the part. In most instances, parts will have some kind of tenon or slot,
which dictates where the centre line of the part should be.
The parts are manually measured with use of a Trimos height gauge. This is
calibrated for its touching values against its calibration block.
Each part is measured individually and against the drawn dimensions and tolerances.
Most parts require a tolerance of no more the 20 microns.
The Capto unit itself is measured for its accuracy and run out values using a Capto
ended test bar. Measurements are taken at the base, middle and end of the bar and all
recorded. The Capto unit must be able to provide the end user with the repeatability
All recorded values are stored in a database so that parts can be checked against in the
event of any issues following despatch to customers.
Maintenance of the Trimos is carried out at the intervals of calibration described in
the Quality Manual. The inspection table is also calibrated at regular intervals to
maintain the level of accuracy required.
To zero the Trimos, a calibration block is used which come with the equipment. It
uses ground flat faces for the probe to touch on to in the Z Axis in both directions.
There are currently no preventative measures or processes in place for Ballbar testing
within the company. The company relies upon the operators changing values within
programs to adjust datum‟s and offsets, which mean that the true accuracy of the
machine is unknown and errors are only accounted for during the machining
operations. The machines are serviced yearly with a full service and set up and also
half yearly with an interim service.
With operators changing offsets and datum‟s in the programs to suit each time the
machine maintenance was reduced during difficult economic periods as it was not
seen as added value, and less parts were being produced by each machine. This
however should not be an excuse for no maintenance at all, and plans could be made
for more general maintenance to be brought within the company and a Planned
Preventative Maintenance (PPM) schedule created for each machine.
For the machine tool to accurately produce and measure parts it will require the
understanding and knowledge of the errors that are present within a machine tool and
the effects they can have, and their implications.
The maintenance, whether predictive, planned or reactive will reduce costs from
re-work or scrapping of parts. This is generally due to out of tolerance rather than mad
incorrectly. With proper maintenance in place, tolerances can be monitored and the
overall accuracy should improve over time.
This will ultimately mean that the scrap and re-work is almost eliminated in a
controlled environment and fit within the target tolerance bands of the parts produced.
Most of the standard Mazak tool holders and Capto tool holders are produced to a
tolerance of 20 microns.
If the machine is accurate and monitored then the parts produced on it can be roughed
and finished as well as measured in the knowledge it will be correct.
It is impossible to ever eradicate all errors within a machine tool, as it is a mechanical
a known value of error. A full calibration can however mean the machine is taken out
of production for a long period of time. A simple check on the machines current state
at often intervals can be used to indicate when a full calibration or service is required
for the machine.
The quick checks can be used as part of a preventative maintenance plan and will
monitor any deterioration in the accuracy of the machine, and also for any sudden
changes that may occur. These could come from machine crashes, including tools or
probes hitting the work piece, a fault inside the machine; such as bearing failure or an
external factor such as material being moved to the machine on a crane swinging
round too quickly and hitting the machines structure.
3.3 Summary
The chapter has shown the initial practices within the company for manufacture of
parts and how machines are currently maintained. A great deal of trust is placed upon
the skills and knowledge of operators for programming and running the machines for
the batches of components with the "right first time" approach in mind.
Time spent on manual inspection will be discussed in the following chapters and how
much time the stage takes in a best-case scenario for no queuing time, and removal
and replacement in the machine without delays.
The lack of predictive maintenance will cause problems for tight lead times of
components.
In chapters four and five there will be discussion of new systems and their associated
costs and the benefits they will bring to the company both financially and through
functionality.
Chapter 4 – Proposed Processes and Systems
4.1 Introduction
This chapter will introduce systems and processes that can be incorporated in to the
company's present procedures.
Following on from the benchmarking exercise in the previous chapter, the highlighted
area for improvement will be discussed and presented as a flow chart of the additional
processes required.
The chapter will also discuss the current costs for machining parts, and how this
would be affected if there was a system in place already, as a parts made comparison.
Two very different years are portrayed to give a good example of a very good year's
production and one that shows the effects of the global economic difficulties.
Discussion is made for the machine condition monitoring systems and their costs.
4.2 Description of Processes and Systems
In the new proposed system the following processes will happen:
The parts will be machined and measured during the same process meaning the parts
will no longer require removal from the machine for manual inspection, which as a
by-product also removes any further induced errors that could occur re-attaching the
part to a fixture to machine a second or third time. It is almost impossible to get the
part to be positioned in exactly the same place more than once.
Tool wear will be accounted for during the machining cycles and therefore eliminates
operator intervention.
The process is aimed at being semi automated with operator‟s only loading parts into
the machine for manufacture where a program has already been created for
manufacture of that particular part. A program will be written where necessary,
which will be suitable for the new process. The operator will "press the green button"
to start the cycle and remove completed parts. The only time there would be any
other operator intervention during the cycle is if there was an issue.
It is proposed that the manufacture of further parts could be undertaken during the
night as a third unmanned shift. For this to happen raw material would need to be
the night. The morning shift would then remove the completed parts on the start of
their shift.
For full automation, robotic loading would be required to place raw material into the
machine and remove completed components. This is outside the scope of this work.
A revised flow chart of processes is listed below. This incorporates the extra systems
required from the original benchmark and are highlighted in the italic writing:
Customer
Query / Quote
Order
Design (If necessary)
o Manufacturing drawing approval
o Conversion of 3D model to relevant format to use in alternative
software
Job planning (Traveler)
Manufacture
o Create Mazatrol programs
Roughing Finishing
o Align axes for machine datum – software packages for probing and
measurement all use different relative datum‟s. These are commonly
taken from the CAD model and will not match where the datum is within
the machine tool. This therefore means manipulation of the model is
required in the software for it to match the machine.
o Create measurement program – software for creating a measurement
program is required. Many operate in a similar manner to that of CMM
software. The machine datum and software CAD datum require
alignment, as previously mentioned. This allows for the ISO program that
is generated to work correctly from the machine‟s Work Piece Co-ordinate
system, for measurement of the part.
File transfer – mentioned in benchmarking but now includes transfer of ISO
BallBar test (if required) – Could be linked to the SPC data for running a test
where rogue results become present in the graphical data
Machining – the machining processes are now made up of additional
processes to include on machine measurement of parts during the cutting of
the metal.
Probing checks – probing of the parts will happen during the machining cycle
and finally once the part has been finished. Probing will provide closed loop
feedback to the machine tool controller for part and feature size and position.
This is likely to happen between different processes such as roughing, semi
finishing and finishing.
o Inspection report – the probes measurement of the part will produce an
inspection report, which can be passed on to the customer with the part
and also within the inspection department.
o Scrap – the probing will also be able to give indication of a part that is
potentially scrapped. A message telling the user to manually check for
issues will be displayed. An example of this could be a tool breakage.
o Re-work – The probe will determine the size of the feature it is
measuring compared to a nominal value with tolerances. Logical
decisions can be used to determine whether updates can be made for
size and / or position within the machine tool controller. Tool offsets
or WPC‟s could be updated to allow for correct sizes to be cut.
Continue – once the part has reached the probed features nominal size and tolerance band, the next machining operations can then be completed.
Sample inspection from batch – Once the processes are fully proven and
trusted, it will be feasible to trust the results produced on the machine.
Random samples will be selected from each batch however for a check by the
Inspector for quality assurance against the measured results.
o CMM
o Manual
Report comparison – the inspection reports from both the probing and CMM or manual inspection can be compared to ensure there are no significant errors
Add data to SPC – the statistical analysis of the results from measurement can
be used to monitor the processes and how they vary over time. It will also
provide information for parts that could potentially require a manual check for
verification.
o Out of limit – parts out of limit can be easily identified. The type of
error will also be shown, and may provide evidence of a particular
fault.
o Check tooling – tool wear can be monitored for the amount that it is
updated by after each component is produced. This will be important
if running overnight, as sister tooling will not be available due to
magazine capacity in the tool changer.
o Review processes – the data provided can help with reviewing the
processes and implementing new ideas. For example, this could be the
way holes or bores are machined, such as using circular interpolation
or a boring bar.
o Within limits – parts produced within limits will show that all
processes have been controlled and monitored effectively. This can
provide a figure for number of parts produced wrong against the
number of parts produced overall.
o Continue manufacture – if processes are proving successful and parts
are being manufactured successfully then manufacture can be
continued and monitored until a change occurs. This then must be
investigated.
Capto fitting
Packing
Despatch
Customer
To follow the above description, the additional components have been created in a
4.3 System Time Comparison
Using probing cycles created by M&H or Renishaw software takes one minute.
Manual inspection of components takes up to ten minutes, which involves
transporting the work piece from machine, measurement of the work piece, recording
the dimensions and then return to machine to be re-attached to the fixture.
This would save nine minutes per work piece.
On a batch of ten parts, five may be manually inspected so the total time saved would
be eighty minutes. This involves two measurements on each part, the base and the
Capto. This process could be much longer if the quality control department is
unavailable or busy. This is therefore a best-case scenario.
An assumption for the time saved is used below in the examples, which show the
machine being fully utilised except for idle periods where components are at
inspection or being loaded. Parts other than Capto tool holders are also produced
within the cell. In the assumptions, the money saved is calculated from machine
hourly costs, worked out from the hours that could have been saved with systems in
place.
Using 2008 figures taken from JobBoss system for all Capto units produced in Severn Cell within the year:
Actual:
3,932 hours were spent on machining Capto units.
805 units were made over the above hours.
5 hours per part as an average of parts produced in the time spent machining.
Assumed:
Therefore using the above assumption for timesavings, if new systems were already in
place, then the savings on what was produced are shown below:
242 hours could have been saved over the production time.
£10,264 represents money saved from this probing in production.
Using 2009 figures in the same way as above (Jan to Nov figures used):
Actual:
2,188 hours were spent on machining Capto units.
434 units were made over the above hours.
5 hours per part as an average of parts produced in the time spent machining.
Assumed:
Therefore using the above assumption for timesavings, if new systems were already in
place, then the savings on what was produced are shown below:
130 hours could have been saved over the production time.
£5,536 represents money saved from this probing in production.
26 extra parts could therefore have been made in the time saved.
Figure 4: Parts made comparison
The graph shows the number of parts produced in the corresponding years and next to
it the number of parts that could have been produced in the same amount of time if the
system was in place.
Per Part Assumption:
Average time machining per part is roughly 5hours.
0.3 hours saved on machining time producing each part with on machine inspection.
£13 represents the money saved per part on machining.
Full Utilisation Assumption:
If parts were machined based on 16 hours per day machining over 5 days constantly
then the assumption would be that:
14,400 hours could be utilised.
2,880 Capto units could be made at an average of 5 hours each.
864 hours could be saved with probing systems employed on the above figure.
£36,720 represents the money that would be saved as a result of this.
173 extra parts produced capability from the time saved using the probing system.
The full utilisation assumption is based on the cell producing only Capto tool holders
and that the demand for products would be able to match the available capacity.
4.4 Machine Analysis and condition
As there was no previous system for machine condition monitoring at the company
there is a vast scope for opportunity.
There are many different machine tool health checks that can be made. These
include:
BallBar – a simple and quick test to run. It uses a Linear Variable Displacement
Transducer (LVDT) to measure deviations in a programmed circular (or part) path.
These measurements are recorded in diagnostic software from the BallBar
manufacturer.
Gold standard component – uses an artefact that has been created on the machine tool
and verified for size on a CMM. It can be probed on the machine tool to check for
sizes. Any inaccuracies would give rise for a calibration requirement. Parts produced
can be compared to the artefact using logic statements.
Laser Interferometer – highly accurate for measurement, however takes a
considerable amount of time to carry out tests with. It uses light of known
The BallBar system provides coherent readings and can be linked into the probing
results of parts. This is very important and is discussed further in chapter 5.
The BallBar should be introduced on a regular scheduled basis factory wide. Where
applicable, the simple test can also be run if an accident has happened on a machine
or if there are erroneous results being produced in the manufactured parts.
A Planned Preventative Maintenance schedule would be useful across the factory and
would sit between the full yearly service and half yearly services of the machines.
The condition monitoring of the machines is essential as a foundation of all processes.
If the machine is not capable of producing parts accurately in the first instance, the
machine will only be able measure to that capacity also. This could be very
detrimental to the parts produced as probing would say they are correct even though
they are in error.
The BallBar test takes around 30 minutes to complete from setting up, to running the
tests and evaluating the results in all three planes.
With no current diagnostic or health check system in place it is very difficult to put a
definitive monetary value against the costs of the downtime of machines. However, if
it was put in to context that every hour the machine is down, the company is not
producing, which equates to between £40 - £50 per hour. On top of this there is the
lost revenue from finished parts and productivity overall suffers and leads to extended
or late lead times of parts.
Machine inaccuracies also account for a proportion of the levels of scrap produced.
The machines are potentially running with inaccuracies, which could ultimately lead
to machine failure. If this is monitored correctly, the prevention of failure will be
more cost effective than reactive maintenance and give shorter planned downtime
periods.
An example graph of the output of a machines history is shown below and illustrates
how the machine deviates over time and also how it requires attention when it gets to
Figure 5: Example BallBar trend graph
4.5 Summary
The benchmark of chapter three's current processes has been used to create a new
flow chart of the processes and systems required to achieve the aims and objectives.
The costs