2016 International Conference on Electronic Information Technology and Intellectualization (ICEITI 2016) ISBN: 978-1-60595-364-9
The Method of Estimating the Number of
Access Channels in M2M Communication
Based on the Queuing Theory
Dongxue Liu and Cong Wang
ABSTRACT
M2M communication has a large number of data packets contributing to the base station within a short period of time. Due to the fact that the number of resources required is limited, only parts of the packets can access to the base station. To efficiently utilize the access channels, we need to estimate the optimal number. In the paper, we attempt to estimate the number of access channels serving for packets, based on the queuing model X / / /
M M c . The relationships between the average
queue length with the number of channels and the queuing time with the number of channels are obtained from mathematical formulas. The simulation finds the best channel number to achieve the overall throughput in the system.
INTRODUCTION
M2M devices, which sensitive to the conditioned stimulus, produce a large number of short data packets to the base station. The problem is that many packets cannot access the base station because of the limited access resources.
Relating to the random access in M2M communication, [1] presents the group paging communication according to the quality of service demand and packet arrival rate, but it only applies to a certain range of machines. [2] separates the RACH resources between M2M and H2H devices, but the resources of one type ________________________
cannot be used by the other. [3] provides that the resources are dynamically allocated based on the predicted traffic, but the network must be aware of the time when the MTC devices have information to be sent. [4] introduces a separate access class for MTC devices, allowing the network to control the access of MTC devices separately. Controlled Distribution of Resources (CDR) introduced in [5] schedules the packets based on terminal ID, but it is only dedicated to the specific case when MTC devices are in the RRC CONNECTED mode. Consecutive Group Paging (CGP) in [6] is the method that the MTC devices failed in the first GP interval will try to access the network in the subsequent GP interval(s). However, CGP performances are worse than the classical Group Paging for certain configuration. In the paper, the queuing model X / / /
M M c is applied
for random access to achieve the optimal overall performances for system, aiming to make as much machines successfully access to the base station as possible. Two performance metrics, average queue length and average queuing time are derived from mathematical formula.
SYSTEM MODELING
Batch arrive model M X /M c/ /in the queuing theory can be divided into
three parts, input process, queuing rules and service rules. For input process, packets in the form of discrete batch arrival, independently reach into the queuing system. Assuming no empty phenomenon, the number of reaching packets is a positive integer number X,
X 1, 2,3,
with a probability distributionxi P X
i
. The time when packets arrive into the queuing system is subject to Poisson distribution with parameter. For queuing rules, packets can access to the base station server with free random access channels. When all channel resources are occupied, later arriving packets wait in queues for free channels in the principle of first come first serve. For service rules, the channel resources of the system do not interfere with each other and each resource only allows a packet to access to the base station. Access time obeys the negative exponential distribution with parameter
.ANALYSIS OF SYSTEM PERFORMANCE
X t
server with the number of idle channels c-n. Staten c
1 n k
represents that all channels are in busy states, with the number of packets n-c waiting for the idle channels. The birth rate and death rate of the birth and death process change overthe state of the system, with
nand
nwhen the system is in n state, detailedexpressions are shown as below.
, 0 0, n n k k n
(1)
, 0 ,
n
n n c
c c n k
(2)
Defining n lim
t
p P X t n
, the stationary distribution
{ ,0
p
n
n
k
}
can be derived.
1 1 0 1 1 0 0 11 ,1 1
,
, 0
n
n n n i i
i n
n n n i i
i
n p n p x p n c
c p c p x p c n
p p n
(3)
Utilize the probability generating function to solve the problem. Set the
probability generating function of the queue system size distribution
pn
0
n n n
P z p z
. Add up the above three formulas (3), then multiply
z
non both sides of the equation.The character L represents the average queue length of the system.
Computational expression isLP z
|z1.
1 1
0 0
2
2 1 1 2 1
2 0
c c
n n
n n
c C n c n p C C c n p
L c C
(4)The average queuing time of a certain packet is indicated as character wand
its distribution function isW t
P w
t
.
0
0
P w t P w P w t (5)
1
0 1 1
0 c m c m
m i i c m
c m
P w p P x i P x i
i
(6)
1 1 00 1 1
0
1 1
0
1 1
0
1 ( )
0
1
j c m j c m
c i i
c m
j c m m i c m j c m
m c m c j i i
c m
m c j
m c i j
c
P w t p P x i e d
i e d
c
p P x i e d
i e d
(7)THE SIMULATION RESULTS
0 10 20 30 40 50 0
0.2 0.4 0.6 0.8 1 1.2
channel resource quantity c (a)
av
era
ge queui
ng leng
th L
a=2 a=3 a=4 a=5
0 10 20 30 40 50
0 0.05 0.1 0.15 0.2 0.25
channel resource quantity c (b)
av
er
ag
e
w
ai
ting
t
im
e W
[image:5.612.101.493.85.245.2]p=1 p=2 p=3 p=4
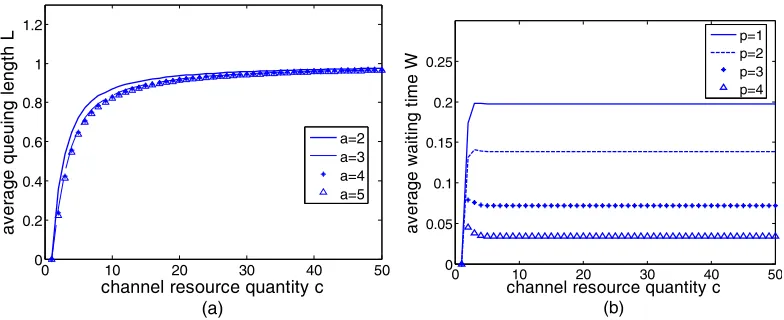
Figure 1. The relationship between two performances and channel resources quantity. (a) The relationship between average queuing length and channel resources quantity.
(b) The relationship between average waiting time and channel resources quantity.
In Fig. 1(a), the average queuing length increases rapidly with c increasing
from 1 to 8. Then, it still increases along with the increasing number of channel resources, but the amplitude eases. In Fig. 1(b), the system average waiting time increases dramatically with the number of channel resources, when c varies from
1 to 2. The average waiting time achieves the peak when c =4. Later on, it
remains at the constant number 0.1977.
As shown in these two figures, in order to make more packets be served, the number of channel resources should be no less than 5.
CONCLUSIONS
This paper applies queuing theory model to M2M communication. Due to the limited number of access channels, only parts of the packet services can be satisfied. We complete theoretical formula derivation and simulation analysis of two performance metrics. The purpose of this paper is to analyze the relationship between the two performances and the channel resources quantity.
REFERENCE
1. S.Y. Lien, K.C. Chen, Y. Lin, 2011, “Toward ubiquitous massive accesses in 3GPP machine-to-machine communications”, IEEE communications magazine, 49(4): 66-74. 2. Ki-Dong Lee, Sang Kim, and Byung Yi, 2011, “Throughput Comparison of Random Access
3. Arouk and A. Ksentini, 2014, “Multi-Channel Slotted Aloha Optimization for Machine-Type-Communication”, Brazilian Journal of Medical & Biological Research, 36(10): 1397-1401.
4. D. Wiriaatmadja and K.W. Choi, 2015, “Hybrid Random Access and Data Transmission Protocol for Machine-to-Machine Communications in Cellular Networks”, Wireless Communications, IEEE Transactions on, vol. 14, no. 1, pp. 33–46.
5. Osama Arouk, Adlen Ksentini, Yassine Hadjadj-Aoul, and Tarik Taleb, 2014, “On Improving the Group Paging Method For Machine-Type-Communications”, IEEE International Conference on Communications (ICC) , June 2014, pp. 484–489.