Comparative Analysis of Behavioral Classification of
Computer Networks and Early Warning System for
Worm Detection
Olabode O
Department of Computer Science
Federal University of Technology Akure,Nigeria
Adebayo O.T
Department of Computer Science
Federal University of Technology Akure,Nigeria
Iwasokun G.B
Department of Computer Science
Federal University of Technology Akure,Nigeria
ABSTRACT
The effort required for detecting worm that threaten the reliability and stability of network resources is in the process of advancing, demanding increasingly sophisticated resources. A worm is a self-propagating program that infects other hosts based on a known vulnerability in network hosts. The spread of active worms does not need any human interaction. There is a growing demand for effective techniques to detect the presence of worms and to reduce the worms spread. Worms have become a major threat to the Internet due to their ability to rapidly, compromise large numbers of computers. This work presents a comparative analysis of behavioural classification of networks (BCN) and early warning system (EWS) to determine which one performs better in computer worm detection.
Keywords
BCN,EWS, Response Time, Net Packet
1.
INTRODUCTION
Nowadays, excellent technology (i.e., anti-worms software packages) exists for detecting and eliminating known malicious codes. Typically, anti-worms software packages inspect each file that enters the system, looking for known signs (signatures) which uniquely identify an instance of known malicious codes. Nevertheless, anti-worms technology is based on prior explicit knowledge of worm code signatures and cannot be used for detecting unknown worm codes. Following the appearance of a new worm, a patch is provided by the operating system provider (if needed) and the anti-worm vendors update their signature-base accordingly. This solution is not perfect since worms propagate very rapidly and by the time local anti-worm software tools have been updated, very expensive damage would have been inflicted by the worm.
2. RELATED WORKS
attack techniques and in-depth analysis of an adversary’s strategies [1]. In [5] researchers used honeypots inside a university to detect infected machines behind a firewall. This augmented an existing IDS and sometimes provided earlier warnings of compromised machines.
3.
Behavioral Classification Of
Network (BCN) To Detect Unknown
Computer Worm
3.1.
System Architecture
Packets moving across and through the network forms traffic on the network, the activities of these packets and how it affects the network forms the basis on which the BCN works. The network monitor performs utility check on the network to determine the state and performance of the network and to alert any outbreak of computer worm. This is where the strength of BCN lies. The setup of the system architecture enables the measurement of some network parameters and saved the values in the database, as worm is propagated through the network, and for further identification of worm attack using instance based learning technique.
3.2
Database Design
The database model design for this system is a data model that is capable of efficiently representing the data stored by the system. The Packets table store network packet captured, the
Time of capture and every packets stored is given a unique number as id. The network_metric table store the network parameter values for the packets identified by Packet_ID
related to the Packets table, each set of network parameter value is identified by a unique number called ID.
3.3 RESULT OUTPUT
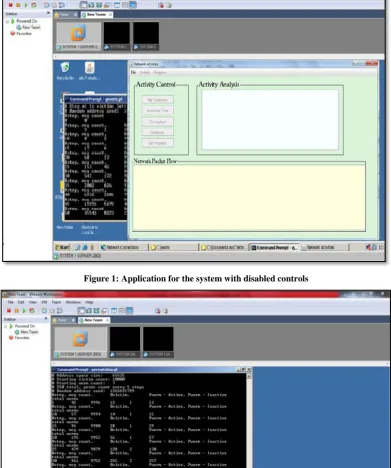
systems that forms the VM ware team while the worm-scan-activities is ongoing on the net due to the execution of NWS on the same machine or another. The controls and menu in the application system is disabled when it is started, to enable the control click on the FILE menu and select the ENABLE option. The EXIT option terminates the application. To keep record of all network parameter at specific time interval select the Save Activities option from Activity menu. The Network Summary control found in the group of activity control; display the list of available network interface in the system (operating system level) for creating a network connection. The names of the interfaces are displayed on the activity analysis panel, while the characteristics of each interface are displayed in the Network Packet Flow panel. The Response Time control determines the network response time to particular host before the activity of the worm on the network. The response time is displayed on the activity analysis panel.
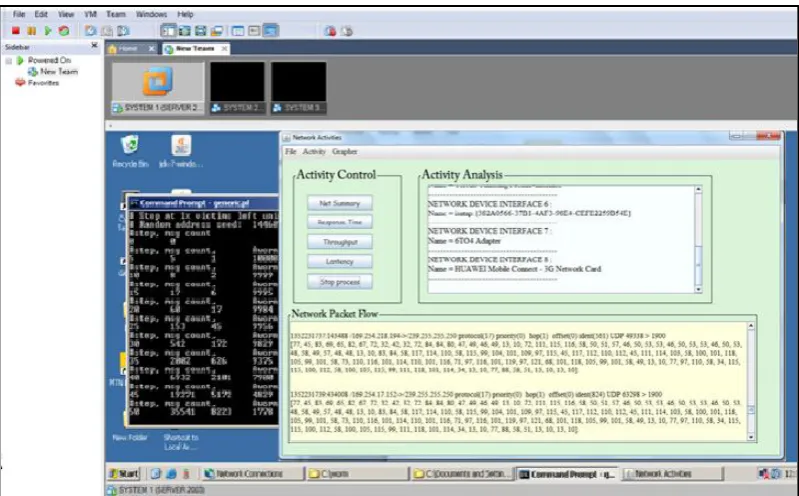
Throughput control determines the throughput of the network before the worm activity on the network. The host the request is sent to and the average throughput is displayed on the activity analysis panel, while the packet sent and reply information is displayed on the Network Packet Flow panel. To display the network packet traffic and other parameter of the network, use the Net Packet control, the packet traffic is given a number and it’s displayed on Network Packet Flow
panel and the details (such as source/destination IP, checksum, protocol version, hop limit, etc. ) of each shown in
activity analysis panel. Figure 1. shows the interface of the system application on startup with all the menus and controls disabled. Figure 2. is a screen shot of the system interface showing the network traffic captured in network packet flow panel and the list of available network interface. The activities of the network captured by the system application is logged in a file called activities.buk located in a folder created called log in the windows’ my document folder. The log file (activities.buk) can be viewed with any text editor (such as notepad, notepad++, WordPad).
4. WORM EARLY WARNING SYSTEM
(EWS)
Internet-worm early warning (EWS) system is deployed at the main gateway of enterprise network at the gateway or a monitor station [3]. The basic idea is to sample the internet scan activities by monitoring a portion of the IPv4 address space behind the gateway. The system detects potential worm outbreak by analyzing the pattern of increase in external scan sources and comparing their similarity. It captures the common signature from those sources in order to assist human analysis or automatically reconfigure a filtering device to block them. Let A be the monitored address space, which is separated from the rest of the Internet by a gateway.
The primary task of WEW is to profile all external scan sources from the Internet. To do so, a naive approach is to keep track of all inbound TCP SYN packets [3]. If the number of SYN packets from an external host exceeds a threshold value within a period of time, the host is thought to be scanning. Monitor outbound TCP RESET packets, which indicate failed inbound connection attempts, where the worm scans for and then infects certain types of web servers. A connection attempt fails if the destination host does not exist or the destination port is not open. Specifically, if a SYN packet is sent to an existing host with the destination port closed, a TCP RESET packet will be returned; if a SYN packet is sent to a non-existing host, an ICMP host-unreachable packet is returned. Consequently, most random connections made by a worm scan will fail, which also implies that the scan rate can be roughly measured by the rate of failed connections. A normal user does not persistently cause connection failures to different destination addresses at a high rate. Therefore, by monitoring TCP RESET and ICMP host-unreachable packets, we can set worm scan sources apart from normal users. Assume the monitored address space A is densely populated. Outbound TCP RESET packets will be the main form of response to failed inbound connections. Examining RESET packets alone at the gateway will suffice the detection of external worm scan sources. Specifically, when WEW detects the number of RESET packets to an external host exceeds a threshold value within a period of time, it reports the host as a likely scan source [4]
5.
SYSTEM
EVALUATION
OF
BEHAVIORAL CLASSIFICATION OF
NETWORK BCN AND WORM EARLY
WARNING SYSTEM (EWS).
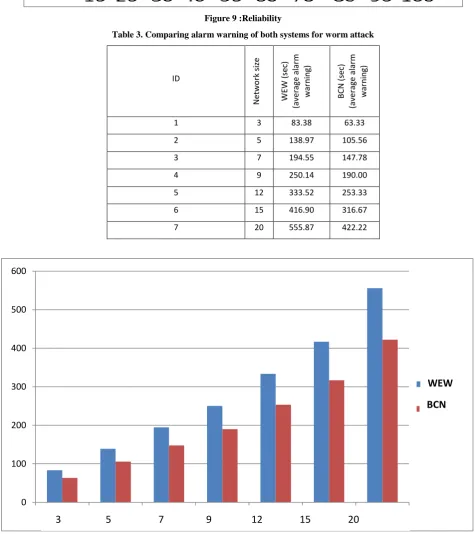
EWS is capable of issuing a warning at an average of 25seconds for an infected system on the network, from the result in table 2 and table 3,BCN is capable of issuing a warning at an average of 10sec. The table below shows the outcome, using equation 1.1 for both systems at different network size.
6.
CONCLUSION
Figure 1: Application for the system with disabled controls
Figure 3: Application for the system with enabled controls
Table 1: Normal value for network parameter
NETWORK PARAMETER
(METRIC)
AVG. VALUE
NETWORK
LATENCY
0.42
THROUGHPUT
1.02BANDWIDTH
RESPONSE TIME
0.25
NETWORK
UTILIZATION
PACKET
LOSS
RELIABILITY
Table 2: Network parameter value for BCN
Metrics
Latency
Throughput Response
Time
Network
Utilization
Packet
Loss
Reliability
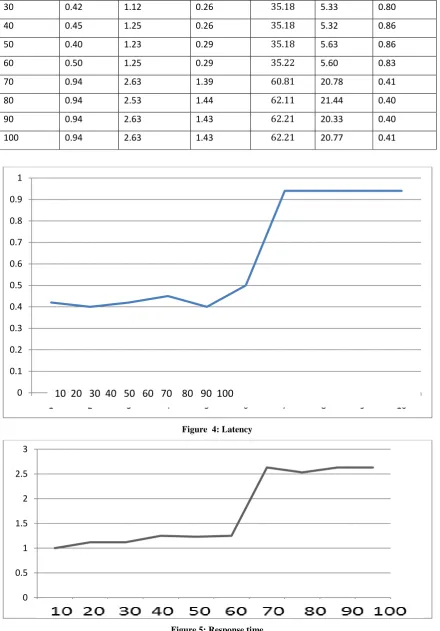
30 0.42 1.12 0.26 5.33 0.80
40 0.45 1.25 0.26 5.32 0.86
50 0.40 1.23 0.29 5.63 0.86
60 0.50 1.25 0.29 5.60 0.83
70 0.94 2.63 1.39 20.78 0.41
80 0.94 2.53 1.44 21.44 0.40
90 0.94 2.63 1.43 20.33 0.40
[image:5.595.80.521.72.704.2]100 0.94 2.63 1.43 20.77 0.41
Figure 4: Latency
0 0.1 0.2 0.3 0.4 0.5 0.6 0.7 0.8 0.9 1
1 2 3 4 5 6 7 8 9 10
10 20 30 40 50 60 70 80 90 100
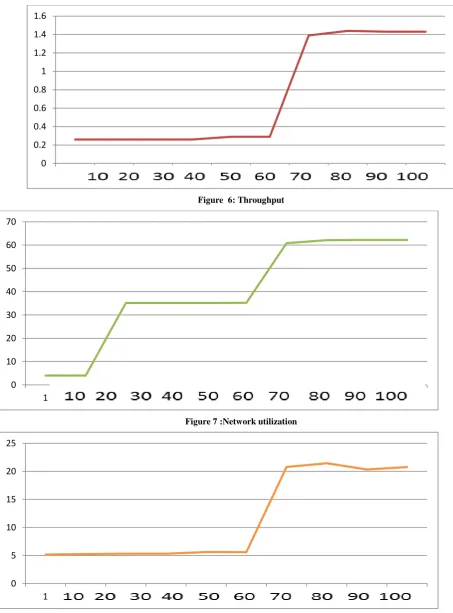
Figure 6: Throughput
Figure 7 :Network utilization
Figure 8: Packet loss
0 0.2 0.4 0.6 0.8 1 1.2 1.4 1.6
1 2 3 4 5 6 7 8 9 10
0 10 20 30 40 50 60 70
1 2 3 4 5 6 7 8 9 10
0 5 10 15 20 25
Figure 9 :Reliability
Table 3. Comparing alarm warning of both systems for worm attack
ID
N
etw
o
rk
s
iz
e
W
EW
(
se
c)
(aver
ag
e alarm
w
arn
in
g)
BC
N
(
se
c)
(aver
ag
e alarm
w
arn
in
g)
1 3 83.38 63.33
2 5 138.97 105.56
3 7 194.55 147.78
4 9 250.14 190.00
5 12 333.52 253.33
6 15 416.90 316.67
7 20 555.87 422.22
0 0.2 0.4 0.6 0.8 1
1 2 3 4 5 6 7 8 9 10
200 300 400 500 600
Series1
Series2
WEW
7.
REFERENCES
[1] Addison W and Lance S 2003Honeypots: Tracking Hackers.
[2] Berk V.H., Gray R.S., and Bakos G. 2003.Using sensor networks and data fusion for early detection of active worms. In Proceedings of the SPIE AeroSense,2003.
[3] Chen Z, Gao L, and Kwiat K 2003 Modeling the spread of active worms. In Proceedings of the IEEE INFOCOM 2003, March 2003.
[4] Shigang Chen, Sanjay Ranka 2004 Detecting Internet Worms at Early Stage
[5] John L, Richard L, Henry O, Didier C, and Brian C.2003. The use of honeynets to detect exploited systems across large enterprise networks”. In Proceedings of the 2003 IEEE Workshop on Information Assurance.
[6] Wu J, Vangala S, Gao L, and Kwiat K 2004. An efficient architecture and algorithm for detecting worms with various scan techniques. In Proceedings of the 11th Annual Network and Distributed System Security Symposium (NDSS’04), February 2004.