Usage of Variable Structure Congestion Control
Protocol (VCP) in Buffer Overflow Attack Blocker
M. Vinodhini, M.C.A.,
Research Scholar,
Manonmaniam Sundaranar University, Tirunelveli
P. Arockia Jansi Rani, M.E.,
Department of ComputerScience & Engineering, Manonmaniam Sundaranar University, Tirunelveli
ABSTRACT
In this paper, we proposed the usage of “Variable Structure Congestion Control Protocol” in network communication to avoid Buffer Overflow thereby preventing Buffer Overflow Attacks. In general transferring a signal between connected Clients are done through “Transmission Control Protocol” in which only two states are clearly shown i.e. either “0” or “1”. For successful transmission “1” is represented and for failure transmission “0” is represented during transmission process. In “Variable Structure Congestion Control Protocol “there are four possible states for representing the signal transmission. They are “00, 01, 10, and 11”. Through VCP the signal transmission can be classified as “Low load region”, “High load region” and “Overload region” from which the transmission load can be monitored thereby preventing “Buffer Overflow” in network transmission.Round Trip Time (RTT) and Round Trip Time Timeout (RTO) have been calculated together with VCP to prevent buffer overflow attack during signal transmissions.
General Terms
Buffer overflow is the root cause for most of the cyber attacks like worms, zombies, botnets and server breaking.
Worms - Self-replicating malware computer program which uses a computer network to send copies of itself to other nodes and it may do so without any user intervention.
Zombies - a computer connected to the Internet that has been compromised by a computer virus or cracker and can be used to perform malicious tasks even in remote directions.
Botnets - a large number of compromised computers that are used to create and send viruses or flood a network with messages as a denial of service attack.
Return to libc attacks – a computer security attack usually starting with a buffer overflow in which the return address on the stack is replaced by the address of another instruction. This allows attackers to call malicious code without the need to inject malicious code into a program.
Code Injection - can be used by an attacker to inject code into a computer program to change the course of execution.
Keywords
Round Trip Time, Variable Structure Congestion Control Protocol, Buffer Overflow Attack
memory locations which makes the program‟s behavior to be altered. It may corrupt flow of control or data without injecting code by return-to-libc attacks or any data pointer modification. There are two types of Buffer Overflow. They are Stack Based and Heap Based. In stack based overflow, overwriting or changing the security oriented variable or control flags stored in unchecked buffers are done. In heap based overrun occurs by allocating memory dynamically at run time by any application.
Buffer Overflow or Buffer Overrun in secure programming happens while writing a data to a buffer which overruns a buffer boundary and get copied into any adjacent memory. By placing the code that the hackers are trying to execute may be in the buffers overflowing area. Then by overwriting the return address, so that it points back to the buffer and executes the intended fault code. The program may result in incorrect behavior including memory access errors, incorrect results and a crash because of this code injection attack [1]. Automation of Buffer overflow detection techniques without any human intervention can be proposed [2].
Memory protector can be implemented to prevent stack based buffer overflow attack from malicious activity like code injection attack [3]. To avoid such buffer overflow attack preventing buffer overflow is an unavoidable one. In such situations the enhanced version of the normal TC protocol i.e. the VC protocol can be used [5]. By stating the flow of transmission of signals in network as low, high and over load the buffer overruns are prevented. While monitoring the transmission load, alternate channels can be chosen for regular transmission when the load status is high. The performance issue of signal transmission is high in VCP while comparing it with the TCP [6].
2.
ROUND TRIP TIME (RTT)
In network transmission the necessity for the retransmission is based on the Round Trip Time (RTT) or Round Trip Delay Time (RDT) which is the length of the time it takes for the signal to be sent plus the length of the time takes for an acknowledgment of that signal to be received. The Round Trip Time Timeout (RTO) is the maximum time that the sender must wait for the receiver‟s acknowledgement during the signal transmission.
2.1
Measuring Buffer Overflow using RTT
Based on the RTT value together with Variable Structure Congestion Control Protocol calculated from the signal transmission between the clients the buffer overrun is clearly predicted thereby the load is limited. Setting maximum RTT (Round Trip time Timeout) prevents the buffer overflow attack.
2.2
Round Trip Time (RTT) Formula
The formula for calculating Round Trip Time is as follows
SRTT(i+1) = (1-α) * SRTT(i) + α * RTT(i+1) sec RTO = β * SRTTsec
RTT = round-trip time. SRTT = smoothed value of RTT.
RTO = round-trip time timeout.
α, β are constants and generally α= 0 to1 and β= 1to10
3.
Architecture of Buffer Overflow Attack
Blocker
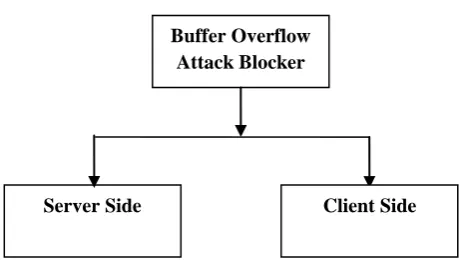
Fig 1 states the block diagram of Buffer Overflow Attack Blocker in which two main modules are the Server side and the Client side. In Client side the status of the signal i.e. the state indicating whether the signal is transmitted successfully or not has been clearly stated. Also the size of the signal in terms of packets has been calculated. Packet analysis has been carried out using Round Trip Time so that by using TCP and VCP the entire transmission is clearly monitored as in Fig 1.1
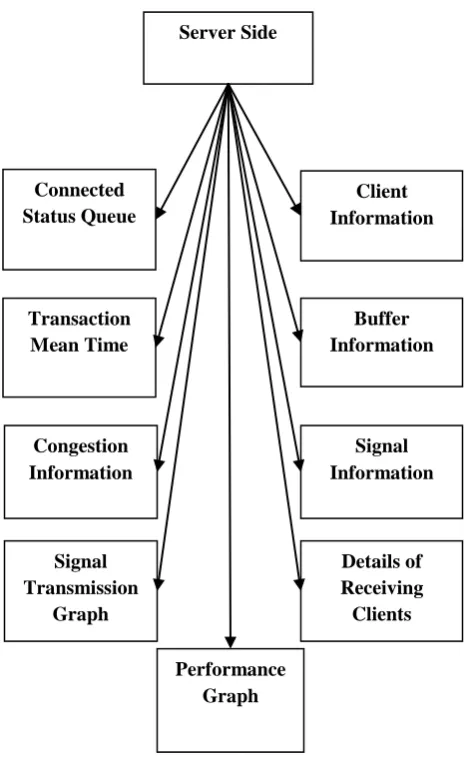
In Server side each and every client‟s connection details, details of received clients, the priority given for the signal to transmit over the network and the transaction mean time are clearly stated as represented in fig 1.2. In TCP the successful transmission is stated as „1‟ and the failure transmission is stated as „0‟. But in VCP the successful transmission is stated as 01,10,11 depending upon the load of the transmission which is low, high or overload. The failure transmission is stated as 00. Retransmission has also been carried out in case of failure transmission which will prevent buffer overrun. By choosing an alternate channel in case of prediction of buffer overflow the buffer overrun is avoided so that hackers cannot attack the code on buffer which seems to be overrun. If the Round Trip Time Out (RTO) occurs then only there may be
[image:2.595.315.545.88.226.2]the need for retransmission happens in the network.
[image:2.595.315.550.285.631.2]Fig 1 Overall Block Diagram of Buffer Overflow Attack Blocker
Fig 1.2 Server Side Control
4.
Signal Transmission
The table 1states the signal transmission between the client in a network on the basis of Round Trip Time (RTT) and Round Trip Timeout(RTO). Each and every signal is divided into number of packets and the transmission status is noted with respect to Transmission Control Protocol (TCP) and Variable Structure Congestion Control Protocol (VCP). The table 1 lists the Round Trip Time Time Out calculated for a sample signal transmission between clients. Based on RTT, RTO and the Threshold value the TCP and VCP states are calculated. In TCP “1” represents successful transmission therefore there is no need for retransmission and “0” represents failure transmission and therefore there is a need for retransmission of signals. In VCP based on RTT value the load in the transmission is stated as low load (01), high load (10) and over load (11). In over load state the retransmission is done because the normal transmission fails which has been predicted by the calculation of RTT and RTO.
Consider a sample signal transmission in which table1 shows the Round Trip Time Timeout (RTO) and Round Trip Time
done immediately. In TCP all the other values below the threshold value 2.5 is considered to be the successful transmission. But in VCP even though the RTO values are below the threshold value 2.5 a further classification can be done based on the RTT value to indicate the load as low or high. If the RTT value is less than 0.5 then the transmission load is low (01) and if the RTT value is greater than 0.5 then the transmission load is high (10) both indicating successful transmission with varying transmission load. By using Variable Structure Congestion Control Protocol (VCP) possibly more number of transmission statuses can be stated while comparing Transmission Control Protocol (TCP).
Table 1 – Comparison of TCP & RTT in terms of RTT
RTT RTO
Acknowledgement Status
Retransmit Status
TCP VCP
073 2.192 1 10 No
.1 1.246 1 01 No
.41 1.241 1 01 No
.407 1.236 1 01 No
.207 1.113 1 01 No
.036 0.946 1 01 No
332 0.998 1 01 No
.658 1.976 1 10 No
- 2.903 0 11 Yes
.71 2.132 1 10 No
.006 1.245 1 01 No
.152 1.18 1 01 No
- 2.891 0 11 Yes
.159 1.252 1 01 No
- 2.819 0 11 Yes
.554 1.662 1 10 No
- 2.841 0 11 Yes
- 2.732 0 11 Yes
- 2.811 0 11 Yes
.487 1.592 1 01 No
[image:3.595.310.535.198.625.2]4.1
Role of Transmission Control Protocol
(TCP) and Variance Congestion Control
Protocol (VCP) in RTT
Transmission Control Protocol (TCP)
[image:4.595.80.518.123.402.2]TCP States
Fig 3: TCP Vs Round Trip Time
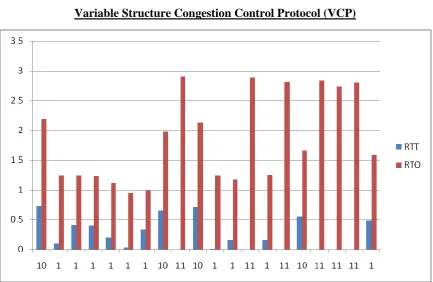
Variable Structure Congestion Control Protocol (VCP)
VCP States
[image:4.595.82.516.433.715.2]The graphs in Fig 3 & 4 correspond for the plotting in the table1 which is stated in the above section. While Comparing Variable Congestion Control Protocol with Transmission control Protocol four possible states of transmissions are clearly stated based on RTT and RTO taken for the transmission.
5.
RESULTS & DISCUSSIONS
In network the transmitted signal is divided into number of packets. By using Round Trip Time (RTT) calculation the packets sent are monitored using TCP and VCP. The packet which is congested is again retransmitted. By the usage of Variance Congestion Control Protocol the high load region is predicted and so the buffer overflow is blocked. Normal transmission has been carried out when the load is either in low load or middle load. The sample implementation shots for a normal signal flow of transmission between clients by using TCP and VCP based on RTT calculations are depicted in the below figures.
Client Window
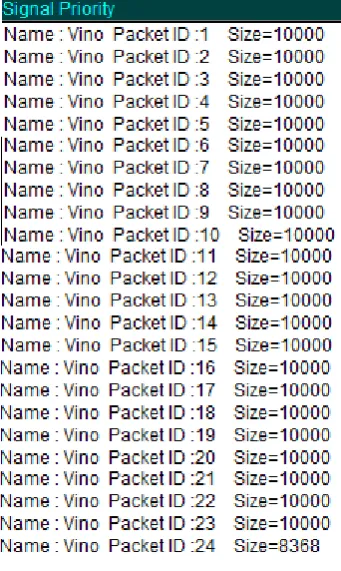
[image:5.595.316.548.259.392.2]Fig 5: Connected Client Details
Fig 6: Signal Transmission from a Client
Fig 7: Signal Detais for a Client
Fig 8: Graph Showing Signal Tranmission of a Client
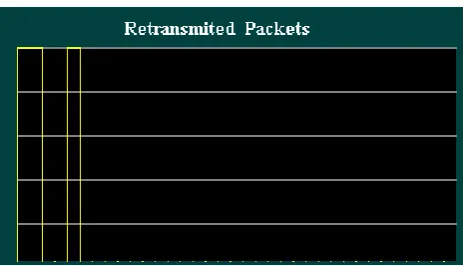
Fig 9: Retransmission Signal Graph for a Client
[image:5.595.79.257.443.547.2]Fig 11: Signal Flow Details of a Client
Server Window
[image:6.595.54.281.174.362.2]Fig 12: Details of connected Clients
[image:6.595.315.545.415.534.2]Fig 13: Signal Transmission Time taken for Client
Fig 14: Pictorial representation of Number of Clients
Fig 15: Signal Transmission graph for a transmission
[image:6.595.342.516.566.639.2]Fig 17: Signal Transmission from a Client
Fig 18: Received Clients during Signal Transmission
Fig 19: Congestion details of a Signal for a Client
6. CONCLUSIONS
In this paper, the usage of Variance Congestion Control Protocol in normal network transmission has been analyzed. Its specialty over the Transmission Control Protocol in predicting buffer overrun has been proved. From this experiment transmission status has been clearly stated by four possible states thereby future buffer overruns will be avoided by earlier predictions. The future work is, predicting the buffer overflow with the different protocol possibly with the more number of states to monitor the transmission of signal to give the better result.
7.
ACKNOWLEDGMENTS
We would like to thank the anonymous reviewers for their thorough reviews, and constructive suggestions which significantly enhance the presentation of the paper
8.
REFERENCES
[1] Xinran Wang, Chi-Chun Pan, Peng Liu, Sencun Zhu, 2010, SigFree: A Signature –Free Buffer Overflow Attack Blocker.
[2] Pincus. J, Baker. B, 2004, Beyond Stack Smashing: Recent Advances in Exploiting Buffer Overruns.
[3] Yi-Tung, F.chan, Galyna, A.Akmayeva, Charles A.Shoniregun, 2010, A novel approach against the stystem buffer overflow.
[4] Xiaolong Li, Yousefi‟zadeh, 2010, Analysis, Simulation and Implementation of VCP:a wireless profiling.
[5] Xing Guowen, Xue Shengiun, 2009, Study on Variable Structure congestion Control Protocol.
[6] Li Xiaolong, Youusefi‟zadeh, Hornayoun, 2007, An Implementation and Experiemental Study of the Variable Congestion Control protocol.
[7] Kundu, a., Bertino, E., 2011, A new class of buffer Overflow Attacks.
[8] Drozd, M.,Barabas, M., Gregr, M., Chmelar, P., 2011, Buffer Overflow Attacks.
[9] An Zhiyuan, Liu Haiyan, 2010, Realization of Buffer Overflow