http://dx.doi.org/10.4236/iim.2015.73014
Comparing Data Mining Techniques in HIV
Testing Prediction
Tesfay Gidey Hailu
School of Interdisciplinary, Department of Statistics, Addis Ababa Science and Technology University, Addis Ababa, Ethiopia
Email: [email protected]
Received 28 February 2015; accepted 25 May 2015; published 28 May 2015
Copyright © 2015 by author and Scientific Research Publishing Inc.
This work is licensed under the Creative Commons Attribution International License (CC BY). http://creativecommons.org/licenses/by/4.0/
Abstract
on the application of data mining techniques in healthcare industry or else in related and similar settings for the future.
Keywords
Data Mining, Comparison, Predictive Modeling, HIV Testing, Ethiopia
1. Background
According to Ministry of Health Report (2006), the adult prevalence of HIV infection in Ethiopia was estimated at 2.1% where most of the burden occurred among the young age group [1]. Although HIV voluntary counseling and testing has been carried out in different places with less cost and a gateway to most HIV related services in-cluding provision of antiretroviral drugs [2] [3], many people (in most sub-Saharan African countries) still do not know their HIV status [4]. Some treatment programmers have also reported that high early mortality in pa-tients receiving antiretroviral therapy because of late HIV testing [5].
Different studies have also demonstrated that early HIV testing is effective in omitting sexual risk behavior in people attending counseling and testing centers, but few studies have specifically looked at young people [6]. Therefore, even lately detection of HIV infection is beneficial for both individuals and society since it is asso-ciated with increased morbidity, mortality, and probability of transmission [7]. By linking prevention and care, HIV testing can help reduce this burden. Through early diagnosis and treatment, HIV testing leads to improved clinical outcomes [8]. It also reduces the risk of transmission since there is growing evidence that compliance with antiretroviral treatment causes individuals to be less infectious [9] and data suggest that many people reduce their sexual risk behavior after testing positive for HIV [10] [11]. Hence, to meet these benefits, it is important to promote HIV testing among adults.
Despite the various efforts made to implement HIV prevention activities [12], HIV testing is a critical issue among adults in Ethiopia though there is a good progress compared to the reports in EDHS 2005. The 2011 EDHS is the second EDHS survey to anonymously link HIV testing results with demographic, socioeconomic, and behavioral characteristics of survey respondents. As a result, the EDHS 2011 has collected huge amount of data on HIV testing services. Therefore, traditional statistical techniques were used to derive some operational information from the data but had limited capacity to discover a novel idea from huge databases. There is huge amount of information within the healthcare systems. Today, the major challenge in healthcare industry is the provision of quality services at affordable costs [13]. In records of hospitals there is a large amount of unana-lyzed data that can be turned into useful information. However, there is a lack of useful analysis tools to realize hidden relationships and trends in data. In this perspective, data mining techniques can be used to automatically infer HIV testing results from descriptions of successfully tested people and can help health professionals to make the HIV testing process more objective and reliable. The main objective of this research is to develop a novel technique to categorize into two categories whether an individual was being tested for HIV or not through data mining techniques.
in-corporation of different data mining algorithms may improve the accuracy of this prediction. The objective of this study hence is to compare the prediction power of the different data mining techniques used to develop the HIV testing prediction model.
Health programs are unable to provide appropriate HIV/AIDS care, treatment, counseling and support to indi-viduals or families without knowing who is infected and knowledge about HIV status is determined only through HIV testing. This implies that identifying the “best predictive model” for HIV testing is critical for the effective utilization of the service which has clinical importance at individual level and public health justifica-tion at societal level. The findings of this research might be helpful for both health programmes and researchers. For the health programmes, the findings of this study may help them to design a special intervention program or improve the existing one. As a result, the population might be benefited if the service is improved or new pro-gram is designed and implemented based on the output of this study. For researchers, the study can contribute on how the application of data mining is helpful in predicting HIV testing and identifies determinants of HIV test-ing through different algorithms. Hence, it can also invite interested researchers to explore more in related and similar areas for the future. Similarly, the benefits of HIV testing can be seen at the individual, community and population levels.
1.1. Over View on Data Mining
Data mining is a process which finds useful patterns from large amount of data. Data mining techniques provide people with new power to research and to manipulate the existing large volume of data. Across a wide variety of fields, data are being collected and accumulated at a dramatic speed. Hence, there is an urgent need for a new generation of computational theories and tools to assist decision makers in extracting useful information (know-ledge) from the rapidly growing volumes of digital data [16]. Now a day data mining technology is widely used in every field (for example, in health, agriculture, education, business, etc.) for extracting hidden knowledge which is crucial for competitive advantage and sustainable growth. In this study, it has been attempted to review and incorporate a range of standards and steps used in data mining methodologies, various concepts, theories and practices of data mining in relation with practical health care problems of HIV testing.
The finding useful patterns in data has been given a variety of names such as data mining, knowledge extrac-tion, information discovery, information harvesting, data archaeology, and data pattern processing [17]. Many people treat data mining as a synonym for another popularly used term Knowledge discovery in database (KDD). Others view data mining as an essential step in the process of KDD. One of the aims of data mining can be seen as the analysis of observational datasets to find unsuspected relationships and to summarize the data in novel ways that are both understandable and useful. This relationships and summaries derived through data mining are often referred to as models or patterns.
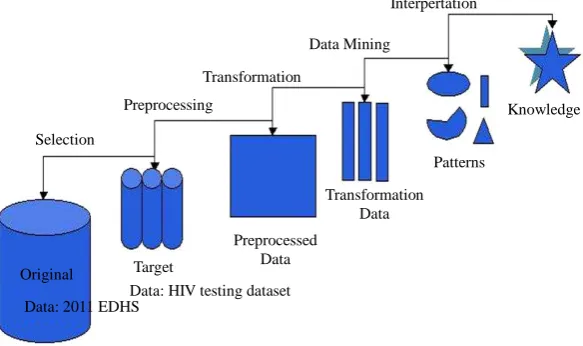
The data mining process basically involves selecting the target data, preprocessing the data, transforming them if necessary, performing data mining to extract patterns and relationships, and then interpreting and as-sessing the discovered structures will be done [18]. There are many achievements of application from data min-ing techniques to various areas such as engineermin-ing, marketmin-ing, financial, medical and so on. In the data minmin-ing literature, various “general frameworks” have been proposed to serve as blueprints for how to organize the process of gathering data, analyzing data, disseminating results, implementing results, and monitoring im-provements.
1.2. Methodologies of Data Mining
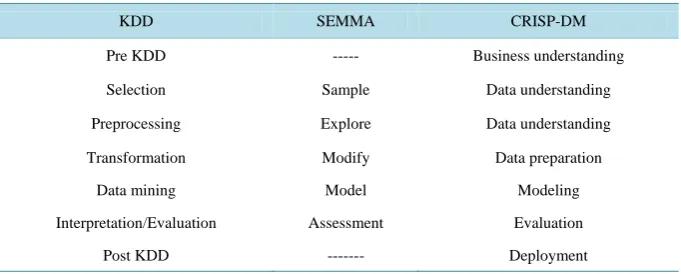
There are three popular methodologies applied in data mining research: KDD (Knowledge Discovery in Data-base), SEMMA (Sample, Explore, Modify, Model, and Assess) and CRISP-DM [16] [19]. CRISP-DM was used for this particular study.
1.3. Knowledge Discovery in Database (KDD)
Data Mining or “the efficient discovery of valuable, on-obvious information from a large collection of data” [20]
comput-er-assisted process of digging through and analyzing enormous sets of data and then extracting the meaning of the data”. Data mining tools predict behaviors and future trends, allowing businesses to make proactive, know-ledge-driven decisions [22]. Hence, different methodologies of data mining research attempt to shape the activi-ties the researcher performs in a typical data mining process [23].
The five basic steps of KDD [18] are presented inFigure 1 below.
Therefore, the KDD process can be defined as the nontrivial process of identifying valid, novel, potentially useful, and ultimately understandable patterns in data [17].
1.3.1. SEMMA
The SEMMA process was developed by the SAS Institute. The acronym SEMMA stands for Sample, Explore, Modify, Model and Assess and refers to the process of conducting a data mining project. The SAS Institute con-siders a cycle with 5 stages for the process. By assessing the results gained from each stage of the SEMMA process, one can determine how to model new questions raised by the previous results, and thus proceed back to the exploration phase for additional refinement of the data.
1.3.2. CRISP-DM
CRISP-DM is a standard process for data mining which is a non-proprietary model. It is an application or indus-try neutral data mining methodology which mainly focuses on business issues as well as technical analysis [24].
CRISP-DM is the most suitable for novice data miners due to the easy to read documentation and intuitive, in-dustry-applications-focused description [21]. It begins from understanding the business and ends with the dep-loyment of the system. The CRISP-DM process was developed by the means of the effort of a consortium in-itially composed with Daimler Chryrler, SPSS and NCR. It consists on a cycle that comprises six stages [23]
(Figure 2).
1.4. Comparisons of the Methodologies
Recently, the researcher efforts have been focused on proposing new models, rather than improving design of a single model or proposing a generic unifying model. Despite the fact that most models have been developed in isolation, a significant progress has been made these days. Most of the models provide generic and appropriate descriptions that are not tied specifically to academic or industrial needs, but rather provide a model that is in-dependent of a particular tool, vendor, or application [24].
It has been summarized the association of the three popular methodologies as seen in Table 1 below and most of the steps to be followed in all methods seem somehow similar [19]. Though KDD and SEMMA do not have a step before selection and sample steps respectively, obviously understanding the domain is often a requirement to perform selection or sampling. All methodologies contain the following set of main tasks in one form or another [23]. Typically, these steps are performed iteratively and not necessarily in the presented linear order.
Interpertation
Knowledge
Patterns Data Mining
Transformation
Preprocessing
Selection
Original
Data: 2011 EDHS Target
Transformation Data
Preprocessed Data
[image:4.595.164.456.528.701.2]Data: HIV testing dataset
Business understanding
Data understanding
Data preparation
Modeling
Evaluation Deployment
Data
2011 EDHS: HIV testing dataset
[image:5.595.143.484.376.513.2]Figure 2. The CRISP-DM process model by Refaat, M. (2007) [23].
Table 1.Comparison of KDD, SEMMA and CRISP-DM methodologies.
KDD SEMMA CRISP-DM
Pre KDD --- Business understanding
Selection Sample Data understanding
Preprocessing Explore Data understanding
Transformation Modify Data preparation
Data mining Model Modeling
Interpretation/Evaluation Assessment Evaluation
Post KDD --- Deployment
1.5. Related Works
This section presented a number of researches that demonstrate the application of data mining in health care domain in general and HIV/AIDS control and prevention program in particular are discussed.
1.5.1. Application of Data Mining in Health Care Industry
The generation and collection of various kinds of data relating to clinical practices, clinical trials, patient infor-mation, resource administration, policies and research are involved with in the workflow of health care organi-zations. Traditionally, statistical techniques are used to derive some operational information from the data. However, these huge amounts of data generated by health care transactions are too complex and voluminous to be processed and analyzed by traditional methods. Therefore, a new method, called data mining, provides the opportunity to derive, in an exploratory and interactive manner, valuable health care knowledge in terms of as-sociations, sequential patterns, classifications, predictions and symbolic rules. Such inductively-derived health care knowledge can provide strategic insights into the practice delivery of health care [14].
organizations make customer relationship management decisions, physicians identify effective treatments and best practices, and patients receive better and more affordable healthcare services. Thus, physicians are now armed with data mining as a tool for expanding their knowledge base [16].
Data mining provides the methodology and technology to transform these mass of data into useful informa-tion for decision making [14]. In addition, the availability of huge amounts of medical data leads to the need for powerful data analysis tools to extract useful knowledge. Researchers have long been concerned with applying statistical and data mining tools to improve data analysis on large data sets. Disease diagnosis is one of the ap-plications where data mining tools are providing successful results. Several researchers are using statistical and data mining tools to help health care professionals in the diagnosis of heart disease [22] [25].
1.5.2. Application of Data Mining in HIV Testing
Since the development of the neural networks (NNs), they have received considerable attention and have been applied to a variety of problems in classification and prediction. NNs have been applied successfully for devel-opment of nonparametric statistical models and more reliable outcome research has been explored in the area of pattern classification and pattern prediction [25].
Neural networks are known to be able to identify relationships even when some of the input data are very complex, ill-defined and ill-structured. One of the advantages of an NN is that it can discriminate linearly inse-parable data. Recent study on neural networks made a substantial contribution to the HIV/AIDS care and pre-vention planning area by comparing the impact of various NN methodologies on the classification of HIV/ AIDS-related persons [26]. Artificial neural networks (ANNs) also have been used to classify and predict an in-dividual tested for HIV [26].
A study conducted by Brain et al. showed that Neural networks were used as pattern recognition tools in data mining to classify HIV status of individuals based on demographic and socio-economic characteristics [27]. The data under that study consists of seroprevalence survey information and contains variables such as age, educa-tion, locaeduca-tion, race, parity and gravidity. The radial basis function (RBF) neural network architecture was used for that study since as preliminary design showed this architecture was the most optimal. Moreover, the Baye-sian method of training used was approximated with the evidence framework. The design of classifiers involves the assessment of classification performance, and an accuracy of 84.24% was obtained in that design. This im-plies that the HIV status of an individual can be predicted using demographic data with 84.24% accuracy [27].
A study was conducted using the application of data mining technology to identify determinants of HIV in-fection and has noticed a new insight about risk feeling of the clients and HIV testing. According to the re-searcher previously it’s known that the clients whose reason for testing is plan for future are associated with HIV-negative class. This truth has also been verified with experiment too. However, the experiment discloses that people whose reason for testing is having risk, suspect or symptoms is also associated to HIV-negative re-sult with promising evidence [28]. This could imply that an individual who has risky perception of oneself has a better chance to be tested for HIV.
A study was also performed to investigate the applicability of data mining on utilization of HIV testing the case of CDC [29]. CRISP-DM methodology was employed to develop a model and it has also used clustering and classification data mining techniques. K-means and Expectation maximization (EM) algorithms of cluster-ing techniques are used to define group of similar VCT client and to see how these grouped affect the classifica-tion outcome. From the two clustering algorithms EM is selected and the cluster indices created using this algo-rithm is then used as class for the classification purpose. The study were used decision tree (J48), random tree and multi-layer perception classifiers to predict the level of risks of clients as high risk or low risk based on the clustered indices [30]. The performance of the model indicated that decision tree had shown better performance and appropriate to the domain. This is due to the fact that decision tree algorithm has a simple feature which can be easily understood by non-technical staff. Above all the researcher recommended further research using large dataset and other data mining techniques to boost the performance of the model [30].
same research problem with other data mining techniques by increasing the number of dataset, number of va-riables could provide better performance.
Despite the numerous applications of ANNs to classification in medicine, very little attention has been made to the HIV/AIDS prevention and planning [32]. ANNs have been used to classify and predict the symptomatic status of HIV/AIDS patients using data from a publicly available AIDS Cost and Services Utilization Survey performed in the USA multilayer perceptron with 15 linear inputs and 3 hidden logistic nodes and one output was trained using 200 epochs with a learning rate of 0.1 and momentum of 0.1. 1026 cases were used for train-ing and 667 HIV cases were used for testtrain-ing. The inputs are: sex, race, exposure rate (homosexual, IV drug user, heterosexual), medical records (total number of patient admission, total number of inpatient nights, total number of ambulatory visits, total number of emergency room visits, total number of hospital clinic visits, total number of private physician visits). The best accuracy obtained was 88% [32].
Another study was also performed to predict the functional health status of HIV/AIDS patients and a binary outcome defined as well or not well, using neural networks [33]. The study was used medical care access, such as number of emergency room visits and inpatient nights as inputs. Most other applications of neural networks in HIV/AIDS research are in bioinformatics pertaining to modeling of the virus on a molecular level, such as the prediction of HIV-1 Protease Cleavage Sites [33].
Moreover, with the amount of data doubling every three years, data mining is becoming an increasingly im-portant tool to transform these data into information. It is commonly used in a wide range of profiling practices, such as marketing, surveillance, fraud detection, medical and scientific discovery [34]. Although humans have been manually extracting patterns from data for centuries, the increasing volume of data in modern times has called for more automated approaches.
As data sets have grown in size and complexity, direct hands-on data analysis has increasingly been aug-mented with indirect, automatic data processing. This has been aided by other discoveries in computer science, such as neural networks, clustering, genetic algorithms (1950s), decision trees (1960s) and support vector ma-chines (1980s). Data mining is the process of applying these methods to data with the intention of uncovering hidden patterns. A common task in medicine is thus classification using predictive models. It is therefore apply-ing data minapply-ing techniques on predictapply-ing whether an individual is beapply-ing tested for HIV may provide a promisapply-ing result.
2. Methods
2.1. Data Mining Approach
In this study, Cross Industry standard process for data mining (CRISP-DM) methodology was used on HIV testing dataset to explore the application of data mining. CRISP-DM is preferred to knowledge discovery in da-tabase (KDD) and SEMMA because it has additional features on understanding the business perspective and its deployment.
CRISP-DM is a standard process for data mining which is a non-proprietary model. It is an application or in-dustry neutral data mining methodology mainly focuses on business issues as well as technical analysis [32]. CRISP-DM is the most suitable for novice data miners due to the easy to read documentation and intuitive, in-dustry-applications-focused description [33]. It begins from understanding the business and ends with the dep-loyment of the system. The CRISP-DM process was developed by the means of the effort of a consortium in-itially composed with Daimler Chryrler, SPSS and NCR. It consists on a cycle that comprises six stages (Figure 2).
2.1.1. Business Understanding
Moreover, the success of the first phase of the Millennium AIDS Campaign (MAC I) Ethiopia demonstrated the potential to provide extensive counseling and testing services throughout the country. And the government effort is to scale up the numbers of sites and people tested, using existing and new cadres of community counse-lors, who both counsel and conduct testing. After understanding the gap on HIV testing utilization, the research problem of this study was formulated. The business objectives of the Ethiopian government on HIV testing ser-vices were identified and tried to map to data mining problem. Therefore, a number of well-known data mining algorithms have been used to predict whether an individual is being tested or not for HIV.
2.1.2. Data Understanding
At this phase, attributes are selected for data mining purpose and have been familiar with the nature of the data, data quality problems are identified, first insights into the data is performed or interesting subsets is detected to form hypotheses for hidden information. The basic tasks before data mining such as data cleaning, attribute se-lection and transformation are performed.
2.1.3. Data Preparation
A final target data set especially on HIV testing with “17 attributes” and 30,625 instances/records have been constructed from the initial raw data basically from the 2011 EDHS.
2.1.4. Modeling
Various modeling techniques of classification are applied and their parameters have been calibrated to optimal values.
2.1.5. Evaluation
At this stage the model (or models) obtained have been thoroughly evaluated based on their accuracy and the steps executed to construct the model have been reviewed to be certain if properly achieves the business objectives.
2.1.6. Deployment
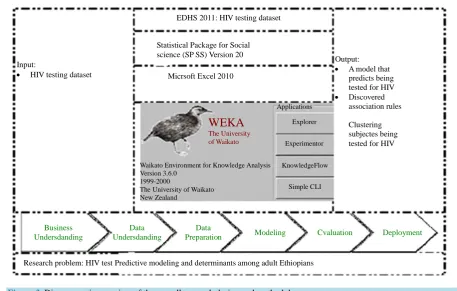
The final report of this study will be reviewed and deployed to the concerned body. The life cycle of a data mining project consists of six phases, as shown inFigure 2. The sequence of the phases is not rigid. Moving back and forth between different phases is always required [23]. In addition, data mining tools, techniques and expertise in WEKA 3.7.7 are used as means to address the stated research problem. Other intermediate data processing tools such as SPSS version 20 and Microsoft Excel 2010 were used to transfer and preprocess the data. In order to come up with reliable and stable model standard logical steps like in CRISP-DM has also been followed. The research design is represented diagrammatically as shown inFigure 3 below.
3. Methods of Data Understanding and Data Preparation
3.1. Study Area
This study was conducted in Ethiopia.
3.2. Data Source
This study was based on data from the 2011 EDHS, the most recent national dataset on HIV testing that is available (as of January 2012). The 2011 EDHS included a nationally representative sample of women (aged 15 - 49 years old) and men (aged 15 - 59 years old) from all eleven administrative regions in the country. The 2011 Ethiopia Demographic and Health Survey (EDHS) were conducted by the Central Statistical Agency (CSA) un-der the auspices of the Ministry of Health. The Ethiopian Health and Nutrition Research Institute (EHNRI) were responsible for the testing of HIV from the dried blood samples (DBS). This is the third Demographic and Health Survey (DHS) conducted in Ethiopia, under the worldwide MEASURE DHS project, a USAID-funded project providing support and technical assistance in the implementation of population and health surveys in countries worldwide. The three EDHS surveys have been conducted at five-year intervals since 2000, and the 2011 EDHS is the second survey presenting results on HIV and anemia prevalence.
EDHS 2011: HIV testing dataset
Micrsoft Excel 2010 Statistical Package for Social science (SP SS) Version 20
Research problem: HIV test Predictive modeling and determinants among adult Ethiopians Input:
• HIV testing dataset
Output:
• A model that predicts being tested for HIV
• Discovered association rules
Clustering subjectes being tested for HIV
Deployment Cvaluation
Modeling Data
Preparation Data
Undersdanding Business
Undersdanding
Applications
Explorer
Experimentor
KnowledgeFlow
Simple CLI Waikato Environment for Knowledge Analysis
Version 3.6.0 1999-2000
The University of Waikato New Zealand
[image:9.595.79.537.79.370.2]WEKA
The University of WaikatoFigure 3.Diagrammatic overview of the overall research design and methodology.
on family planning, fertility levels and determinants, fertility preferences, infant, child, adult and maternal mor-tality, maternal and child health, nutrition, women’s empowerment, and knowledge of HIV/AIDS were provided for the nine regional states and two city administrations. In addition, this report also provides data by urban and rural residence at the country level. In line with this, this study used the 2011 EDHS as a source of data espe-cially on HIV testing (ever been tested for HIIV) to predict whether an individual was being tested for HIV among adults in Ethiopia using data mining technology. The 2011 EDHS dataset consists two important datasets which are relevant for this particular study. Generally, there are 3807 attributes/variables and 16,515 instances/ records for women, 547 attribute and 14,110 instances for men.
3.3. Attribute Selection
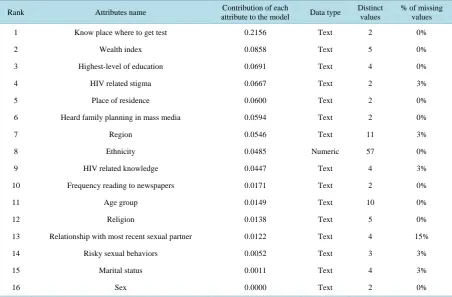
The importance of selecting relevant variables (attributes) in any data mining task, as it has been noted that the abundance of potential features constituted a serious obstacle to the efficiency of most learning algorithms [35]. Popular methods such as k-nearest neighbor, C4.5, and back propagation are slowed down by the presence of many features, especially if most of these features are redundant and irrelevant to the learning task. The authors further stated that some algorithms might be confused by irrelevant or nosily attributes and construct poor clas-sifiers. Therefore, eliminating some attributes, which are assumed to be irrelevant to build the model, can in-crease the accuracy of the classifier, save the computational time, and simplify results obtained.
Table 2. List of possible attributes for predicting the model and the dependent variable (being tested for HIV).
Rank Attributes name Contribution of each
attribute to the model Data type
Distinct values
% of missing values
1 Know place where to get test 0.2156 Text 2 0%
2 Wealth index 0.0858 Text 5 0%
3 Highest-level of education 0.0691 Text 4 0%
4 HIV related stigma 0.0667 Text 2 3%
5 Place of residence 0.0600 Text 2 0%
6 Heard family planning in mass media 0.0594 Text 2 0%
7 Region 0.0546 Text 11 3%
8 Ethnicity 0.0485 Numeric 57 0%
9 HIV related knowledge 0.0447 Text 4 3%
10 Frequency reading to newspapers 0.0171 Text 2 0%
11 Age group 0.0149 Text 10 0%
12 Religion 0.0138 Text 5 0%
13 Relationship with most recent sexual partner 0.0122 Text 4 15%
14 Risky sexual behaviors 0.0052 Text 3 3%
15 Marital status 0.0011 Text 4 3%
16 Sex 0.0000 Text 2 0%
N.B: The attributes/variables are ranked based on their information gain to the model [from high (1) to low (16)].
3.4. Data Cleaning
Data cleaning is a process which fills in missing values, removes noise and corrects data inconsistency. Usually, real world database contains incomplete, noisy and inconsistent data and such unclean data may cause confusion for the data mining process [33]. As a result, in order to improve the quality of data and performance of the model (accuracy and efficiency) data cleaning has become a must. This technique involves removing the records that had incomplete, noise (invalid) data and filling missing values under each column. Removing of such records was done as the records with this nature were few and their removal did not affect the entire dataset.
3.5. Missing Value Handling
Missing values refer to the values for one or more attributes in a data that do not exist. Data are rarely complete in real world application. When the dataset is small or the number of missing fields is large, not all records with a missing field can be deleted from the sample. Moreover, the fact that a value is missing may be significant it-self. A widely applied approach is used to calculate a substitute value for missing fields, for example, the me-dian or mean of a variable [36]. Accordingly, the investigator has analyzed the HIV testing dataset and identified missing values and took measures to solve the problem of missing. The missing values for numeric data type and normally distributed data were substituted by the mean of the variable. For the categorical variable, the missing values were replaced by the modal value of the variable [36].
Thus, the dataset has been cleaned and prepared in such ways that are suitable for data mining tools.
3.6. Data Transformation and Reduction
Data mining often requires data integration or the merging of data from multiple data sources [34]. The dataset for this study which were used for the subsequent predictive model building are prepared and derived from one source, HIV testing from EDHS 2011.However, the datasets for men and women were prepared separately hence these databases have been integrated into one database. In data transformation, the collected data were transformed into forms which are appropriate for data mining tools. The process of data transformation included attribute construction, where new attributes were constructed and added from the given set of attribute to help the mining process [37].
In order to make the analysis procedures manageable and cost- effective the data needed to be reduced. Data reduction techniques include data discretization which is one of data transformation methods used to reduce the number of values for a given continuous attribute by dividing the range of the attribute into intervals [36] [37]. In this research some attributes were discretized to reduce the unlike values of the attribute to obtain knowledge (pattern) and to make the dataset suitable for data mining tools.
Accordingly, HIV/AIDS-related knowledge index was built from the answers to eight questions (Table 3): three questions on knowledge of HIV prevention and five on misconceptions about modes of HIV transmission.
Table 3. Distribution of attributes for HIV related knowledge, Ethiopia, 2013.
S. no Attributes name Category n %
1 Know place where to get test
Yes 23,598 77.05
No 7,027 22.95
2 Using Condom during Sex
Yes 21,040 68.70
No 4,960 16.20
Don’t know 4,625 15.10
3 Don’t have sex at all?
Yes 24,116 78.75
No 4,714 15.39
Don’t know 1,795 5.86
4 Do you have one sex Partner only?
Yes 20,420 66.68
No 6,836 22.32
Don’t know 3,369 11.00
5 Can get HIV by sharing food with AIDS person
Yes 3,856 12.59
No 25,170 82.19
Don’t know 1,599 5.22
6 Healthy looking Person can have HIV
Yes 21,495 70.19
No 5,831 19.04
Don’t know 3,299 10.77
7 Can get HIV by super natural?
Yes 6,325 20.65
No 22,454 73.32
Don’t know 1,846 6.03
8 Can get HIV from mosquito?
Yes 7,589 24.78
No 17,962 58.6
It was categorized as low (score ≤ 4), high (score 5 - 6), or comprehensive (score >= 7) knowledge. In order to assess their risky sexual behaviour, the study used five questions related to their sexual behaviours and catego-rized as “No risk” (score 0), “Some risk” (score 1) and “High risk” (score ≥ 2) (Table 4). Five questions that re-flected negative attitudes towards to people living with HIV/AIDS were used to create a stigma index. This in-dex was categorized as “No stigma” (score 5), “Low stigma” (score 4), “Moderate stigma” (score 2 - 3), and “High stigma” (score ≤ 1) and the indexes were annexed (Table 5). A chi-square test was used to test the statis-tical association of knowledge, stigma, and risky sexual behaviors related attributes with ever being tested for HIV (Table 6).
In addition, multiple distinct values of some attributes such as “age”, “ethnicity” and “type of earning” are discretized with explicit data grouping technique. That means detailed concepts were grouped into the required level of more general concept. Almost all the selected attributes have been transformed from their original state in such a way that could be easily understandable and interpretable.
An attribute religion had six distinct values (Orthodox, Traditional, Protestant, Catholic, Muslim, and others) and later transformed into three distinct values as Christian (Orthodox, Protestant and Catholic), Muslim and others. In addition to that, ethnicity was originally with 57 distinct values but it has been converted into ten dis-tinct categories as: Tigrean, Affar, Amara, Gurage, Somalie, Sidama, Nuwer, Welaiyta, Oromo and others. The percentage of HIV test class data size consists about 57.86% was not tested and 42.14% tested for HIV. This class size was considered to be unbalanced data which might be a bias to evaluate the classifier method. This in-dicates that there is a need to balance these two classes hence an equal amount of both HIV tested and not tested was taken randomly using WEKA 3.7.7 pre-processing option.
3.7. Data Mining Tasks
[image:12.595.96.539.410.718.2]Data mining functionalities were used to specify the kind of patterns to be found in data. Accordingly, both data mining tasks (descriptive and predictive) were employed. Descriptive mining tasks used to characterize the general properties of the data in the database [17]. Basically, the goal of descriptive data mining is to gain an understanding
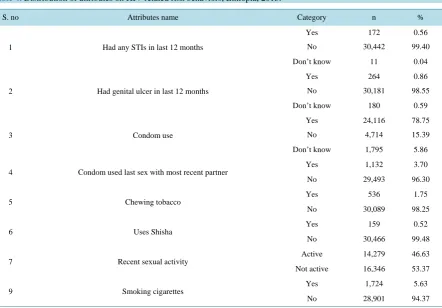
Table 4.Distribution of attributes on HIV related risk behaviors, Ethiopia, 2013.
S. no Attributes name Category n %
1 Had any STIs in last 12 months
Yes 172 0.56
No 30,442 99.40
Don’t know 11 0.04
2 Had genital ulcer in last 12 months
Yes 264 0.86
No 30,181 98.55
Don’t know 180 0.59
3 Condom use
Yes 24,116 78.75
No 4,714 15.39
Don’t know 1,795 5.86
4 Condom used last sex with most recent partner
Yes 1,132 3.70
No 29,493 96.30
5 Chewing tobacco
Yes 536 1.75
No 30,089 98.25
6 Uses Shisha Yes 159 0.52
No 30,466 99.48
7 Recent sexual activity
Active 14,279 46.63
Not active 16,346 53.37
9 Smoking cigarettes
Yes 1,724 5.63
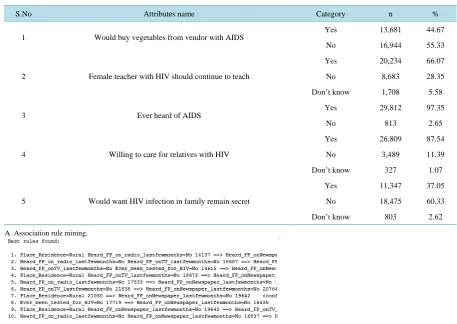
Table 5.Distribution of attributes for HIV related stigma indicator.
S.No Attributes name Category n %
1 Would buy vegetables from vendor with AIDS
Yes 13,681 44.67
No 16,944 55.33
2 Female teacher with HIV should continue to teach
Yes 20,234 66.07
No 8,683 28.35
Don’t know 1,708 5.58
3 Ever heard of AIDS
Yes 29,812 97.35
No 813 2.65
4 Willing to care for relatives with HIV
Yes 26,809 87.54
No 3,489 11.39
Don’t know 327 1.07
5 Would want HIV infection in family remain secret
Yes 11,347 37.05
No 18,475 60.33
Don’t know 803 2.62
A. Association rule mining.
Table 6.Statistical association of knowledge, stigma, and risky sexual behaviours related attributes with ever being tested for HIV using chi- square, Ethiopia, 2013.
S. No Attributes name Category Ever been tested for HIV P-value
Yes No
1 HIV related knowledge
Low 1,010 3,951
0.000
High 3,611 6,320
Comprehensive 8,285 7,448
2 HIV related stigma
No stigma 4,758 2,985
0.000
Low 4,438 4,545
Moderate 3,543 9,428
High 167 761
3 Risky sexual behaviour
No risk 5,273 6,513
0.000
Some risk 6,835 9,291
High 798 1,915
4 Heard family planning on mass media Yes 8,591 6,686 0.000
No 4,315 11,033
[image:13.595.101.538.454.655.2]of the analyzed system by discovering patterns and relationships in large datasets [37]. Predictive mining tasks, on the other hand, perform inference on the current data in order to make predictions [35]. Classification is the commonly used data mining technique for prediction, whereas association and clustering are considered as the descriptive data mining techniques [37].
3.8. Classification
It is learning function that maps (classifies) a data item into one of several predefined classes [19]. Basically classification involves dividing up objects so that each is assigned to one of a number of mutually exhaustive and exclusive categories of classes. The term ‘mutually exhaustive and exclusive’ implies that each object must be assigned to precisely one class. For instance, a hospital system may want to classify people into those who are tested or not tested for HIV. Therefore, people should be classified as tested or not tested class [19].
3.9. Decision Trees
A decision tree is a tree-like structure, which starts from root attributes, and ends with leaf nodes. Generally a decision tree has several branches consisting of different attributes, the leaf node on each branch representing a class or a kind of class distribution. Decision trees are an approach of representing a sequence of rules that lead to a set or value. As a result, they are used for directed data mining, mainly classification. One of the main re-wards of decision trees is that the model is quite reasonable since it takes the form of explicit rules [38]. The de-cision tree algorithm used in this research is J48 and random tree algorithms, which are an implementation of the C4.5 decision tree learner. This implementation produces decision tree models. Moreover, to extract rules from a decision tree, one rule is created for each path from the root to a leaf node. In order to make decision-tree mod-els more readable, a path to each leaf can be transformed into an IF-THEN classification rules. The “IF” part of the classification rule consist of all tests on the path, where as the “THEN” part is the final classification. Therefore, this study used algorithms of decision trees to classify whether an individual was being tested for HIV or not. The tree is generated according to the information-gain measure, the procedures are briefly as:
a) Calculate:
(
)
( )1 2 2
1
, , , log i
m
p
m i
i
I s s s p
= = −
∑
i i s p S =where pi is the probability that an arbitrary sample belongs to class ci.
b) Calculate the entropy E(Ai), which is the expected information based on the partitioning by attribute Ai:
( )
1 2(
)
1 2 1
, , ,
q
j j mj
i j j mj
j
s s s
E A I s s s
S
=
+ + +
=
∑
(
)
( )1 2 2
1
, , , log ij
m p
j j mj ij
i
I s s s p
=
= −
∑
where ij ij
s p
S
= , and S is the number of samples in subset Sj.
Then the encoding information that would be gained by branching on Ai is:
( ) (
i 1, 2, , m)
( )
iGain A =I s s s −E A
The attribute Ai with the highest information gain is selected as the root node, the branches of the root node is
formed according to different distinctive values of aij, j=1,,q. The tree grows like this until if all the
sam-ples are all of the same class, and then the node becomes a leaf and is labeled with that class.
3.10. Naïve Bayes Classifiers
any other explicit representation of the classifier. Rather, it uses the branch of Mathematics known as probability theory to find the most likely of the possible classifications [38]. Bayes theory is used to calculate a conditional probability P A B C
(
,)
which the probability of A is given the probability of B and C. The conditional proba-bility is also related to the joint probaproba-bility of A and B is given by:(
)
(
( )
,)
, P A B C
P A B C
P B C =
For example, if A is the probability that a person tested for HIV, and B is the person’s age, the P A B C
(
,)
is a number between 0 and 1 describing the chance that the person being tested, taking into account their age, and the model for the test and risk factors (C).3.11. Neural Network
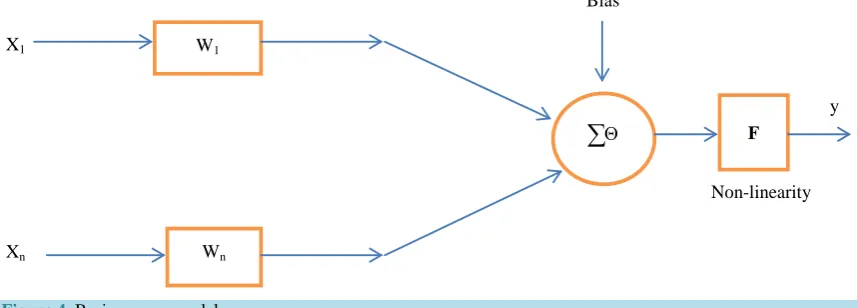
A Neural network may be defined as “a model of reasoning based on the human brain” [39]. It is probably the most common data mining technique, since it is a simple model of neural interconnections in brains, adapted for use on digital computers. It learns from a training set, generalizing patterns inside it for classification and pre-diction. Neural networks can also be applied to undirected data mining and time-series prediction [40]. Neural networks are popularly applied in classification and prediction, as they have advantages such as high tolerance to noise, and the ability to classify unseen patterns. Neural networks are thus used as predictive data models. The basic model of a neuron is illustrated in Figure 4 below.
The transfer function of the neuron is described by the relation:
{
1}
n
i i i i
y =F
∑
= w xwhere X0 = 1. The neuron’s firing condition is: 1 .
n
i i i
i= w x ≥ Θ
∑
Where the index i represent the index of neuron. The most popular nonlinear neurons are sigmoid, logsid and tansig functions. Furthermore, as the human brain consists of millions of neurons that are interconnected by synapses, a neural network is a set of connected in-put/output units in which each connection has a weight associated with it. Hence, in this study, neural networks used 30,625 instances of the HIV testing dataset to train and test by adjusting the weights for each selected attributes that could affect for HIV testing and this enables to build the predictive model for HIV testing. Xiin-dicates inputs for the classifier, W si′ are weights assigned for each input and n is total number of in-puts/attributes.
3.12. Logistic Regression
Logistic regression is an approach to prediction, like Ordinary Least Squares (OLS) regression. However, with logistic regression, the researcher is predicting a dichotomous outcome (being tested for HIV or not). Because the outcome variable is discrete, it cannot modeled directly by linear regression. Therefore, rather than predict-ing point estimates of the event itself, it builds the models to predict the odds of its occurrence. In two class
W1
Wn
Θ
∑
FX1
Xn
y Bias
[image:15.595.98.527.559.713.2]Non-linearity
problem, odds greater than 50% would mean that the case is assigned to the class designated as “1” and “0” oth-erwise. The binary outcome is the probability that being tested for HIV (Y = 1) and not tested (Y = 0).
Because the dependent variable is not a continuous one, the goal of logistic regression is a bit different, be-cause we are predicting the likelihood that Y is equal to 1 (rather than 0) given certain values of X. That is, if X
and Y have a positive linear relationship, the probability that a person will have a score of Y = 1 will increase as values of X increase. So, we are stuck with thinking about predicting probabilities rather than the scores of de-pendent variable.
The proposed logistic regression model is given by:
(
)
0 1 1 2 20 1 1 2 2
e 1
1 e
k k i
k k i
X X X
X X X
P Y
β β β β ε
β β β β ε
+ + + + +
+ + + + +
= = +
where: X’s are the predictors such that: X1 = age-group, X2 = education, X3 = residence, X4 = region, X5 = wealth
index, X6 = ethnicity, X7 = HIV related stigma, X8 = sex, X9 = HIV related knowledge, X10 = Marital status and
other predictors and the dependent variable is Y = being tested for HIV or not. Backward elimination procedure has been used for model development. Finally, 17 attributes were selected to fit the final model.
4. Association Rules
4.1. Apriori Approach
Association rules are one of the major data mining techniques. It is perhaps the most common form of lo-cal-pattern discovery in unsupervised learning systems [41]. Association rules are widely used in data mining to find patterns in data. Therefore, this study used association rules of data mining technique to examine which in-stances of HIV testing frequently occurred in a database and presents the patterns as rules among adults in Ethi-opia.
4.2. Methods of Training and Testing
It has been stated that the classifiers rely on being trained before they can reliably be used on new data [42]. The more instances the classifier is exposed to during the training phase, the more reliable it will be as it has more experience. However, once trained, we would like to test the classifier too, so that we are confident that it works successfully. It has been also stated that, in order to predict the performance of a classifier on new data, we need to assess its error rate on an independent test set that played no part in the formation of the classifier [43]. The standard way of predicting the error rate of a learning technique is to use stratified 10-fold cross-validation. The data is divided randomly into 10 parts in which the class is represented in approximately the same proportions as in the full dataset. Each part is held out in turn and the learning scheme trained on the remaining nine-tenths; then its error rate is calculated on the holdout set. Thus the learning procedure is executed a total of 10 times on different training sets. Finally, the 10 error estimates are averaged to yield an overall error estimate [43]. The WEKA 3.7 tool provides a test options to test on the same set the classifier is trained on (use training set), to test on a user-specified test data (Supplied test set), test on k-fold cross validation, and to train on a percentage of the data and test on the remainder (percentage split). No matter which test option is used, the model that is output is always the one build from all the training data.
Therefore, in this study, 30,625 instances of the HIV testing dataset was used to train the classifiers using the training test option. Similarly, the instances of HIV testing were divided randomly into 10 parts using cross va-lidation test parameter. In addition, the total instances of HIV testing were divided into 66% for training and 34% for testing using percentage split test parameter. Moreover, a user defined dataset were supplied to the supply test parameter in order to train the instances of HIV testing there by to predict whether an individual was being tested for HIV or not. Finally, training test parameter was selected among other testing parameters as it could achieve the best classification accuracy.
4.3. Methods of Analysis and Evaluation of the Model
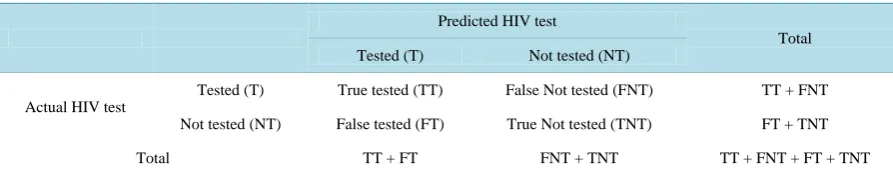
Table 7. Summary of confusion matrix template.
Predicted HIV test
Total Tested (T) Not tested (NT)
Actual HIV test
Tested (T) True tested (TT) False Not tested (FNT) TT + FNT
Not tested (NT) False tested (FT) True Not tested (TNT) FT + TNT
Total TT + FT FNT + TNT TT + FNT + FT + TNT
Notes: TT: The number of HIV tested clients that are classified as tested. FT: The number of HIV not tested clients that are classified as tested. FNT: The number of HIV tested clients that are classified as not tested. TNT: The number of HIV not tested clients that are classified as not tested. TT + FNT: The total number of actually HIV tested clients. FT + TNT: The total number of actually HIV not tested clients. TT + FT: The total number of predicted HIV tested clients. FNT + TNT: The total number of predicted HIV not tested clients. TT + FT + FNT + TNT: The total number of all clients.
The performance of the experiments is measured in terms of the details of the following measurements. These measurements include:
True tested Rate (TTR): The proportion of HIV tested clients that are correctly classified as tested.
TTR=TT TT+FT (1)
False Tested Rate (FTR): The proportion of HIV not tested clients that are erroneously classified as tested. FTR=FT FT+TT (2)
False Not tested Rate (FNTR): The proportion of HIV tested clients that are erroneously classified as not tested.
FNTR= −1 TTR or FNTR=FNT TT+FNT (3)
True Not tested Rate (TNTR): The proportion of HIV not tested clients that are correctly classified as not tested.
TNTR=TNT TNT+TT (4)
Correctly Classified Instances (Accuracy): The proportion of clients that are correctly classified.
(
) (
)
Accuracy= TT+TNT TT+FT+FNT+TNT (5)
Incorrectly Classified Instances (Error Rate): The proportion of clients that are incorrectly classified.
(
) (
)
Error Rate= FT+FNT TT+FT+FNT+TNT (6).
ROC (Receiver Operating Characteristic): ROC curves are a useful tool for comparing classification models
[35]. The performance of the classifiers with different parameters is also compared by examining their ROC curve. They further said that ROC curve shows the trade-off between the TP rate (TT) and the FP rate (FT) for a given model. Moreover, models can be compared with respect to their speed, robustness, scalability, and inter-pretability which may have an influence on the model [36]. In summary, there are three measures for model performance evaluations: accuracy, sensitivity and specificity.
TP TN
Accuracy
TP TN FP FN
+ =
+ + + (7)
TP Sensitivity
TP FN
=
+ (8)
TN Specificity
TN FP
=
+ (9)
4.4. Ethical Considerations
The study used Ethiopian Demographic and Health Survey 2011 dataset. The data were collected over 6-months (November 2010 - April 2011) by the Central Statistical Agency (CSA) under the auspices of the Ministry of Health. The Ethiopian Health and Nutrition Research Institute (EHNRI) was responsible for HIV testing from the dried blood samples (DBS). The researcher has been authorized by MEASURE DHS authority to work on EDHS 2011 of HIV testing dataset. Accordingly, the researcher has got clearance from the ethical clearance committee of the college of health sciences, department of Public Health in Mekelle University. I the investiga-tor have treated the EDHS 2011 as confidential and no effort was made to identify any household or individual respondent interviewed in the survey.
In addition, the data set on HIV testing obtained from EDHS 2011 has not been passed on to other researchers without the written consent of DHS/EDHS. The principal investigator or user of the data is also intended to submit a copy of any reports/publications resulting from using the 2011 EDHS data sets. This report should also be sent to the attention of the EDHS data archive. Moreover, the research is meant for academic purpose and it was not attempted to harm anybody in any way.
5. Results
5.1. Experimentations
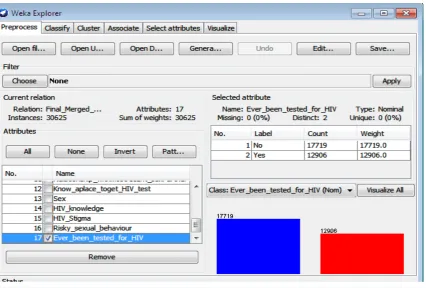
[image:18.595.102.529.424.712.2]The classifiers used 30,625 instances for training. To build HIV test predictive model: decision tree (random tree and J48), Bayes (Naïve Bayes) and functions (logistic regression and artificial neural network) algorithms were used. Five of the experiments were done with varying testing parameters. The performances of the models were evaluated using training test option as it achieved the best accuracy particularly for this study. In all experiments, the 17 selected attributes (socio demographic factors, know place where to get test, HIV related stigma, HIV re-lated knowledge, risky sexual behavior, frequency reading newspaper, heard family planning on mass media) were used. The outcome variable is a binary response which is ever been tested for HIV. List of the attributes used for this study are annexed (Table 2). This study used WEKA 3.7.7 data mining techniques and expertise to address the research problem (Figure 5).
5.2. Classification
In this study the predictive models were evaluated based on the three performance measures (accuracy, sensitiv-ity and specificsensitiv-ity). Using random tree algorithm of the decision tree the accuracy, sensitivsensitiv-ity, and specificsensitiv-ity were found to be 96%, 98% and 94.61% respectively. Whereas, using decision tree of J48 algorithm with train-ing test option provided an accuracy of 79%, a sensitivity of 74% and specificity of 82% were demonstrated. Yet, using ANN model an accuracy of 77.54%, a sensitivity of 76.39% and specificity of 78.22% were identi-fied. This shows that decision tree (random tree algorism) is the best model predictor of the other two (Table 13).
[image:19.595.88.541.247.394.2]In addition, logistic regression has also been fitted in WEKA 3.7.7 and it achieved a classification accuracy of 73.97%, a sensitivity of 67.55%and a specificity of 79.44%. The results for each classifier (decision tree, Naïve Bayes, Artificial neural network and logistic regression) are presented in Tables 8-13 below.
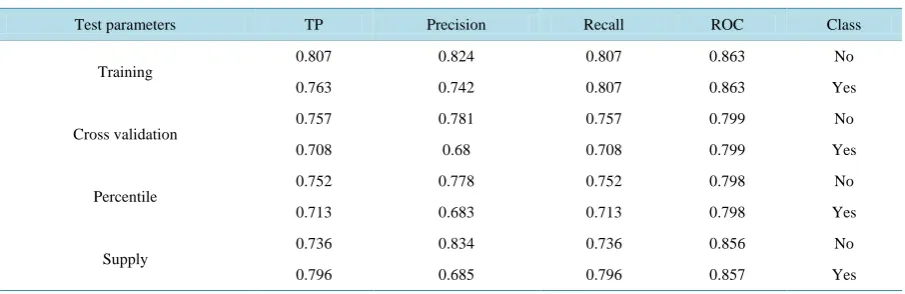
Table 8.Results from decision tree (J48) with different test parameters, Ethiopia, 2013.
Test parameters TP Precision Recall ROC Class
Training
0.807 0.824 0.807 0.863 No
0.763 0.742 0.807 0.863 Yes
Cross validation
0.757 0.781 0.757 0.799 No
0.708 0.68 0.708 0.799 Yes
Percentile
0.752 0.778 0.752 0.798 No
0.713 0.683 0.713 0.798 Yes
Supply 0.736 0.834 0.736 0.856 No
0.796 0.685 0.796 0.857 Yes
Table 9. Results from decision tree (random tree) with different test parameters, Ethiopia, 2013.
Test parameters TP Precision Recall ROC Class
Training
0.987 0.946 0.987 0.997 No
0.923 0.982 0.923 0.997 Yes
Cross validation
0.758 0.719 0.758 0.704 No
0.594 0.641 0.594 0.704 Yes
Percentile
0.747 0.71 0.747 0.694 No
0.593 0.638 0.593 0.694 Yes
Supply
0.819 0.79 0.819 0.874 No
0.698 0.736 0.698 0.874 Yes
Table 10. Results from Naïve Bayes with different test parameters, Ethiopia, 2013.
Test parameters TP Precision Recall ROC Class
Training 0.758 0.755 0.758 0.804 No
0.662 0.665 0.662 0.804 Yes
Cross validation 0.757 0.755 0.757 0.804 No
0.662 0.665 0.662 0.804 Yes
Percentile 0.764 0.748 0.764 0.805 No
0.656 0.676 0.656 0.805 Yes
Supply 0.843 0.741 0.843 0.84 No
[image:19.595.87.539.590.720.2]Table 11. Results from Neural Network (Multilayer Perception) with different test parameters, Ethiopia, 2013.
Test parameters TP Precision Recall ROC Class
Training
0.848 0.782 0.848 0.871 No
0.676 0.764 0.676 0.871 Yes
Cross validation
0.742 0.77 0.742 0.814 No
0.696 0.662 0.696 0.814 Yes
Percentile 0.803 0.718 0.803 0.807 No
0.579 0.688 0.579 0.807 Yes
Supply 0.753 0.801 0.753 0.827 No
[image:20.595.92.539.271.414.2]0.741 0.684 0.741 0.828 Yes
Table 12. Results from logistic regression with different test parameters, Ethiopia, 2013.
Test parameters TP Precision Recall ROC Class
Training
0.743 0.794 0.743 0.832 No
0.736 0.676 0.736 0.832 Yes
Cross validation
0.742 0.793 0.742 0.831 No
0.734 0.675 0.734 0.831 Yes
Percentile 0.75 0.78 0.75 0.826 No
0.719 0.683 0.719 0.826 Yes
Supply 0.749 0.815 0.749 0.846 No
0.765 0.687 0.765 0.846 Yes
Table 13. Comparison of the different classifiers (training test), Ethiopia, 2013.
Classification Technique Class: Ever been tested for HIV Precision Recall ROC Accuracy (%)
Decision tree (J48)
No 0.824 0.807 0.863
78.82%
Yes 0.742 0.807 0.863
Decision tree (Random tree)
No 0.946 0.987 0.997
96.03%
Yes 0.982 0.923 0.997
Naïve Bayes No 0.755 0.758 0.804 71.74%
Yes 0.665 0.662 0.804
Logistic No 0.794 0.743 0.832 73.97%
Yes 0.676 0.736 0.832
Neural network
No 0.782 0.848 0.871
77.54%
Yes 0.764 0.676 0.871
The complete set of results used for comparison of each model performance was prepared in a tabular format (Table 14). The detailed prediction results of the validation datasets for each predictive model using training test option are presented in a form of confusion matrixes. A confusion matrix is a matrix representation of the classi-fication results. In a two-class prediction problem (such as ever been tested for HIV or not ) the upper left cell denotes the number of samples classifies as true while they are truly (i.e., true tested), and lower right cell de-notes the number of samples classified as false while they were actually false (i.e., true false or true not tested).
[image:20.595.94.540.440.613.2]Table 14. Performance summary of different classifiers: using training test option, Ethiopia, 2013.
Testing criteria Decision tree (J48)
Decision tree
(random tree) Naïve Bayes Neural network Logistic regression
Confusion matrix
14296 3423 17497 222 13423 4296 15024 2695 13157 4562
3063 9843 995 11911 4359 8547 4183 8723 3409 9497
Accuracy (%) 78.82 % 96.03 % 71.74% 77.54% 73.97%
Sensitivity (%) 74.19% 98.17% 66.55% 76.39% 67.55%
Specificity (%) 82.35% 94.61% 75.48% 78.22% 79.44%
Area under the ROC (%) 86.3% 99.7 % 80.4% 87.1 % 83.2%
Computation time in seconds 3.94 0.6 0.12 4194 37.73
false not tested), and the upper right cell denotes the number of samples classified as true while they were ac-tually false (i.e., false tested). Once the confusion matrixes were constructed, the accuracy, sensitivity and speci-ficity of each model were calculated using the respective formulas presented in the above.
5.3. The ROC Curve Analysis for the Classifiers
The area under ROC curve for HIV testing instances produced from the decision tree (J48 and random tree), functions (logistic regression and neural network) are annexed (Figures 6-9). The vertical axis (Y-axis) of ROC curve represents the true tested rate. The horizontal axis (X-axis) represents the false-tested rate. The HIV test-ing class value (Yes) gives the ROC accuracy of 86.3%, 99.7%, 83.2% and 87.1% respectively. This indicates given that the attributes as input, the classifiers are better than the random model to predict being an individual is tested or not because all the three classifiers (five algorithms) have a ROC curve values above 50%. The ROC curve analyses for all experiments displayed below showed that the curves moves sharply up from zero showing that there are more true tested than false tested rates. Then the curve starts to become more horizontal as it en-counters less true tested and more false tested rates. The areas under the curve for the models are 86.3%, 99.7%, 83.2% and 87.1% which are closer to 1. Moreover, the decision trees and neural network classifiers look better because they achieved better accuracy than the other classifiers (logistic regression and naïve bayes).
The performances of each classifier to predict the model are presented below (Figure 10). The accuracy for the J48, random tree, Naïve Bayes, logistic and neutral network is 79%, 96%, 72%, 74% and 78% respectively. Moreover, the naïve bayes and logistic regression scored least ROC values than the other classifiers.
5.4. Logistic Regression
The final logistic regression predictive model of data mining technique used to predict whether an individual was being tested for HIV or not is given by here below:
(
)
( )
0 1 2 3 160 1 2 3 16
place for HIV testing WealthIndex EdunLevel Sex place for HIV testing WealthIndex EdunLevel Sex
e 0
1 e
i i i i
i i i i
P y x
β β β β β
β β β β β
∗ ∗
+ + + ∗ ∗
∗ ∗
+ +
+ + + ∗ + + ∗
= = Π = +
For sex, men = 1, women = 0;
(
)
(
)
(
(
)
)
M/W
1 0
1.5447
1 1 1 0
x x
OR
x x
Π = Π =
= =
− Π = − Π =
Women were 36% more likely to have ever been tested for HIV than men while other predictors are holding constant.
For heard about family planning, yes = 1 and no = 0;
(
)
(
)
(
(
)
)
no/yes
1 0
1.4174
1 1 1 0
x x
OR
x x
Π = Π =
= =
− Π = − Π =
Plot (Area under RIOC = 0.8631)
1
0.5
0
[image:22.595.160.474.87.381.2]0 0.5 1
Figure 6. Decision tree (J48). The ROC curve analysis for the classifiers.
Plot (Area under RIOC = 0.9966)
1
0.5
0
0 0.5 1
Figure 7. Decision tree (Randon tree). The ROC curve analysis for the classifiers.
Plot (Area under RIOC = 0.8323)
1
0.5
0
0 0.5 1
Figure 8. Logistic. The ROC curve analysis for the classifiers.
Plot (Area under ROC = 0.871)
1
0.5
0
0 0.5 1
[image:22.595.152.499.87.722.2]Figure 10.Measures of model performance evaluation, Ethiopia, 2013.
been tested for HIV compared to those who didn’t hear about family planning on mass media while other pre-dictors are holding constant. For educational level, Higher = 1 and take all other educational level as a reference category.
(
)
(
)
(
(
)
)
Higher/Other 1 0 0.6541 1 1 0
x x
OR
x x
Π = Π =
= =
− Π = − Π =
Participants who were belonging to higher educational level were 35% more likely to have ever been tested for HIV compared to all other categories of education while other predictors are holding constant. For HIV re-lated stigma, high = 1 and take all other stigma level (no stigma, low and middle) as a reference category.
(
)
(
)
(
(
)
)
high/Other
1 0
1.1578
1 1 1 0
x x
OR
x x
Π = Π =
= =
− Π = − Π =
Participants who have had high stigma towards to people with HIV/AIDS were 16% more likely to have nev-er been tested for HIV compared to all othnev-er stigma while othnev-er predictors are holding constant. For knowing a place where to test for HIV: No = 0, Yes = 1;
(
)
(
)
(
(
)
)
no/yes
1 0
2458.9067
1 1 1 0
x x
OR
x x
Π = Π =
= =
− Π = − Π =
Those participants who didn’t know the place where to get testing for HIV were 2459 times more likely not to have ever been tested for HIV than those who know the place where to test for HIV while other predictors are holding constant. For place of residence, urban = 1, rural = 0;
(
)
(
)
(
(
)
)
urban/rural
1 0
0.8887
1 1 1 0
x x
OR
x x
Π = Π =
= =
− Π = − Π =
The urban residents were 11% more likely to have ever been tested for HIV than rural while other predictors are holding constant. For region, Tigray = 1, all other regions = 0;
(
)
(
)
(
(
)
)
Tigray/Others
1 0
0.6383
1 1 1 0
x x
OR
x x
Π = Π =
= =
− Π = − Π =
Participants from Tigray were 36% more likely to have ever been tested for HIV than other regions in Ethi-opia while other predictors are holding constant.
79.00%
96.00%
71.74% 74.00% 77.54%
0.00% 20.00% 40.00% 60.00% 80.00% 100.00% 120.00% Decision tree
(J48) (Random tree)Decision tree Naïve Bayes regressionLogistic Neural network
Accuray (%) Sensitivity (%) Specificity (%)
(
)
(
)
(
(
)
)
Somali/Other
1 0
2.2961
1 1 1 0
x x
OR
x x
Π = Π =
= =
− Π = − Π =
Participants from other regions of Ethiopia were 56% more likely to have ever been tested for HIV than So-mali region while other predictors are holding constant. For ethnicity, Nuwer = 1, all other ethnicity = 0;
(
)
(
)
(
(
)
)
Nuwer/Others
1 0
1.7554
1 1 1 0
x x
OR
x x
Π = Π =
= =
− Π = − Π =
Participants from other ethnic group in Ethiopia (non-Nuwer) were 43% more likely to have ever been tested for HIV than Nuwer ethnic group of Gambella region while other predictors are holding constant.
In summary, the logistic regression predictive model of data mining technique showed that women were 36% more likely to have ever been tested for HIV than men. Participants from all regions in Ethiopia except for Di-redawa were more likely not to have ever been tested for HIV compared to participants from Tigray. In addition, the urban residents were 12% more likely to have ever been tested for HIV than rural residents.
In this study, the Tigreans and Amara ethnic groups were less likely to have never been tested for HIV com-pared to all ethnic categories in Ethiopia (Afar, Nuwer, Oromo, Somalie, Sidama, Welaiyta, Guragie and others). Moreover, all educational categories were more likely to have ever been tested for HIV compared to the people who belong to no education category.
On the other hand, those who heard about family planning on mass media were more likely to get tested for HIV than those who didn’t hear about family planning. Those participants who had read frequently newspaper were 17% less likely to have never been tested for HIV than those who didn’t read newspaper. Furthermore, those who had HIV related stigma (moderate and high stigma) towards to a person who is infected with HIV were more likely to have never been tested for HIV than those who didn’t have stigma towards to an infected individual.
5.5. Association Rules
Association rule mining was performed using apriori algorithm to discover the relationship of the selected attributes with being tested for HIV. Apriori in WEKA 3.7.7 starts with the upper bound support and incremen-tally decreases support by delta value. In most cases, it is sufficient to focus on a combination of support and confidence to quantitatively measure the quality of the rules. However, the real value of a rule, in terms of use-fulness and action ability is subjective and depends heavily on the particular domain and business objectives. To conduct the association rules for this study, the machine used a minimum support of 95% and with 90% of con-fidence level based on the attributes it took as inputs. The 10 best rules are annexed (A).
The association rule extracted some interesting patterns and it demonstrated that those study participants who have not heard about family planning on mass media (either TV, radio or newspaper) were less likely to have ever been tested for HIV than those who heard about family planning (rules 3, 8). This association rule could demonstrate the direct relationship between family planning and HIV testing.
6. Discussion
This study examines four popular data mining algorithms (Decision tree, Naïve Bayes, Neural network, logistic regression) to build a model that predicts whether an individual being tested for HIV among adults in Ethiopia using EDHS 2011. The results of the experiment performance were evaluated based on their accuracy, sensitiv-ity, specificity and area under the ROC curve. This study used these four different types of predictive models due to their popularity in the recently published literatures [15].