Abnormality Detection in Indian ECG using
Correlation Techniques
Shahanaz Ayub
BIET, Jhansi Jhansi, UP, India
J P Saini
MMEC, Gorakhpur Gorakhpur, UP, India
ABSTRACT
The paper proposes a method based on signal processing correlation technique to find out whether the ECG is normal or abnormal. Many of the abnormal ECGs are called Arrhythmias. ECG (lead II) obtained from conventional ECG machine of Indian patients are digitized and the data are cross-correlated with the reference standard normal ECG data. Two different beats of the same ECG data are also correlated. The correlation parameters are used to identify the ECG as normal or abnormal. The accuracy obtained in this method is 100%. The cross-correlation is done using MATLAB 7.12.0 (R2011a) tools.
General Terms
CorrelationKeywords
Arrhythmia, Cross-correlation, ECG, Lead II
1.
INTRODUCTION
Electrical activity of the heart is called ECG i.e. Electrocardiogram. Few of the abnormal ECGs are called Arrhythmia. Most commonly occurring Arrhythmias are Tachycardia, Asystole, Bigeminy, Ventricular premature beats, Fusion beats etc. ECGs are analysed by the physicians and interpreted depending upon their experience. The interpretation may vary by physician to physician. Heart disease is the most common cause of death in the world and the ECG is the most preliminary test to diagnose the heart related problems [1], [2]. The experience based analysis by physicians gives different interpretations of the same ECG if the morphological disturbance becomes somewhat complex as in case of fusion beats. So there is a need to develop a procedure to analyze the ECG automatically especially in rural areas where the ECG machines are available but experienced physicians who could interpret the ECG properly are not available.
Many methods have been tried to analyze the ECG automatically through software like Neural Networks, Digital Signal Processing, FFTs and Wavelet Transforms. Most of them have used the standard ECG MIT-BIH database. In this paper a method is proposed where the data used is extracted digital data from the ECG strip of Indian patients obtained from any conventional ECG machine. The samples digitized at 3.387 ms (i.e. nearly 295 Hz sampling frequency) are used.
Many works have been done in this area and Artificial Neural Networks give highest accuracy but the drawback of this method is that it requires a huge database to train the networks [1], [2]. Hence in this paper a method is proposed which uses
correlation techniques using MATLAB tools. The ECG beat is taken as a signal. The ECG beat consists of 155 samples, i.e. 54 at left from R peak and 100 samples at right from R peak. So that in a beat, complete information of start of P wave till end of T wave is available.
2.
OBJECTIVE OF THE WORK
The objective of this work in targeted towards the rural community, so that the rural patients could be diagnosed for the heart problems in less time as well as more accurately, so that the physicians have the primary information about the heart disorders and could start a treatment early.
3.
METHODOLOGY
Correlation technique has been used to decide whether the ECG is normal or abnormal. A total of 34 records are analyzed through correlation. A reference ECG signal is chosen to correlate the other 33 ECG signals. The reference ECG taken is of 25 years old Indian male, Jitendra Bahadur Maurya and named as Normal Record 1(NR1).
The first step is to digitize all the ECG paper records and store the digital values. Then for each record 155 samples are taken such that it comprises one ECG beat. 54 samples are taken at left and 100 at right of the R peak sample. For each record samples for 2 beats are taken and stored. 1st beat is first correlated with the beat of reference ECG and then with its 2nd beat. Correlation parameters and correlation percentage are then calculated. The overall method is summarized in figure 1.
3.1
Digital Data Extraction
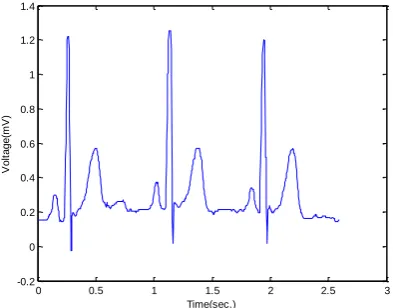
The ECG of Indian patients were taken by BPL 108-T machine which is very commonly used in India. The lead II ECG recorded on ECG paper is scanned at 300dpi using hp Laser Jet 3020 and the images are stored in JPEG format. The desired portion for which digital data is needed is cropped with the help of image tools. Here we select 3 beats for every patient. One ECG beat starts from P wave and ends to the T wave.
Fig. 1 Methodology
Fig. 2 Scanned ECG of record NR1
3.2
Calculation of Correlation Parameters
and Percentage
Cross-correlation
It is used to find out similarity or relationship between the signals x(n) and y(n) delayed by arbitrary delayed factor K. y(n-Κ) is the signal delayed by factor K. n is the number of samples in the sequence [6], [7]. Cross-correlation function for discrete time signals x(n) and y(n-Κ) is given by (1).
Fig. 3 Plot of extracted data of record NR1
If is the cross-correlation function of input at
zero time lag, Κ is the cross-correlation function of
input at Kth time lag, then the normalized cross-correlation function, Κ is given by (2) [6].
Κ
Κ
Range of normalized cross-correlation function is:
Κ
Auto-correlation
It is used to find out similarity or relationship between the signals and signal delayed by arbitrary delayed factor K. Signal delayed by factor K is Κ , N is the number of samples in the sequence [6], [7].Auto-correlation function for discrete time signals and Κ is given by (4).
Κ Κ
If is the auto-correlation function at zero time lag, Κ is the auto-correlation function at Kth time lag, then
the normalized auto-correlation function, Κ is given by
(5) [6].
Κ
Range of normalized auto-correlation function is:
Κ
0 0.5 1 1.5 2 2.5 3
-0.2 0 0.2 0.4 0.6 0.8 1 1.2 1.4
Time(sec.)
V
o
lt
a
g
e
(m
V
)
ECG Strip
Crop the ECG image as ECG beats
ECG digital data extraction using scanner and MATLAB tools
Correlate the digital ECG beat data with reference ECG beat data
Calculate the parameters by a correlation graph
[image:2.595.85.251.87.404.2]Correlation Parameters
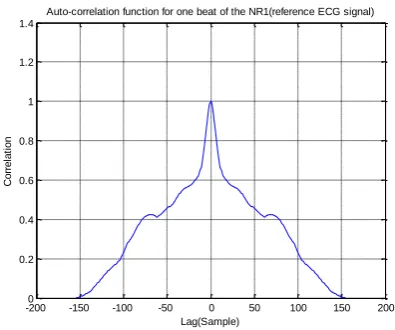
[image:3.595.65.263.151.316.2]When any ECG beat is correlated with the reference ECG beat, a curve is obtained known as correlation curve.
[image:3.595.322.530.240.641.2]Figure 4 shows an Auto-correlation curve for NR1.
Fig. 4 Auto-correlation curve for NR1
Some parameters are calculated from that curve, which support the analysis. The parameters are MNCC, Min1, Max1, k (Min1) and k (Max1). MNCC is defined as the Maximum Normalized Cross Correlation function at zero lag. Min1 is defined as amplitude at the first minima in the positive lag. Max1 is defined as the amplitude at the first maxima in the positive lag. k (Min1) is the delay of side lobe Min1 and k (Max1) is the delay of side lobe Max1 in terms of lags (samples) [7].
Correlation Coefficient
Correlation is the phenomena to established relation between two variables. It may be positive relationship, negative relationship or no relationship. If one variable increases as the other variable increases then a positive relationship is there.If one variable increases as the other variable decreases then it is a negative relationship. Correlation shows relationship between two variables. But it does not show how strong the relationship is. A single number which determine how strong the relationship between two variables or how closely one variable related to other variable we use correlation coefficient [5], [8], [9].
The following mathematical formula is used to compute the correlation coefficient between X and Y, where, X and Y are matrices or vectors of the same size.
Where, and
Coefficient of Determination
To find out the similarity of one variable to other variable in percentage, the square of correlation coefficient i.e. is calculated which is known as coefficient of determination. Correlation percentage is the percentage of coefficient of determination [6].
4.
RESULTS
The test beats and their correlation curves are shown in following figures 5-10. The tables 1, 2 and 3 are the calculation results
.
Fig. 5(a) ECG trace of NR2
Fig. 5(b) Correlation of NR2 with NR1
-2000 -150 -100 -50 0 50 100 150 200
0.2 0.4 0.6 0.8 1 1.2 1.4
Lag(Sample)
C
o
rr
e
la
ti
o
n
Auto-correlation function for one beat of the NR1(reference ECG signal)
0 0.5 1 1.5 2 2.5
-0.4 -0.2 0 0.2 0.4 0.6 0.8 1 1.2 1.4
Time(sec.)
V
o
lt
a
g
e
(m
V
)
-2000 -150 -100 -50 0 50 100 150 200
0.1 0.2 0.3 0.4 0.5 0.6 0.7 0.8 0.9 1
Lag(Sample)
C
o
rr
e
la
ti
o
n
[image:3.595.323.527.245.438.2] [image:3.595.329.534.483.661.2]Fig. 6(a)ECG trace of AR1
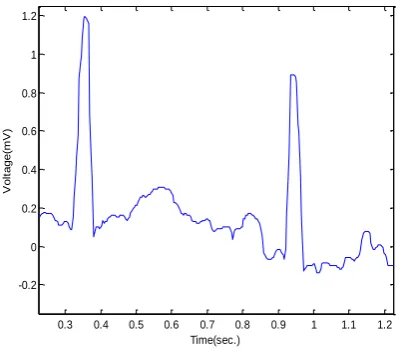
Fig. 7(a) ECG trace of NR2 showing its 1st and 2nd beat
Fig. 8(a) ECG trace of AR2showing its 1st and 2nd beat
Fig. 6(b) Correlation of AR1 with NR1
Fig. 7(b)Correlation of NR2i with NR2ii
Fig. 8(b) Correlation of AR2i with AR2i
0 0.2 0.4 0.6 0.8 1 1.2 1.4 1.6 1.8
0 0.1 0.2 0.3 0.4 0.5 0.6 0.7 0.8 0.9
Time(sec.)
V
o
lt
a
g
e
(m
V
)
0.2 0.4 0.6 0.8 1 1.2 1.4
-0.2 0 0.2 0.4 0.6 0.8 1 1.2 1.4
Time(sec.)
V
o
lt
a
g
e
(m
V
)
0.3 0.4 0.5 0.6 0.7 0.8 0.9 1 1.1 1.2
-0.2 0 0.2 0.4 0.6 0.8 1 1.2
Time(sec.)
V
o
lt
a
g
e
(m
V
)
-2000 -150 -100 -50 0 50 100 150 200
0.1 0.2 0.3 0.4 0.5 0.6 0.7 0.8 0.9
Lag(Sample)
C
o
rr
e
la
ti
o
n
Cross-correlation function for one beat of the AR1 with NR1(reference ECG signal)
-200 -150 -100 -50 0 50 100 150 200
-0.1 0 0.1 0.2 0.3 0.4 0.5 0.6 0.7 0.8 0.9
Lag(Sample)
C
o
rr
e
la
ti
o
n
Cross-correlation function for NR2i(1st beat of the NR2) with its other beat(NR2ii)
-200 -150 -100 -50 0 50 100 150 200
-0.2 -0.1 0 0.1 0.2 0.3 0.4 0.5 0.6 0.7
Lag(Sample)
C
o
rr
e
la
ti
o
n
[image:4.595.331.536.94.294.2] [image:4.595.64.272.101.487.2] [image:4.595.329.532.306.487.2] [image:4.595.329.532.524.706.2] [image:4.595.64.264.532.706.2]Fig. 9(a) ECG trace of AR19 Fig. 9(b) Correlation of NR19 with NR1
Table 1 Correlation Parameters and Correlation Percentage
Record MNCC Min1 k(Min1) Max1 k(Max1) Correlation (%)
NR1 & NR1 1.0 0.411742 61 0.422507 69 100
NR1 & NR2 0.95926 0.560701 16 0.562513 18 84.9232
NR1 & AR1 0.854583 - - 0.869016 2 8.4809
NR2i & NR2ii 0.888635 0.163106 15 0.227305 31 97.2485
AR2i & AR2ii 0.532318 -0.00638 10 0.211268 38 38.0870
NR1 & NR19 0.854398 0.421147 21 0.434765 32 60.0994
5.
INFERENCES
In this paper ECG beat is considered as test cycle. No R-R interval is taken as test cycle as if the heart beat varies i.e. 72bpm or 76bpm; though it is a normal ECG because of different bpms the RR position will vary which will give poor correlation. Hence the test cycle is an ECG beat (54 samples at left of RR peaks and 100 samples at right of peaks) which include start of P wave end of T wave. As seen from the table MNCC is not a parameter which decides the ECG as normal or abnormal as for (NR1 & AR1) case it is 0.854583 which is similar to that of normal ECG. In this study and referring table 2, correlation percentage above 60% indicate the ECG as normal. So correlation percentage is the main criteria to decide whether the ECG is normal or abnormal and after that the other parameter are considered. Because of varying nature of ECG it is difficult to get a symmetric correlation curve though the ECG is normal. Hence Min1 and Max1 are the parameters which are considered to support our study, from the study and referring table 1 negative value or no value of Min1 is an indication of abnormal ECG.
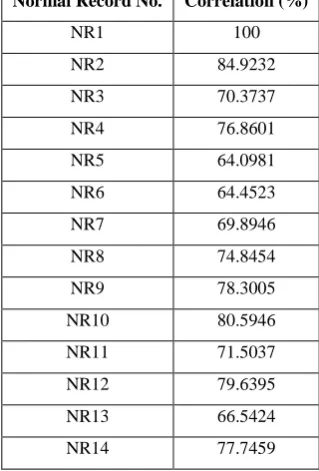
Table 2 Correlation Percentage for normal records
Normal Record No. Correlation (%)
NR1 100
NR2 84.9232
NR3 70.3737
NR4 76.8601
NR5 64.0981
NR6 64.4523
NR7 69.8946
NR8 74.8454
NR9 78.3005
NR10 80.5946
NR11 71.5037
NR12 79.6395
NR13 66.5424
NR14 77.7459
0 0.2 0.4 0.6 0.8 1 1.2 1.4 1.6 1.8 2
-0.2 0 0.2 0.4 0.6 0.8 1 1.2 1.4
time(sec)
V
o
lt
a
g
e
(m
V
)
-2000 -150 -100 -50 0 50 100 150 200
0.1 0.2 0.3 0.4 0.5 0.6 0.7 0.8 0.9
Lag(Sample)
C
o
rr
e
la
ti
o
n
[image:5.595.66.268.81.256.2] [image:5.595.63.537.346.462.2] [image:5.595.348.508.522.758.2]NR15 66.9619
NR16 79.4704
NR17 73.7528
NR18 87.465
NR19 60.0994
NR20 85.1644
NR21 85.7473
NR22 78.2264
NR23 66.5246
NR24 71.6169
NR25 74.0014
NR26 72.1357
NR27 75.7588
NR28 83.87
[image:6.595.87.247.72.315.2]NR29 70.4712
Table 3Correlation Percentage for abnormal records
Abnormal Record No. Correlation (%)
AR1 8.4809
AR2 38.087
AR3 19.7651
AR4 43.8435
AR5 55.3186
6.
CONCLUSION
Based on above study, correlation analysis is the simplest method to find out whether the ECG is normal or abnormal and also it is easy to implement unlike other studies, result are showing 100% accuracy, the study is thus useful in rural area
where physicians are less trained to comment on ECGs.
7.
REFERENCES
[1] Shahanaz Ayub, J. P. Saini, ‘ECG classification and Abnormality Detection using Cascade Forward Neural Network” in International Journal of Engineering, Science & Technology, Vol. 3, No. 3, pp. 41-46, 2011.
[2] Shahanaz Ayub, J. P. Saini, ‘Fusion Beats extraction from ECG using Neural Network based soft computing Techniques’, published in International Journal of Advances in Applied Science Research’, Coden (USA), 1(2), pp 76-83, 2010.
[3] Jalel Chebil, Jamal Al-Nabulsi, Mohammed Al-Maitah, “A Novel Method for Digitizing Standard ECG Papers”, Proceedings of the International Conference on Computer and Communication Engineering, IEEE, pp.1308-1312, 2008.
[4] Sucharita Mitra, M Mitra, “An Automated Data
Extraction System from 12 Lead ECG Images”, Computer Methods and Programs in Biomedicine, (Elsevier Science publication), vol. 71(1), pp 33-38, May 2003.
[5] MATLAB Simulink Help, The MathWorks, Inc.,
MATLAB 7.12.0 (R2011a).
[6] The Radical Statistician: A Beginners Guide to
Unleashing the Power of Applied Statistics in the Real World (5th Ed.) Jim Higgins Publishing. 2006.
[7] Alias Bin Ramli and Putri Aidawati Ahmad “Correlation
Analysis for Abnormal ECG Signal Features Extraction”,
4th National Conference on Telecommunication
Technology Proceedings, Shah Alam, Malaysia, IEEE Proceedings, pp. 232-237, 2003.
[8] Chuang-Chien Chiu, Tong-Hong Lin and Ben-Yi Liau “Using Correlation Coefficient in ECG Waveform for
Arrhythmia Detection”, Biomedical Engineering
Applications, Basis & Communications, Vol. 17 No. 3, pp. 37-42, June 2005.
[9] Feng Zhao, Qingming Huang, Wen Gao, “Image
Matching By Normalized Cross-Correlation”, ICASSP, IEEE Proceedings, pp. 729-732, 2006.