Available online www.jocpr.com
Journal of Chemical and Pharmaceutical Research, 2013, 5(12):327-331
Research Article
CODEN(USA) : JCPRC5
ISSN : 0975-7384
Acoustic radiation force impulse imaging:
Method comparison and two-dimensional imaging
HaoYin
a, DequanGuo
a,b∗∗∗∗, Dong C. Liu
aand CongyaoZhang
aa
School of Computer Science, Sichuan University, No.24 South Section 1, 1st Ring Road, Chengdu, China
b
Control Engineering, Chengdu University of Information Technology, No.24, Block 1, Xuefu Road,
Chengdu, P.R. China
_____________________________________________________________________________________________
ABSTRACT
Mechanical properties of tissue have long been exploited by the physician to diagnose disease by palpation of masses. Generally, lesions are stiffer than their surrounding tissue, which exhibit different characteristic response to acoustic radiation force excitation from the surrounding tissue. The Acoustic Radiation Force Impulse (ARFI) imaging generates images of localized displacements in tissue by using radiation force induced from long pulses with hundreds of cycles. The localized micron-scale displacements are tracked by correlation-based methods. The displacement is then used to explicitly determine the spatial distribution of the mechanical properties of the tissue. Normalized cross correlation has the best performance of time-delay estimation in ultrasonic signals. However, the acquired RF echo data are required to be up-sampled to GHz so as to give micron scale precision between lags. Consequently data processing is computationally expensive and not suitable to real-time application. In this paper, two time-domain methods (Loupas and Phase Zero) and one frequency-domain (Cross Spectrum) method are compared using both simulated echo signals and phantom signals obtained through medical ultrasound system. The 2D phantom imaging is also provided.
Keywords: Acoustic Radiation Force, Ultrasound, Displacement Estimation, Loupas, Phase Zero, Cross Spectrum _____________________________________________________________________________________________
INTRODUCTION
While conventional B-mode ultrasound imaging differentiates features by different acoustic properties, Acoustic Radiation Force Impulse (ARFI) Imaging uses acoustic radiation force to generate images of the mechanical properties of soft tissue. Mechanical properties of tissue have long been exploited by the physician to diagnose disease by palpation of masses. Generally, lesions are stiffer than their surrounding tissue, which exhibit different characteristic response to acoustic radiation force excitation from the surrounding tissue.
Several groups have been investigating the use of acoustic radiation force to qualitatively or quantitatively measure the stiffness of soft tissue in ultrasound. Shear wave Dispersion Ultrasound Vibrometry (SDUV) could create harmonic shear waves by using amplitude modulated wave or two co-focused beams at different frequencies [1, 2]. The ARFI imaging generates images of localized displacements in tissue by using radiation force induced from long pulses with hundreds of cycles [3, 4]. The localized micron-scale displacements generated by radiation force are tracked by correlation-based methods. The displacement is then used to explicitly determine the spatial distribution of the mechanical properties of the tissue. Recently, Doherty gave a complete review in acoustic radiation force elasticity imaging in diagnostic ultrasound [5].
Consequently data processing is computationally expensive and not suit-able to real-time application. In this paper, two time-domain methods (Loupas and Phase Zero) and one frequency-domain (Cross Spectrum) method are compared using both simulated echo signals and phantom signals obtained through medical ultrasound system. The 2D phantom imaging is also provided.
This paper is organized as follows. Section 2 introduces the methods of displacement estimation; Section 3 includes the simulation and results of the methods; Section 4 describes the phantom imaging and results; Section 5 gives a discussion.
EXPERIMENTAL SECTION
Methods of Displacement Estimation
Methods for calculation of axial displacement can use both time domain and frequency domain technology.Loupas et. al. 2D autocorrelation method [7] uses information from both the depth samples withinan axial range and pulse transmission samples within ensemble size. Loupas’s algorithm derives theaxial velocity by calculating the mean Doppler frequency along the ensemble direction and the mean RFfrequency along the axial extent in time domain. In the ARFI imaging, the estimated velocity is the meanvibrating velocity of scatters within an axial gate length, which could be used to derive the displacementby multiplying the pulse repetition frequency Tprf.
(
) (
) (
) (
)
(
) (
) (
) (
)
(
) (
) (
) (
)
(
) (
)
(
) (
)
1 2
1 0 0 1 2
0 0 2 1
1 0 0 2 1
0 0
,
,
1
,
,
1
tan
,
,
1
,
,
1
4
,
1,
,
1,
1 tan
,
1,
,
1,
M N m n M N m n M N c m n M N m n
Q m n I m n
I m n Q m n
I m n I m n
Q m n Q m n
c
u
f
Q m n I m
n
I m n Q m
n
I m n I m
n
Q m n Q m
n
π
− − − = = − − = = − − − = = − − = =
+ −
+
+ +
+
=
+
−
+
+
+
+
+
∑ ∑
∑ ∑
∑ ∑
∑ ∑
f
s/ 2
π
f
c
(1)
where is the mean displacement estimated over an axial gate length M and an ensemble lengthN. The speed of sound is given by c, fc is the center frequency of the RF signal, fs is the sampling frequency, and I andQ are the
in-phase and quadrature component of the demodulated baseband signal. When displacement is calculated, N equals to 2, where the symbol n=0 corresponds to the pre-compression signal, and n=1 the post-compression signal.
Because the cross correlation function has a maximum at the time shift position of corresponding analytic signals, the phase of the correlation function has a root at the same position. So it is called phase zero method [8]. A modified Newton iteration can be used to derive the time shift and displacement as written below:
( )
(
)
(
) (
)
0 0 1 2 1 0 2 * 1 2 0 2arg
,
1
=
arg
/ 2
/ 2
2
n w s n w s jb b n
n n
T kT
j
n b n b n
T kT
s
e
x
x
e
x
t
x
t
dt
c T
u
ω τ ω ττ
τ
τ
ω
τ
τ
τ
ω
τ
− + + − −= +
+
+
−
=
∫
(2)where τis the time shift, n is the index of iteration, is the center angular frequency, Ts is the sampling interval, Twis the window size, k denotes the temporal discrete position, and x1b and x2b are pre-compression and
DequanGuoet al
J. Chem. Pharm. Res., 2013, 5(12):327-331
______________________________________________________________________________
The cross spectrum method [9] is a frequency domain technology to calculate the displacement. If the received RF echo and its frequency spectrum are expressed as s(t) and S(f) respectively, the cross spectrum of the pre-compression (s0) and post-compression (s1) signals can be calculated as:
( ) ( )
( )
2 2 (1 0)*
0 1
j f
S
f S
f
=
S f
e
− π τ τ− (3)where and are the time delays respectively. The change in time delay corresponds to the displacement, which can be estimated from the phase of the cross spectrum.
( )
1 0,
( )
2 2
cf
c
f
u
f
θ
θ
τ τ
π
∆
∆
= −
=
(4)The center frequency fc is estimated by finding the frequency at which the maximum occurs in the cross spectrum.
Simulation
The simulation was carried out by the theoretical formula. The received echo signals of a harmonic motion of scatters can be represented in the form of [10],
( )
(
(
)
)
0
( , )
,
cos
sin
2
cos
f s f s f f f s s s
f
r t t
A t t
t
t
D
c
ω
φ
β
ω
φ
ω
θ
β
=
+
+
+
=
(5)
where is the vibrating angular frequency, and is the center angular frequency of thetransmitted pulse; D0 is
the displacement amplitude,r is the received echo signal, A is the echo amplitude, ∅ is the initial phase of the transmitting ultrasound signal, ∅ is the initial phase of harmonic vibration; tfis the fast time representing depth,
related to the sampling frequency, and ts is the slow time representing repetitive pulses, related to the pulse repetitive
frequency (PRF); θis the angle between the ultrasound beam and the tissue motion direction, which can be always assumed to be 0.
In this simulation, the default parameters include sampling frequency 40 MHz, speed of sound c=1540 m/s, center frequency 5 MHz, vibrating frequency 200 Hz, pulse repetition frequency 4 kHz, cycles of vibration 5, displacement amplitude D0=10 mum, gate length 1 mm, focus depth 3 cm, and initial phase 0. The parameters that are expected to
affect performance of the three methods mentioned above include the displacement amplitude, signal-to-noise ratio
SNR, gate length and center frequency.
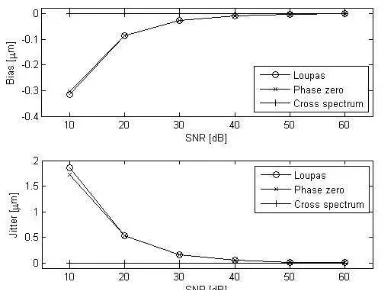
[image:3.595.101.294.571.716.2]Two metrics are used to evaluate the performance of the mentioned methods [11]. The bias is the mean of the error which is calculated as the simulated displacements subtracted from the estimated displacements.The jitter is thestandard deviation of the error. The results are shown below.
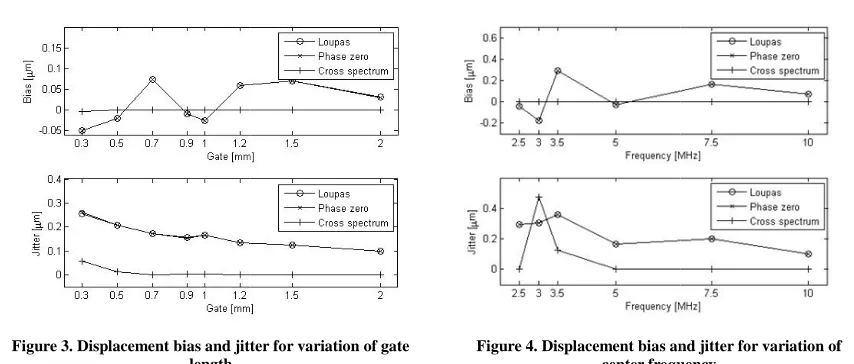
[image:3.595.318.515.573.721.2]Figure 3. Displacement bias and jitter for variation of gate length
Figure 1 shows the displacement bias and jitter while varying gradually close to zero. The performance
SNR conditions. Higher SNR has positive effect to
Figure 2 shows the displacement bias and jitter while varying displacement amplitude. As the displacement amplitude increases the bias of Loupas and Phase zero is, while the jitter does not seem to change significantly performance of Cross spectrum method is still better than Loupas and Phase zero. Larger displacement amplitude has positive effect to methods of displacement estimation.
Figure 3 shows the displacement bias and jitter while varying gate length. As gate length increases
Loupas and Phase zero is a little unstable, while the jitter decreases slowly. Too small or too large value of gate length has negative effect to Loupas and Phase zero method. The value of gate length around 0.9 or 1 mm is suitable to the estimation methods.
Figure 4 shows the displacement bias and jitter while varying center frequency. The change of center frequency has not a definitely positive effect to both bias and jitter.
In all the experiments, the performance of Cross spectrum method is r methods.
Phantom Imaging
The imaging experiment was performed with a medical Inc. and a Model 049 Elasticity QA phantom
basis of C-mode. The operator selects a region of interest (ROI) on the conventional B
determines the field of view in lateral and depth direction. In the ensemble direction, the beam sequence was modified to consist of pushing beams and tracking beams. The first beam was a standard B
cycles, which was used as the reference beam for measuring tissue displacements. The focus depth was 16 mm falling on the center of the smaller sphere with
elasticity coefficient and covered by the ROI so as to give a remarkable response to the radiation force. Then 4 groups of pushing and tracking beams were fired along the same line to induce an
the phantom. The pushing beams were 200 cycles long with lower voltage to avoid potential temperature increase. Finally, 15 tracking beams were fired along the same line to monitor the
force. The pulse repetition frequency (PRF) was 7.2 kHz. The global gain was set to 46% to give a higher
The 2D ARFI images were formed using 21 lateral pushing locations, each with the same focal depth 0.5 mm. The received echoes from
reference beam to calculate the induced displacement by using the 3 estimation algorithms mention ARFI image was generated by displaying the measured tiss
with spatially median filter and lateral interpolation. The result was shown in Figure 5 matched with the corresponding B-mode image by using the Loupas algorithm. The results by the other algorithms
contrast within the region of the smaller sphere is obvious compared with the background, which means that the induced displacements within this area are bigger
Figure 3. Displacement bias and jitter for variation of gate Figure 4. Displacement bias and jitter for variation of center frequency
displacement bias and jitter while varying SNR. As SNR increases both the bias and jitter are performance of Cross spectrum method is better than Loupas and Phase zero in lower has positive effect to methods of displacement estimation.
displacement bias and jitter while varying displacement amplitude. As the displacement amplitude increases the bias of Loupas and Phase zero is, while the jitter does not seem to change significantly
of Cross spectrum method is still better than Loupas and Phase zero. Larger displacement amplitude has positive effect to methods of displacement estimation.
displacement bias and jitter while varying gate length. As gate length increases
Loupas and Phase zero is a little unstable, while the jitter decreases slowly. Too small or too large value of gate length has negative effect to Loupas and Phase zero method. The value of gate length around 0.9 or 1 mm is suitable
displacement bias and jitter while varying center frequency. The change of center frequency has not a definitely positive effect to both bias and jitter.
In all the experiments, the performance of Cross spectrum method is relatively stable, and better than the other two
performed with a medical ultrasound imaging system iMago C21 by Saset (Chengdu) . and a Model 049 Elasticity QA phantom (CIRS Inc., Norfolk, VA). The 2D ARFI images were formed on the
mode. The operator selects a region of interest (ROI) on the conventional B
determines the field of view in lateral and depth direction. In the ensemble direction, the beam sequence was to consist of pushing beams and tracking beams. The first beam was a standard B
cycles, which was used as the reference beam for measuring tissue displacements. The focus depth was 16 mm center of the smaller sphere with diameter 10mm of Type I, which was the sphere with the lowest elasticity coefficient and covered by the ROI so as to give a remarkable response to the radiation force. Then 4 groups of pushing and tracking beams were fired along the same line to induce and monitor the displacement within the phantom. The pushing beams were 200 cycles long with lower voltage to avoid potential temperature increase. Finally, 15 tracking beams were fired along the same line to monitor the response after the cessation of the r
force. The pulse repetition frequency (PRF) was 7.2 kHz. The global gain was set to 46% to give a higher
The 2D ARFI images were formed using 21 lateral pushing locations, each with the same focal depth
oes from the consecutive tracking beams at each lateral position were correlated with the induced displacement by using the 3 estimation algorithms mention
ARFI image was generated by displaying the measured tissue displacements after the cessation of radiation force with spatially median filter and lateral interpolation. The result was shown in Figure 5 matched with the
mode image by using the Loupas algorithm. The results by the other algorithms
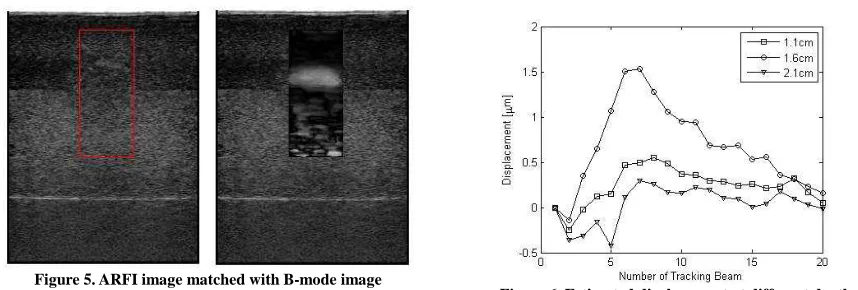
smaller sphere is obvious compared with the background, which means that the induced displacements within this area are bigger because it is much softer than the background.
Figure 4. Displacement bias and jitter for variation of center frequency
increases both the bias and jitter are of Cross spectrum method is better than Loupas and Phase zero in lower
displacement bias and jitter while varying displacement amplitude. As the displacement amplitude increases the bias of Loupas and Phase zero is, while the jitter does not seem to change significantly. The of Cross spectrum method is still better than Loupas and Phase zero. Larger displacement amplitude
displacement bias and jitter while varying gate length. As gate length increases the bias of Loupas and Phase zero is a little unstable, while the jitter decreases slowly. Too small or too large value of gate length has negative effect to Loupas and Phase zero method. The value of gate length around 0.9 or 1 mm is suitable
displacement bias and jitter while varying center frequency. The change of center frequency has
elatively stable, and better than the other two
imaging system iMago C21 by Saset (Chengdu) ARFI images were formed on the mode. The operator selects a region of interest (ROI) on the conventional B-mode image, which determines the field of view in lateral and depth direction. In the ensemble direction, the beam sequence was to consist of pushing beams and tracking beams. The first beam was a standard B-mode pulse, 5 MHz, 2 cycles, which was used as the reference beam for measuring tissue displacements. The focus depth was 16 mm diameter 10mm of Type I, which was the sphere with the lowest elasticity coefficient and covered by the ROI so as to give a remarkable response to the radiation force. Then 4 d monitor the displacement within the phantom. The pushing beams were 200 cycles long with lower voltage to avoid potential temperature increase. after the cessation of the radiation force. The pulse repetition frequency (PRF) was 7.2 kHz. The global gain was set to 46% to give a higher SNR.
The 2D ARFI images were formed using 21 lateral pushing locations, each with the same focal depth separately by consecutive tracking beams at each lateral position were correlated with the induced displacement by using the 3 estimation algorithms mention before. The cessation of radiation force with spatially median filter and lateral interpolation. The result was shown in Figure 5 matched with the mode image by using the Loupas algorithm. The results by the other algorithms were similar. The smaller sphere is obvious compared with the background, which means that the
DequanGuoet al
J. Chem. Pharm. Res., 2013, 5(12):327-331
______________________________________________________________________________
Figure 5. ARFI image matched with B-mode image
Figure 6. Estimated displacement at different depth Along the horizontal central line of the estimated displacements, 3 points at different depth were selectedwith marker as shown on the left side of Figure5. The corresponding estimated displacementprofiles at the consecutive tracking times were depicted in Figure 6. The maximum peak in displacementoccurs at the focus (1.6 cm) after the cessation of acoustic radiation forces. This peak then propagatesaxially away from the focus. The amplitude of peaks at the other two points are much lower.
All the algorithms were implemented by Matlab. The computer used for testing is equipped with an Intel 3.30GHz dual core CPU coupled with 4GB RAM.The computation time were 2.72s, 9.12s and 23.9s for Loupas, Phase zero and Cross spectrum respectively.
DISCUSSION
From the results of simulation and phantom imaging experiment, all of the three algorithms are suitable for detection of the displacement induced by the acoustic radiation force. The SNR and displacement amplitude with larger value have positive effect to the performance of estimation methods. So greater global gain was used to obtain higher SNR, and longer pulses with higher voltage could be used to induce bigger displacement under the limitation of bio-effects and safety. So acoustic output testing is necessary before applying the ARFI imaging system to animals and human beings.
Due to the interpolation in Phase zero method and the Fourier transform in Cross spectrum method, the time consumption of Loupas method is the lowest. If it is programmed in C language and uses parallel computing technology, the performance will be enhanced remarkably for real-time application.
Acknowledgement
This work was supported in part by the Foundation of China and Natural Science Foundation of Sichuan Province (Grant No. 2013GZX0147-3).
REFERENCES
[1] G. Chen, M. Fatemi, and J. F. Greenleaf.J.Acoust. Soc. Am., 2004, 115(6):2781-2785 [2] M. W. Urban, M. Fatemi, and J. F. Greenleaf.J. Acoust.Soc. Am., 2010, 127(3):1228–1238
[3] K. R. Nightingale, AI. L. Palineris, R. W. Nightingale, arid G. E. Traheyl. J. Acoust. Soc. Amer., 2001, 110:625-634
[4] K. Nightingale, Al. Scott Soo, R. Nightingale, and G. Trahey. Ultrasound Med. Bio.,2002, 28:227-235
[5] J.R. Doherty, G.E. Trahey, K.R. Nightingale, and M.L. Palmeri. IEEE Trans. Ultrason., Ferroelect.,Freq. Contr., 2013, 60(4):685-701
[6] F. Viola and W. F. Walker. IEEE Trans. Ultrason., Ferroelect.,Freq. Contr., 2003, 50(4):392-401
[7] T. Loupas, J.T. Powers, and R.W. Gill. IEEE Trans. Ultrason., Ferroelect.,Freq. Contr., 1994, 42(4):672-688 [8] A. Pesavento, C. Perrey, M. Krueger, and H. Ermert. IEEE Trans. Ultrason., Ferroelect.,Freq. Contr.,1999,
46(5):1057-1066
[9] H. Hasegawa and H. Kanai. IEEE Trans. Ultrason., Ferroelect.,Freq. Contr.,2006, 53(1):52-63
[10] Y. Zheng,S.Chen, W. Tan, andJ.F. Greenleaf. Kalman filter motion detection for vibroacoustography using pulse echo ultrasound. In 2003 IEEE International Ultrasonics Symposium. 2003, 1812-1815
[image:5.595.340.524.73.210.2]