Project co-financed by the European Commission Directorate General for Mobility and Transport Road Safety Data, Collection, Transfer and Analysis
Deliverable 0.1
Final Project Report
Please refer to this report as follows:Thomas, P, Muhlrad, N, Hill, J, Yannis, G, Dupont, E, Martensen, H, Hermitte, T, Bos, N (2013) Final Project Report, Deliverable 0.1 of the EC FP7 project DaCoTA.
Grant agreement No TREN / FP7 / TR / 233659 /"DaCoTA" Theme: Sustainable Surface Transport: Collaborative project Project Coordinator:
Professor Pete Thomas, Transport Safety Research Centre, Loughborough Design School, Loughborough University, Ashby Road, Loughborough, LE11 3TU, UK
Project Start date: 01/01/2010 Duration 36 months
Organisation name of lead contractor for this deliverable:
Transport Safety Research Centre, Loughborough University, UK
Report Author(s):
Thomas, P, Hill, J, Morris, AP, Welsh, R, Talbot R, Loughborough University, UK Muhlrad, N, Vallet, G, Ifsttar, France
Yannis, G, Papadimitriou, E, Evgenikos, P, NTUA, Greece Dupont, E, Martensen, H IBSR, Belgium
Hermitte, T, LAB, France
Bos, N, Aarts, L, SWOV, Netherlands
Due date of deliverable 1/3/2013 Submission date: 1/3/2013
Project co-funded by the European Commission within the Seventh Framework Programme Dissemination Level (delete as appropriate)
DaCoTA_Final_Report.docx 2
TABLE OF CONTENTS
Executive Summary ... 3 Recommendations... 9 Acknowledgements ... 11 1. Introduction ... 12 1.1. Background ... 121.2. The European Road Safety Observatory ... 14
1.3. Project aims ... 15
2. Policy-making and Safety Management Processes ... 17
2.1. Objectives ... 17
2.2. Methodologies ... 17
2.3. Main results ... 24
2.4. The research team ... 36
3. Pan-European In-Depth Accident Investigation Network ... 37
3.1. Introduction ... 37
3.2. The Need for In-Depth Data ... 38
3.3. The New Investigation Network ... 41
3.4. The DaCoTA System ... 44
3.5. The Pilot Study & Review ... 50
3.6. Recommendations and Conclusions... 51
3.7. Acknowledgements ... 55
4. Data Warehouse ... 56
4.1. Introduction ... 56
4.2. Data and information assembly ... 57
4.3. Road Safety Analyses and Syntheses ... 61
4.4. Integrated Road Safety Knowledge System ... 63
4.5. Next steps ... 65
5. Decision Support ... 67
5.1. Introduction and Objectives ... 67
5.2. Decision support feedback group ... 67
5.3. Analysis and forecasting ... 69
5.4. Tools for policy support ... 72
5.5. Conclusions ... 79
6. Safety and e-Safety ... 82
6.1. Introduction ... 82
6.2. Assessment methods ... 83
6.3. Technology ... 91
6.4. Data support ... 94
6.5. Conclusion & perspectives ... 97
6.6. References ... 98
7. Driver Behaviour Monitoring through Naturalistic Driving Observations ... 99
7.1. Introduction ... 99
7.2. Relevant Data to be collected ... 100
7.3. Study design ... 105
7.4. Small Scale Naturalistic Driving Pilots ... 117
7.5. ND for monitoring Performance and Exposure: considerations for implementation 118 8. DaCoTA Publications ... 125
8.1. Deliverables ... 125
8.2. Conference Publications ... 128
9. Recommendations for Future Work/Development of ERSO ... 129
9.1. Institutional organisation of ERSO ... 132
9.2. Implementation of routine data functions ... 133
DaCoTA_Final_Report.docx 3
EXECUTIVE SUMMARY
Background and purpose of DaCoTA
The European Road Safety Observatory was established European Commission and first announced in the 2001 Transport White Paper1. It was further developed in the 2003 Road Safety Action Plan 2 where the Commission announced it was to establish a new European Road Safety Observatory (ERSO) to "co-ordinate all Community activities in the fields of road accident and injury data collection and analysis". The framework of ERSO was established within the EU FP 6 funded project SafetyNet (2004 – 2008) which developed and validated standard protocols for core data and knowledge tools. At the completion of the project the data and knowledge developed by SafetyNet ERSO had been incorporated within the website of DG-MOVE. The DaCoTA project has been established with the support of DG-MOVE to further develop the content of the Observatory with additional data types and output tools. There are six areas of work which are summarised below.
Policy-making and safety management processes
Road safety management is the process by which road safety policies are generated, implemented and monitored. They include institutional actions, implementation of measures and monitoring of intermediate and final outcomes. The institutional structures involved include national and local government, infrastructure operators, vehicle regulators, traffic enforcement, training agencies and other stakeholders. There is a variation in approach across the EU 27 yet there is little information that characterises the key aspects of the approach not quantitative information linking these characteristics to road safety outcomes. The DaCoTA team has systematically gathered information from a selection of 14 EU Member States using a specially designed questionnaire based on a model of road safety. Analysis of the results showed that there was no one single “good practise” model of road safety management that could be related to road safety outcomes. It was considered this was a result of the similarities between the countries evaluated and the comparison of the “snapshot” of the census and the decade of casualty reduction totals. It was however
possible to identify a relationship between certain characteristics of road safety management and road safety performance indicators – the operational conditions of road safety. This is in accordance with the Sunflower model that assumes the policy context and input will first affect intermediate outcomes.
The evidence base is a key factor in ERSO and for road safety policymaking and the DaCoTA team also reviewed the data needs of key stakeholder groups. A web-based questionnaire was completed by over 500 road safety stakeholders who were asked to identify the nature and availability of the most important types of safety data. The highest priority data needs were:-
1. Information on crash causation factors (high priority for 67% of respondents) 2. Information on road users' behaviour and attitudes (63%),
3. A common definition of a fatality (60%),
4. Information on the costs and benefits of road safety measures (56%) 5. Serious injury counts, in addition to fatality counts (55%),
1
European Commission 2001, European transport policy for 2010: time to decide COM(2001) 370 final. Brussels, 12.9.2001
2
European Commission 2003. European Road Safety Action Programme: Halving the number of road accident victims in the European Union by 2010: A shared responsibility. COM (2003) 311 final. Brussels, 2.6.2003
DaCoTA_Final_Report.docx 4 6. Methods to evaluate the safety impacts of road safety measures (54%) 7. Information on the safety impacts of combined measures (54%),
8. Common methods to perform evaluations of road safety measures (52%) Pan-European in-depth accident investigation network
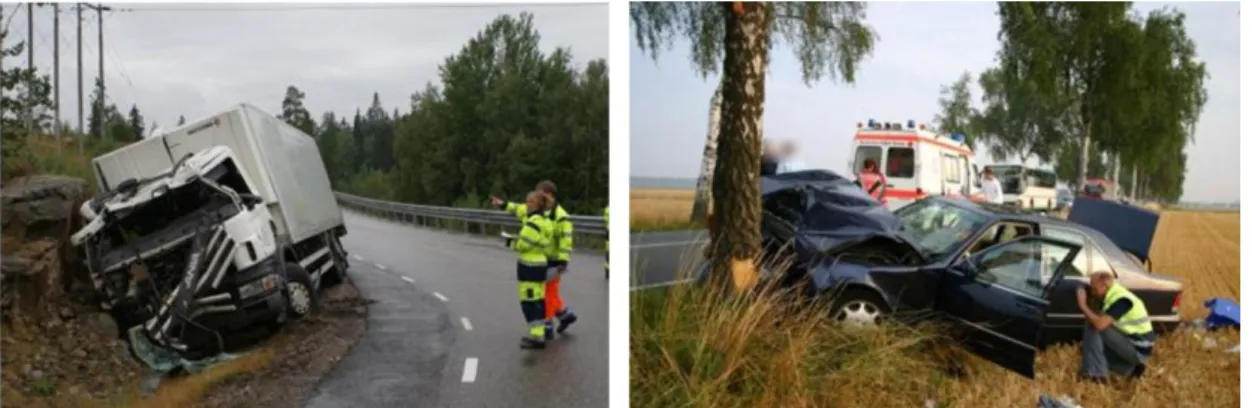
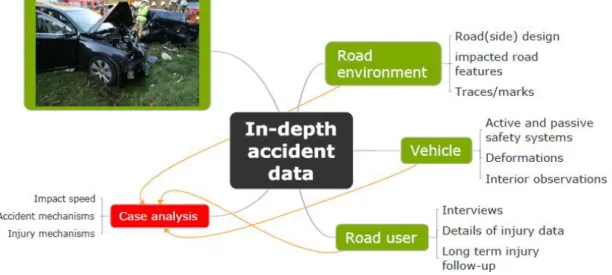
The review of policymakers data needs identified a major gap in availability of in-depth data that describes the causes of accidents and injuries. This data is typically gathered by attending the crash scene in time where specialist teams take measurements of the crash scene, interview participants and witnesses and inspect vehicles. Such data is heavily used by vehicle manufacturers, highway operators and increasingly the insurance industry. It directly impacts on automotive regulations and consumer rating systems such as EuroNCAP.
Each investigation may involve several thousand data items to be completed and so the numbers of cases gathered are considerably fewer than in national accident databases. In-depth data is gathered by a small group of countries including the UK, Germany and Sweden however the data gathered even by only these three countries is incompatible and does not reflect the EU situation. Two main barriers to representative data concern the lack of a harmonised protocol and the absence of suitable crash investigation teams.
The DaCoTA team has addressed these obstacles and Europe is now ready to conduct systematic in-depth investigations of accident and injury causation. The main outputs are listed below.
1. A validated protocol covering all aspects of data collection including data
specifications, case sampling and crash investigation methods. This includes the definitions of over 1,500 variables that can be completed for each crash.
2. A Wiki-based glossary of the data openly available at http://dacota-investigation-manual.eu/
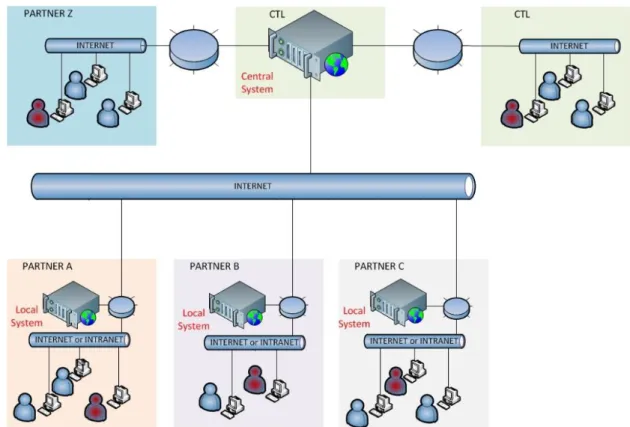
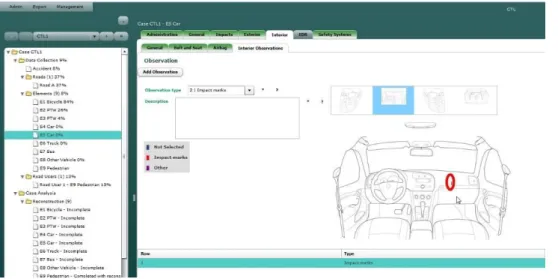
3. An open-access database system to the data protocol ready for users to populate with their own data.
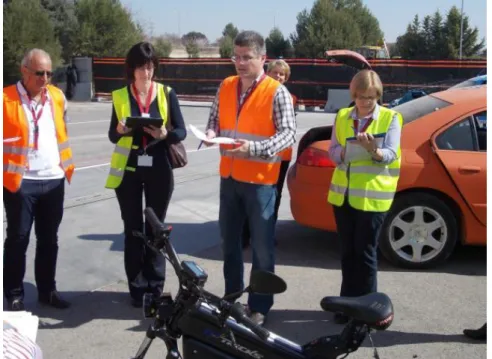
4. A network of teams in 19 EU Member States, each trained and having implemented the local infrastructure necessary for pilot investigations. Many of these teams have national support for future data gathering.
DaCoTA_Final_Report.docx 5 5. A set of pilot cases gathered by the teams to demonstrate the capability to
investigate collisions.
The next step to initiate investigations of accident and injury causation at European-scale is to identify a suitable funding mechanism from a routine or research budget to support the teams.
Data Warehouse
A validated set of data protocols for accident data (CARE database), exposure data and safety performance indicators has been established in the previous SafetyNet project.
Nevertheless there is still an absence of data in an available structured manner that needs to be urgently addressed. Furthermore there are other types of data that have not been
previously addressed including health indicators, accident causation data, and information such as programmes, measures, legislation etc. The Data Warehouse has therefore been developed to structure these data into a format permitting regular access through a dedicated website (http://safetyknowsys.swov.nl/). With the support of the European Commission and the Member States through the CARE experts group this wide range of data has been gathered together in the form of Master Data Tables and used to develop a series of road safety analyses and syntheses.
The Master Tables contain the following data: 1. Road accident data derived from
the CARE database covering 73 road accident elements from all EU countries
2. Risk exposure data comprising 97 elements for EU countries
3. Safety Performance Indicators for
Alcohol and drugs
Speed
Protection systems
Daytime running lights
Vehicle safety Enforcement outputs Accident causation Health data 4. Under-reporting of crashes 5. Country characteristics 6. Traffic rules
7. Road safety programmes 8. Road safety measures 9. Road safety management 10. Road user behaviour This data was used to develop a series of outputs continuing and extending Annual
Statistical Reports, a road safety management profile for each country and Basic Factsheets covering
Main figures
Children (aged<15)
Young people (aged 18-24)
The Elderly (aged>64)
Pedestrians
Cyclists
Motorcycles & mopeds
Car occupants
Heavy Goods Vehicles and Buses
Motorways
Junctions
Urban areas
Youngsters (age 15-17)
Roads outside urban areas
Seasonality
Single vehicle accidents
Gender
Accident Causation
Decision support
The DaCoTA project aimed at providing policy makers with adequate data, information and tools for performing evidence-based policy making. In earlier and current EU projects, a rich variety of data, information and methods has been gathered and will continue to be
gathered. In this context, the goal of Work Package the Decision Support Work Package was to make this stock of knowledge accessible and directly useable for the development of road safety policy and decision making. Decision Support therefore: (1) exploited the data
DaCoTA_Final_Report.docx 6 available for analysis by providing forecast of the road safety situation in the different member states and (2) worked on the development of ready-to-use instruments. Tools that were well-appreciated in the past, such as overview fact sheets, or web-texts were up-dated and standardised. The use of standard methods was complemented by research activities to generate new tools like the national forecasts or the composite road safety index. All these activities were conducted in close communication with the user-group itself, the policy makers or those who directly support them.
An extensive range of outputs was generated following a detailed consultation and
evaluation of policymakers needs and based on the data gathered in the Data Warehouse 1. Forecasts of traffic fatalities for each EU Member State for the period to 2020 based
on advanced statistical procedures. Summary sheets and full reports were produced for each country.
2. State of the art reviews on key road safety topics were written by expert authors under the supervision of a peer group to ensure quality. Previous reviews developed within the SafetyNet project were updated and new reviews produced. The topics that are covered by the web texts are:
Age groups Children Novice drivers Older drivers Road users
Pedestrians and cyclists Powered two wheelers Hazardous behaviour Driver distraction
Cell phone use while driving Fatigue
Alcohol/drugs
Speed and speed management Work-related road safety
Post-crash
Post impact care E-safety
Road safety measures Roads Speed enforcement Vehicle safety Policy issues Quantitative targets Cost-benefit analysis Safety ratings
Road safety management
Integration of Road Safety in other policy areas
3. Country overviews of road safety presenting the key characteristics of road safety in each of the 27 Member States in considerable detail including structure and culture, safety measures and programmes, safety performance indicators, final outcomes and social costs.
4. Research was conducted to develop a single composite performance index that would characterise road safety in each country, a partial success was achieved in the face of considerable methodological challenges.
Safety and eSafety
The rapid development of new sensing, communications and on-vehicle processing capabilities is opening up a host of new opportunities to improve casualty reduction. Technologies such as enhanced braking, stability control, lane keeping, driver status and others offer the capability to prevent or mitigate collisions. New autonomous systems, such as emergency braking are considered to have a great potential to improve casualty
reduction. Nevertheless the capabilities to quantatively assess the benefits of the new systems has not yet matched the technological progress in the development of the systems. Furthermore it is not always clear how the functionality of the systems corresponds to the priorities for crash avoidance or mitigation or that the systems are addressing a key shortfall of drivers. The challenges for technology developers are to develop methods to predict the impact of a safety system before it is in widespread use, methods to measure the impact
DaCoTA_Final_Report.docx 7 once it is in widespread use, methods to identify the major driver deficiencies that the technologies are to address.
In support of these objectives the DaCoTA team has developed new resources that can assist the identification of key functionalities and also propose suitable methods both to assess the safety impact of a system both in advance and when in production.
A general framework of assessment is presented that seeks to combine the assessment process within the wider context of evaluating and developing road safety. This framework addresses:-
data collection methods
data analysis methods
socio-economic methods
pitfalls and difficulties.
An analysis of drivers needs based on 445 in-depth accident cases has been used to assess the functionality of active safety systems against the errors made by the drivers. Conclusions are given on the appropriateness of individual safety measures to address the needs.
An evaluation of the key factors involved in deriving new vehicle test procedures to evaluate the performance and outcomes of new safety systems. One limiting condition is the lack of a central resource that defines the specific safety systems found on each car involved in a collision. The proposed modification of the Periodic testing (Directive 2009/40/EC) to include the assessment of the continued function of electronic safety systems is considered to possibly be a mechanism to develop such a centralised resource.
The future development of active, integrated and cooperative safety systems relies on the availability at European level of suitable detailed data on the causes of accidents.
Driver behaviour monitoring through naturalistic observations
The advent of low-cost data collection system that can be fitted to a vehicle and will record details of the vehicle usage now presents a new opportunity for driver behaviour data with greater detail and precision than has previously been available. By equipping cars with suitable instrumentation it is possible to continuously monitor how the vehicle is used and therefore certain aspects of the driver behaviour. Such equipment can measure location, speed, braking and the operation of vehicle systems through the CANBUS. More advanced equipment with video recording can record a continuous visual image of the driver and the external traffic environment. The 100 car study, conducted by the Virginia Tech Transport Institute has shown the power of such data in improving the understanding of the role and nuances of driver behaviour in respect of driving performance. The key characteristics of these so-called naturalistic driving observations is that the data should represent the true driving behaviour by being conducted in an unobtrusive manner so that behaviour is unaffected by measurement.
The DaCoTA team have evaluated the potential of naturalistic driving data to derive new measurements of exposure and safety performance indicators that would reinforce the data available from other survey methods.
The use of video, while very valuable at a research level, was considered not to be appropriate for the measurement of exposure or safety indicators since due to the major analytic effort required to review and code the video data. Furthermore to represent the spectrum of behaviours in a country it would be necessary to conduct large-scale studies where the costs of analysis of video data would be prohibitive. The team concluded that valuable low-level data could be gathered by a data acquisition system (DAS) comprising
DaCoTA_Final_Report.docx 8 GPS, accelerometers, and potentially further CANBUS data. Further context data describing the driver characteristics would be gathered by questionnaires.
The team prepared a specification of the requirements for a future large-scale naturalistic driving study that comprised instrumentation, study design, the risk-exposure and
performance indicators that would be derived, the analytic methods and the manner of meeting legal and ethical requirements. The methods were validated using a series of small-scale naturalistic driving pilot studies conducted in Israel and Austria.
The outcomes of the work were a detailed specification of the requirements for a future large-scale naturalistic driving study.
DaCoTA_Final_Report.docx 9
RECOMMENDATIONS
DaCoTA recommendations for the transition of ERSO to become a fully functioning Observatory
The preparation and development work conducted by the DaCoTA team and the safetynet team before it have put in place the essential data specifications, collection methods, protocols and analysis methods to support a fully functioning ERSO. All of the
methodologies have been validated through stakeholder consultations and pilot studies. While there are some types of data where further research is needed there are many that are now capable of being routinely implemented at EU level. Many of the data and
policymaking tools developed in the two projects are now mature and are ready to form part of ERSO. To achieve this a number of key steps need to be taken to obtain the full value from the investment in previous accident data research studies, these steps are in respect of the institutional organisation of ERSO, implementation of routine data functions and
integration with future EU road safety research. The priority data gap concerns the lack of European in-depth accident data which can be addressed by the structure put in place by DaCoTA in 18 countries.
The DaCoTA team makes the following recommendations. Recommendations for Institutional arrangements for ERSO
1. Establish terms of reference for the operation and future development of ERSO These will ensure clarity over the objectives of ERSO and the manner in which it operates within the Commission and with external stakeholders. They will detail the participation of the Directorates-General of the EC, Member States, industry
stakeholders and others and will embed the operational parameters of the Observatory. 2. Establish an advisory body
The Observatory will rely on knowledge and data from Member States and other stakeholders to be fully effective. However it is also a service for road safety
policymakers and it must continue to meet their needs. The Member States particularly are more than data providers and should have the opportunity to guide the future operation and development of ERSO.
An advisory body is needed that will represent the body of stakeholders, it should include the Member States, perhaps with a link to the High Level Group on road safety, as well as industry and other stakeholders.
3. Establish a funding stream for routine data collection
A routine funding stream is necessary for the future operation of ERSO, this will cover the costs of gathering and processing data, any special surveys that may be required, updating of the data tools and knowledge and maintaining the ERSO infrastructure. Precise costs have not been estimated since they depend heavily on the exact content of the Observatory but a similar activity in the US is budgeted at over $34m annually. Priority data gap – in-depth accident data
4. The lack of European in-depth accident data is a major obstacle to a detailed
understanding of the causes of accidents and injuries. A large-scale pilot study is now needed to implement regular collection of in-depth data across the EU, the teams established by DaCoTA in 18 countries provides the best platform available to achieve this.
DaCoTA_Final_Report.docx 10 Recommendations for implementation of routine data functions
5. Establish a procedure whereby the following data types and tools are updated annually and made available on ERSO
Exposure data – gathered by Eurostat + special surveys
Safety Performance Indicators – gathered by special surveys
Medium depth data on fatal accidents – gathered by enhancing national data
Basic fact sheets
Annual statistical report
Country overviews
Website – annual enhancement and updating
6. Establish a procedure whereby the following data types and tools are updated periodically and made available on ERSO
State of the art reviews – update and enhance every two years
Country forecasts – update every three years
7. Establish a road safety policy support structure to enable ERSO data to be presented in the most efficient and accessible form for policy-makers
Recommendations for integration with future safety research programmes
8. Establish a formal relationship between ERSO and the road safety research programme under H2020 to ensure the research programme to 2020 incorporates the needs of the developing Observatory.
9. Define a research programme in relation to ERSO to further develop road safety data tools and knowledge. Priority areas include
a. The causes of accidents and injuries in the EU to car occupant casualties b. The causes of accidents and injuries to vulnerable road users in the EU c. The causes of accidents involving specific target groups (eg children,
level-crossings, older road users, new model cars etc.)
d. Data methods to assess the causes and social impacts of serious injuries e. Real-world evaluation of performance of new safety systems
f. Impact of different road safety management strategies on casualty outcomes g. Driving culture and safety
h. Development and implementation of a policy support framework for routine impact assessments
i. Development and implementation of a policy support framework for routine cost benefit evaluations of measures
j. Methodological improvements in naturalistic driving/riding (ND/NR) studies and FOTs
k. Naturalistic studies & FOTs for VRUs
l. Safety assessment of road infrastructures based on accident data
10. Ensure that results, reports, data and syntheses of all relevant H2020 research projects are made available in a suitable format to be incorporated within ERSO.
DaCoTA_Final_Report.docx 11
ACKNOWLEDGEMENTS
Many people and organisations have contributed to the final results of the DaCoTA project, it has relied on the hard work, dedication, imagination and rigour of scientists from 18
organisations. Over 100 people named below have contributed to the project Letty Aarts Mostafa Aldah Costas Antoniou Deniz Atalar Martina Babková Jo Barnes
Jose Antonio Bartolome-Marcus Robert Bauer Charlotte Bax Frits Bijleveld Susanna Bonello Arnaud Bonnard Niels Bos Christian Brandstaetter Jeremy Broughton Laurie Brown Corinne Brusque Ilona Butler Bastien Canu Roberto Carroccia Dawn Chambers-Smith Ragnhild Davidse Javier Diez-Rabanal Michelle Doumen Emmanuelle Dupont Erik Ernits Petros Evgenikos Helen Fagerlind Inger Foldager Manuelo Francisco Aviles-Lucas Henning Fransplass Victoria Gitelman Gabriele Giustiniani Mouloud Haddak Li Hagström Shalom Hakkert Heinz Hautzinger Elke Hermans Thierry Hermitte Julian Hill Jacek Inowolski Magali Jaffard Heikki Jahi Ben Johnson Michael Jänsch Vincent Kars Alan Kirk Jacqueline Knowles Anja Kosiek Sylvain Lassarre Jack Lavan Mikael Ljung Aust Alejandro Longton Francisco J. Lopez-Valdes Robert Louwerse Klaus Machata Dimitri Margaritis Heike Martensen Óscar Martín Jan Martinsson Uta Meesmann
Álvaro Gómez Méndez Ágúst Mogensen Andrew Morris Nicole Muhlrad Andraz Murkovic Mario Nombela Anuncia Ocampo-Sanchez Dietmar Otte Jean-François Pace Javier Páez-Ayuso Sirle Pai Eleonora Papadimitriou Panagiotis Papantoniou Kalle Parkkari Céline Parraud Catherine Perez Christophe Perrin Luca Persia Manfred Pfeiffer Monika Pilgerstorfer Miha Podgorsek Michèle Populer Anat Rave Mathieu Roynard Farida Saad
Maria Teresa Sanz-Villegas
Davide Shingo Usami Freya Slootmans Miroslav Štepán Christian Stefan Fabian Stille Gasper Sustersic Rachel Talbot Shena Taylor Audrey Testaferrata de Noto Pete Thomas Tineke Togni Tomer Toledo Ernst Tomasch Pia Trischler Henriette Ussing Gilles Vallet Kirsten van Duijvenvoorde Pierre Van Elslande Nicole van Nes Andrew Weeks Ruth Welsh Pavel Vobobiril George Yannis Anna Zielinska Jan-Ove Åsbogård Tor Østberg
Particular thanks must be given to the members of the CARE experts group, representing the 27 Member States for the considerable support that has been given to the project and without whom the ERSO could not exist.
Finally the initiative and support of the European Commission, DG-Move and Mme Sanz-Villegas as Project Officer who has lent a strong guiding hand and brought a superlative knowledge of the policy-making process.
DaCoTA_Final_Report.docx 12
1. INTRODUCTION
1.1. Background
In 2008 over 39,000 people were killed on the roads of the European Union with at least 1,000,000 people injured. In addition to the impact of human pain and suffering the
economic impact of these fatalities is also considerable, having been estimated at €160,000 million for EU-15. The reduction of fatalities and injuries is now a priority for national and EU policy makers and the European Commission has adopted a target to reduce fatalities by 50% by the year 2010 compared to the year 2000 baseline.
In pursuit of this casualty reduction objective a wide range of vehicle and road safety policy measures are developed and implemented both at EU and Member State levels. These measures may address “traditional” road safety problems such as excess alcohol and speed and non-use of seatbelts, these are typically national level issues although there may be added value from coordinated EU action. Other measures are largely determined at EU level such as technical standards for vehicles and road infrastructure and cross-border
enforcement issues. Increasingly the application of intelligent systems to road and vehicle safety is moving from the research domain to the market and there is now a recognised need for the evaluation of the safety impact of new systems. The European Commission and Member States hold responsibility for many aspects of policy-making but there are many other stakeholder groups including:-
Automotive industry
Insurance industry
Road operators
Fleet operators
Police and emergency services
Citizens groups
Local and regional administrations
Non-governmental organisations
Each of these groups is concerned with the implementation and outcomes of road and vehicle safety measures and has a stake in the development, implementation and outcomes of safety policies.
1.1.1. Evidenced based road safety policy making
Historically many of the decisions concerning road safety policy were made on an ad-hoc basis. However it is increasingly recognised that there is a need for a structured, evidence based approach to road and vehicle safety policy making. A successful road safety
management process will require quantitative evidence to set casualty reduction targets based on specific measures and the reduction attainable from each. It will utilise accident data to identify road safety priority areas and to formulate appropriate measures to address the specific needs of the target populations and the circumstances of the problem. Safety indicators are used to identify the links between the implementation of measures and casualty reductions. There is a considerable level of transferability of road safety measures so benchmarking performance enables countries to learn from others and measures of risk facilitate this comparison. An essential part of any road safety policy-measure is an
assessment of the effectiveness of measures in order to provide feedback and accident and safety data is needed to measure the outcomes. Technical measures such as road or vehicle performance requirements as well as education, training and enforcement measures
DaCoTA_Final_Report.docx 13 all require assessment and feedback. Finally many aspects of road and vehicle safety involve the evaluation of technical measures - such as vehicle or infrastructure based systems, and the introduction of intelligent systems is of major interest. Both macroscopic and in-depth accident data is needed to support these assessments.
The SUNflower pyramid (Koornstra et al., 20023, Wegman et al. 20054), describes a hierarchy of five levels of road safety components that can be used to describe a country’s road safety performance (Figure 1).
Figure 1: A target hierarchy for road safety (Koornstra et al., 20025; LTSA, 20006)
The lower layers of the pyramid influence those above as follows:
The road safety performance of a country is related to structural and cultural characteristics (i.e. policy input) at the bottom level.
It is consequently related to common practice (i.e. safety measures and programs - policy output), resulting from the structural and cultural characteristics, at level 2.
To link these first two layers to the actual road accident outcomes an intermediate layer specifies the operational level of road safety in the country, containing road safety performance indicators (RSPI) on issues like speeding, drinking and driving, as well as a concise depiction of the road network and the main features of the vehicle fleet.
3 Koornstra, M., Lynam, D., Nilsson, G., Noordzij, P., Pettersson, H-E., Wegman, F. & Wouters, P.
(2002). SUNflower: a comparative study of the development of road safety in Sweden, the United Kingdom, and the Netherlands. SWOV Institute for Road Safety Research, Leidschendam
4
Wegman, F., Eksler, V., Hayes, S., Lynam, D., Morsink, P. and Oppe, S. (2005). SUNflower: A comparative study of the development of road safety in the SUNflower+6 countries: Final Report. SWOV Institute for Road Safety Research, Leidschendam, the Netherlands.
5
Koornstra, M., Lynam, D., Nilsson, G., Noordzij, P., Pettersson, H-E., Wegman, F. & Wouters, P. (2002). SUNflower: a comparative study of the development of road safety in Sweden, the United Kingdom, and the Netherlands. SWOV Institute for Road Safety Research, Leidschendam
6 LTSA (2000). Road safety strategy 2010. A consultation document. National Road Safety
DaCoTA_Final_Report.docx 14
Final outcomes expressed in terms of road casualties are then necessary to understand the scale of the problem. This type of information is found at level 4, and consists of different types of road risk indicators.
The top of the pyramid includes a sound estimate of the total social costs of road crashes. Data to describe and tools to estimate the characteristics of each pyramid component are necessary to assess road safety performance and for effective evidence based policy making.
All EU member states gather accident data in order to provide basic information on the national road safety population; this data is recorded both in national databases and in the EC CARE database. Some Member States gather additional information about the
causation of accidents and injuries while others may record other safety information to support the interpretation of the evolution of road safety measures. Countries with an established road and vehicle safety information system include the UK, Sweden, Germany and the Netherlands; however there are no countries that systematically gather safety data in a comprehensive and coordinated manner. The lack of uniform safety data provision is greatest at EU level where the only consistent data is available within CARE and
EUROSTAT, which does record some basic measures of exposure.
1.2. The European Road Safety Observatory
The need for European accident and safety data was recognised as a limitation on the implementation of effective road safety strategies and measures and in the 2003 Road Safety Action Plan, the European Commission announced the decision to establish the European Road Safety Observatory (ERSO). The ERSO brings together a range of data and knowledge sources to support safety policy making at both EU and national level. The 6FP project SafetyNet constructed the basic framework of the Observatory and started to populate it with several levels of data. It has also put in place a number of the key
processes concerning routine collection of the data. In general SafetyNet developed new data methodologies, validated them and presented results. Key achievements of SafetyNet include:-
Extension of CARE database to incorporate the data from 27 EU Member States
Recommendation for more comparable accident reporting
Recommendation for comparable injury severity and coefficient for underreporting of severe injuries
Developed protocol for defining exposure data for evaluation of accident risks
Developed and validated a protocol for Safety Performance Indicators and applied it to EU Member States
Developed a protocol for transparent and independent accident investigation
Developed and validated a protocol used to gather in-depth accident causation data which was subsequently analysed
Developed the ERSO website to provide access to all project results and to be the source of high quality road safety information
Developed and applied a series of analytic approaches to analyse complex data structures, namely multi-level and time series data
In some cases (e.g. CARE data) the data gathering is already sufficiently well developed to be a routine EU-level activity. In other cases (e.g. exposure data, performance indicators) the capability of Member States to gather data in a harmonised manner is more varied and structures have to be developed at national level before data can be routinely updated. Finally there are areas (e.g. in-depth data) where the infrastructure only exists in a limited number of countries and new teams and infrastructure have to be put in place.
DaCoTA_Final_Report.docx 15
ERSO has been launched publicly and the European Commission has presented a vision for the further development of ERSO which maps out a path to a fully implemented Observatory incorporating a wide variety of data and knowledge from all EU Member States. The vision for the European Road Safety Observatory is that it should become an institutional data and knowledge system that will bring together a range of data relating to accidents (macroscopic and in-depth), the transport conditions (exposure, infrastructure), road user behaviour (attitudes and driving actions) and road safety management (policies, effectiveness, enforcement). The data will be gathered on an institutional basis and will be routinely updated depending on the speed of change. In principle the Observatory will consist of two parts, the web-based side to provide access to the data and information, and the procedures behind it to systematically gather, structure and analyse the data.
In this way ERSO can provide data, tools and information that are relevant to all components of the SUNflower Pyramid and therefore necessary to support effective evidence based policy making.
While SafetyNet has provided the structure and basic framework there were several additional areas of data and knowledge that require further development before the
Observatory could be considered a mature resource. There was also a need to enrich the range of information gathered and to improve the structure and focus on supporting safety policy. ERSO would then be able to support routine activities with organised structures to provide regularly updated data and information in a systematic way as well as providing a platform for specific research activities that can address needs for data, tools and other information as they arise.
1.3. Project aims
The DaCoTA project aimed to further extend and develop the ERSO by developing and implementing new approaches to gather, structure and apply policy-related safety data that can be incorporated within the Observatory.
The six key areas of road safety data that were focused upon were
Road safety policy and management
In-depth safety related accident data
Collecting and structuring data
Accident forecasting
eSafety
Normal driving behaviour
Developments in road safety management are discussed in chapter 2 Policy-making and Safety Management Processes. The aims of this work area were to build a new linkage between policy making and evidenced based approaches by conducting a broad
consultation with national level and other stakeholders and to review the road safety management approaches adopted in target Member States.
Chapter 3 Pan-European In-Depth Accident Investigation Network addresses the area of In-depth safety related accident data, and aimed to build a large-scale accident investigation infrastructure that will be capable of gathering in-depth safety related accident data
concerning crashes across the EU. A review of existing in-depth investigation protocols was conducted and the most effective approaches were identified in order to produce a manual for conducting in-depth investigations.
The area of collecting and structuring data is considered in chapter 4 Data Warehouse, which describes the development of a road safety data warehouse as a comprehensive and integrated system with aggregate data and information necessary for decision making
DaCoTA_Final_Report.docx 16 support. This work area aimed to continue the efforts made in previous projects by
gathering, consolidating and standardising the available road safety data and information, through the exploitation of all available sources, in a systematic and comprehensive way. Chapter 5 Decision Support addresses the development of tools useful for accident forecasting and other areas of knowledge based decision making. The main goal of this area was to bridge the gap between research and policy by bringing together policy makers’ needs and tangible tools. Consultations were conducted with stakeholders, including
Member States, to develop and implement models to forecast trends to assist in the identification of future road safety targets.
eSafety is the topic of chapter 6 Safety and e-Safety. This work area aimed to develop methodologies and approaches that will enable future evaluation of the safety impact of emerging intelligent technologies. It also builds on previous EU projects – such as Trace and eIMPACT to utilise available safety data and guide new technology development to address the principle safety requirements of vehicles and roads
Chapter 7 Driver Behaviour Monitoring through Naturalistic Driving Observations deals with normal driving behaviour. The aim was to set up of a methodology for continuous monitoring of normal driver behaviour that is comparable between countries, within the framework of the European Road Safety Observatory (ERSO). The methodology describes the necessary framework to gather, record and analyse naturalistic driving behaviour to inform safety policies and the development of new safety approaches.
Although dealing with separate topics, relationships between the work areas were
established during the course of the DaCoTA project with knowledge about policy makers’ needs for data and tools being passed from the road safety management work area to the decision support area. In addition, all appropriate knowledge, data and tools outputs were included in the Data Warehouse. The work in each area has also resulted in data,
DaCoTA_Final_Report.docx 17
2. POLICY-MAKING AND SAFETY
MANAGEMENT PROCESSES
Chapter authors: Muhlrad, N. IFSTTAR; Papadimitriou, E., Yannis, G. NTUA See also Deliverable 1.6: Final Report of WP1 – Road Safety Policy
2.1. Objectives
In the DaCoTA project, research on road safety policy had two purposes:
1. Identifying the needs for data and decision-support tools of road safety decision-makers, managers and other key stakeholders in order to develop the European Road safety Observatory, ERSO, and make it as relevant as possible for all the tasks involved in policy-making.
2. Developing knowledge on road safety management systems at the national level, both from a theoretical and logical point of view (defining “good practice” criteria and testing them) and from a practical point of view (describing and assessing existing road safety management systems in European countries, collecting practical ways to achieve elements of “good practice” and laying the grounds for a European observatory of road safety management to be integrated into ERSO).
As development of a “data warehouse”, of in-depth accident data collection processes, and of decision-support tools were other objectives of DaCoTA, some results addressing the first objective had to be obtained rapidly so as to be put into use immediately as a framework for the other research efforts.
2.2. Methodologies
Both quantitative and qualitative methodologies, most of them new, were designed to reach the objectives. The following figure provides an overview of the methodological
DaCoTA_Final_Report.docx 18 Objective 1
Needs for data and technical tools
Objective 2
Investigating road safety management
Consultation of Experts Open questionnaire, interviews Consultation of road safety stakeholders Closed questionnaire Other DaCoTA teams Task 1 Task 3 Methodological development from literature and previous experience
Policy-making cycle, good practice Tasks 1 and 2 Comparison of results Task 4 Investigation of RS management systems
Closed questionnaire with open comments, sample of countries
Quantitative analysis on closed questions Descriptive statistics, factor analysis, classification Qualitative analysis on closed questions + comments Country profiles and diagnosis Task5 Legend Methodological design Qualitative analysis Quantitative analysis Mixed quantitative/ qualitative analysis Figure 2: Overview of methodologies
2.2.1. Consultation of a panel of experts
Scientific support is necessary for road safety management to produce optimal results as only road safety interventions based on facts and knowledge can succeed in efficiently reducing the number of road casualties. However, road safety management is a complex process involving numerous steps, some of which may not be obvious to the scientific community. A description of the key tasks involved in this process was therefore needed to investigate the needs for scientific input felt by those working at the interface of road safety research and management.
As results on the actual needs for data and decision-support tools were expected at an early stage of the DaCoTA project to support new developments of ERSO, a consultation of a panel of experts was organized. The experts were to have in-depth knowledge of road safety management processes and needs in their country and to be, either directly involved in decision making, or working closely with decision makers as advisors. The National Expert Group of the European Commission, that represents all EU member states as well as non-member Schengen countries (Norway, Switzerland, Iceland), formed the core of the panel; a number of other qualified experts suggested by some of the EU experts and by DaCoTA team members were added to enlarge it.
Two parallel consultation methods were implemented: semi-directive interviews were carried out by members of the DaCoTA WP1 partners (mainly with panel members from their own countries) while a request for written contributions was sent through the EC to all panel experts. Three open questions were formulated, allowing the experts to describe their own experience, views and messages and to put emphasis on the issues they considered most important.
As a support to interviews and written opinions, a two-dimensional matrix was built up, describing some key steps of policy-making in which knowledge is crucial (fact finding,
DaCoTA_Final_Report.docx 19 programme development, preparing implementation, monitoring and evaluation) and cross-tabulating them with the needs for scientific information (data, technical tools for data treatment, other decision-support tools, training tools). The matrix was also used as guideline for the text analysis of the information gathered.
More details can be found in Muhlrad, N, Dupont, E (Eds.) (2010): Consultation of a panel of experts on the needs for data and technical tools in road safety policy-making, Deliverable 1.1/4.1 of the EC FP7 project DaCoTA.
2.2.2. Consultation of road safety stakeholders
Experience and findings from the consultation of the panel of experts was used as a basis to perform a broader-scale consultation of road safety stakeholders including decision-makers, managers and other road safety professionals as well as researchers and representatives of the private sector and the civil society (businesses, non-governmental organizations). The aim of the consultation was both to validate the results obtained on the needs for data and decision-support tools and to assess priorities. The availability of the data and tools which were found useful or necessary was also investigated.
In view of the large number of stakeholders to be approached, it was decided to set up an on-line questionnaire and to make use of a standard survey tool. The bulk of the multiple-answer questionnaire was developed from the synthesis of the assessments provided by the panel of experts and structured according to the matrix crossing policy-making tasks and needs for scientific support. This core was complemented by questions such as country of origin of the stakeholder, field of work or previous experiences with national/international data or information sources. The questionnaire was tested by working colleagues of the research team who had no previous knowledge of its aim or contents, and all remarks from this pilot study were taken into account to prepare the final online version.
Circa 3150 stakeholder contacts from European and other OECD countries were collected from the European Commission, from the ETSC (European Transport Safety Council) as well as its PIN Panel members, and from FERSI (Forum of European Road Safety Research Institutes). The European Commission, DG MOVE, sent a cover letter to all respondents by e-mail, introducing the questionnaire and providing a web link to the survey. The survey was open for a month and a reminder was sent by the European Commission halfway through. Undelivered messages were excluded from the original list of recipients and the final answering rate was 16%, which is satisfactory for this kind of survey method.
Results of the survey were analysed through basic statistical methods to identify priorities and find out how stakeholders viewed the availability of the data and technical tools they wished to use. Furthermore, Principal Component analyses and Cluster analyses were performed on two sets of information (data needs, data availability) in order to identify groups of stakeholders sharing both similar priorities and similar problems as regards data and tools for knowledge-based policy-making.
For more details on the questionnaire survey, see: Machata, K, Barnes, J, Jahi, H (Eds.) (2011): Stakeholder’s contribution, Deliverable 1.3 of the EC FP7 project DaCoTA.
DaCoTA_Final_Report.docx 20
2.2.3. Investigation of road safety management systems in
European countries
The methodology was designed in four steps.
a) Development of a road safety management investigation model
An extensive review of the literature was performed, which showed that, although very little research had been carried out on road safety management systems, there was a consensus of experts as to what such a system should be for “good practice”. However, there was no indication that the consensus model was actually implemented in European countries. The qualitative investigation model developed in DaCoTA thus aimed both at describing in a consistent way what road safety management systems are in the field and at defining criteria of “good practice” to assess their good points and their negative aspects.
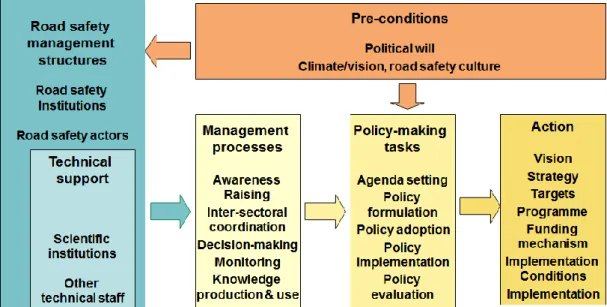
The structure of the model and the “good practice” criteria were based on literature and on the research and practical experience of the DaCoTA team members. To describe road safety management systems, a policy-making cycle (from agenda setting to policy implementation and evaluation) and the tasks to perform in order to get the desired policy outputs (including those in the matrix previously used) were defined as well as some transversal processes which were found essential to the performance of these tasks (such as inter-sectoral coordination, monitoring, or consultation of stakeholders). The “good practice” criteria were identified at each step of the policy-making cycle and for each transversal process (Figure 3). It was assumed that “good practice” implies knowledge-based policy-making.
Figure 3: The components of the road safety management investigation model
b) Development of a questionnaire and an investigation process
Fact-finding on road safety management systems is not an easy task as few persons are fully familiar with the complex organization of road safety in their own country. It was found that the desired information could only be obtained from road safety experts. As in the panel consulted earlier, experts were defined as professionals with long experience and in-depth knowledge of road safety management processes in their country; they were divided into two categories: managers (directly involved in policy-making), and scientific experts (senior
DaCoTA_Final_Report.docx 21
researchers or technical specialists having worked closely with managers). At least one manager and one scientific expert were identified in each country investigated.
Based on the investigation model, a detailed questionnaire was built up, including fifty questions structured in four parts (institutional organization, policy formulation and adoption, policy implementation and funding, monitoring and evaluation, scientific support and capacity building). As both quantitative and qualitative analysis of the information was to be performed, each question was divided in sub-questions calling for yes/no answers, but open comments were encouraged to qualify the answers given. As the vocabulary used in road safety to define policy-making tasks and processes has never been standardized, a glossary of terms was provided. However, as the questionnaire had to be prepared in the language used by the multi-national research team (English), it was feared that misunderstandings would perhaps occur if experts were not entirely fluent in this language: the questionnaires were thus filled in by each expert during a face-to-face or a telephone interview with one of the team members speaking the same mother tongue and translating when necessary. This unfortunately limited the sample of countries that could be investigated in the time span and with the resources of the DaCoTA project.
c) Development of a storage facility for road safety management data
The combination of yes/no data and of comments in open text required a specific tool for data storing and data treatment. A data storage facility with a friendly interface was thus designed and put on line, enabling the team members to enter each of the questionnaires filled in by the experts they interviewed and providing access to all information for all team members. The information entered was double-checked to identify missing data, inconsistencies or possible misunderstanding of a question and the final “cleaned” data set was made available under Excel format for quantitative analysis.
c) Development of methods for data analysis
A first step of qualitative analysis was performed in order to provide a full description of the road safety management systems in each country investigated and an assessment as objective as possible of the fulfilment of “good practice” criteria. To this purpose, full use was made of the open comments provided by the experts to qualify the yes/no answers. Both the questionnaires filled in by managers and scientific experts were included in the analysis as they were found to complement each other: a more comprehensive viewpoint usually came from the managers while the scientists were often more critical. The analysis provided individual country profiles for road safety management as well as “good practice” diagnoses, performed by comparing each country to the profile of a “reference” country that would fulfil all “good practice” criteria (Figure 4).
A second step of qualitative analysis was performed on a sub-sample of key questions with the purpose to compare European countries and get a more in-depth understanding of how they handle their road safety management systems. The analysis was also meant to check whether the model developed under DaCoTA can serve as a useful tool for comparing different national solutions.
For these purposes, the data gathered in the DaCoTA investigation was complemented with data from a PIN survey carried out by ETSC (Jost G. et al.:20127) which did not cover all issues of road safety management considered in DaCoTA but included all countries from the European Union. Information was cross-checked as much as possible through international and national reports (in spite of a language problem as most of the latter are not translated
7 Jost G.; Allsop R., Steriu M. (2012): A Challenging Start towards the EU 2020 Road
DaCoTA_Final_Report.docx 22
into English). The areas of road safety management analysed included key policy-making tasks and management processes such as institutional organization, inter-sectoral coordination, stakeholders’ involvement, policy formulation and adoption, implementation and funding, monitoring and evaluation. A detailed overview of how countries fared in each of these areas was produced, and a critical analysis of the situation in Europe and of the information available to describe it was performed.
Although it has been widely assumed that effective road safety management systems are a pre-condition to road safety action and therefore to road safety improvement at country level, this has never been scientifically proven. For the first time, quantitative analyses of issues related to road safety management systems were carried out, based on the answers provided by the country experts in the DaCoTA investigation. Different sets of analyses were aimed at identifying groups of countries sharing similar road safety management components, exploring the statistical link between road safety management clusters and fatality rates, and linking road safety management and road safety performance in terms of outputs (road fatalities) and of intermediate indicators.
A lot of effort was devoted to finding the most appropriate statistical methods to treat the data collected, as the relatively small sample of countries investigated coupled with the large amount of variables documented raised some technical problems. Road safety management data was separated into four sub-samples according to the structure of the questionnaire and the non-discriminatory variables were set aside. In the analysis of the relationship between road safety management and road safety performance, the answers to common questions in the PIN survey and in the DaCoTA questionnaire were used to increase the sample size. Different statistical tools were tested and the battery of statistical methods finally applied included factor analyses (Common Factor analysis, Principal Component analysis, Categorical Principal Component Analysis), cluster methods (Hierarchical, Ward and k-means), Spearman's rank correlation, Pearson correlation, Poisson and other Generalized Linear Models, and Beta regression models.
The intermediate and final road safety outcome indicators selected were those developed by the decision-support research group in DaCoTA WP4 (Road Safety Management Indicator, Road Safety Performance Indicator, Road Safety composite indicator) with reference to the SUNflower model.
It is to be noted that the two sets of information provided by the questionnaires filled in by managers and by scientists somewhat differed as the road safety management situation was viewed from different vantage points. As a result, they had to be separated for quantitative analysis. In the final outcome, particular attention was given to the managers’ point of view as a matter of principle.
DaCoTA_Final_Report.docx 23
Figure 4: Profile of a “reference” country for road safety management
For more details on the road safety investigation model and questionnaire, see Muhlrad, N., Butler, I., Gitelman, V. (Ed) (2011): Road safety management investigation model and questionnaire, Deliverable 1.2 of the EC FP7 project DaCoTA. For detailed information on quantitative and qualitative analysis methods, see Papadimitriou, E., Yannis G., Muhlrad N., Gitelman V., Butler I., Dupont E. (Eds) (2012): Analysis of road safety management in the European countries, Deliverable 1.5 Vol.II of the EC FP7 project DaCoTA.
DaCoTA_Final_Report.docx 24
2.3. Main results
Over the three years of the DaCoTA project, a wealth of research results on road safety policy was obtained. Only a summary is provided below.
2.3.1. Needs for data and decision-support tools for
knowledge-based road safety policy-making
Following the preliminary consultation of a panel of experts, an extensive survey was carried out through an online questionnaire among more than 3000 road safety stakeholders in Europe and beyond. Over 500 responses were obtained, including 394 from the European region. Most responses were received from the United Kingdom, Belgium, Germany and Spain. Response rates were specifically high for national statistics bureaus, research institutes and consultancies. The health sector, NGOs and European (umbrella) organizations also responded at rates above the average. Response rates were on the contrary particularly low for Public Enterprises, the European Commission and the European Parliament. From more than 120 questionnaires that were personally sent to representatives in the European Parliament only one response was received.
Stakeholders expressed high demand for data and knowledge in road safety related decision making. They also expressed discontent about the current poor availability of such information.
2.3.1.1. Priority rankings
The following issues scored highest with regard to priority for road safety work: a) Fact finding and diagnosis
Information on crash causation factors (high priority for 67% of respondents), information on road users' behaviour and attitudes (63%), a common definition of a fatality (60%), exposure data (53%), crash databases that link police and hospital data (52%), Information on the under-reporting of road traffic crashes (49%).
b) Development of safety programmes
Information on the costs and benefits of road safety measures (56%), information on the safety impacts of combined measures (54%), common methods to perform evaluations of road safety measures (52%), a “good practice” catalogue of measures (50%), information on the public acceptance of specific road safety measures (45%).
c) Implementation
A common methodology for identifying high risk sites (46%), a “good practice” collection on implementation (43%), digital road maps for mapping crashes (41%), detailed information from road safety audits and road safety inspections (39%), a common methodology for in-depth crash analysis (38%).
d) Monitoring and evaluation
Serious injury counts, in addition to fatality counts (55%), methods to evaluate the safety impacts of road safety measures (54%), a common methodology for the evaluation of costs and benefits of road safety measures (44%), statistical methods for following trends (39%), a comprehensive monitoring of implemented measures across Europe (32%).
DaCoTA_Final_Report.docx 25
2.3.1.2. Misjudgement about availability
Most of the data and decision-support tools emerging as priorities are currently poorly available. It must be noted, however, that comparatively low availability scores were reported even for items which are already available - such as definitions of a fatalities or severe injuries for national statistics. Improving knowledge about the steadily growing portfolio of available data should therefore be one of the prime concerns of future public relations work in relation with ERSO.
2.3.1.3. Low scores but high stakes
Other technical tools such as in-depth investigations, naturalistic driving and simulator studies reached low priority scores but will be at the heart of European research for the coming years. Research thus anticipates on future needs, which is one of its functions, but the needs will be felt only if road safety stakeholders are made aware of the meaning and usefulness of the knowledge developed. Hence, one of the future functions of ERSO should be to present stakeholders with updated results from recent European research.
2.3.1.4. Components of priority and availability
Further statistical analysis was carried out in order to group the elements of the stakeholders’ survey (more than 50 items of data and tools) into ‘factors’ or components, bringing together elements with similar priority and availability level. Table 1 summarises the results of principal component analysis and factor analysis that was carried out for three cases:
Priority ratings
Availability ratings
Combined priority and availability ratings: in this case, a new composite scale was created, in which elements of highest priority but lowest availability were assigned the highest importance, while elements of low priority but high availability were assigned the lowest importance.
PCA : Priority ratings
PCA : Availability ratings
FA : Combined priority and availability ratings
Component/Factor 1 “Implementation of measures” “Costs and safety impacts of measures” “Implementation of measures”
Component/Factor 2 “Statistical models” “Statistical models”
“Accident and infrastructure analysis for the implementation of measures”
Component/Factor 3 “Costs and safety impacts of measures” “Implementation of measures” “Statistical models”
Component/Factor 4 “Road infrastructure and accident analysis” “Road infrastructure and accident analysis”
“Exploring implementation frameworks” Component/Factor 5 “Common definitions and under-reporting” “Exposure and behaviour” “Crash causation”
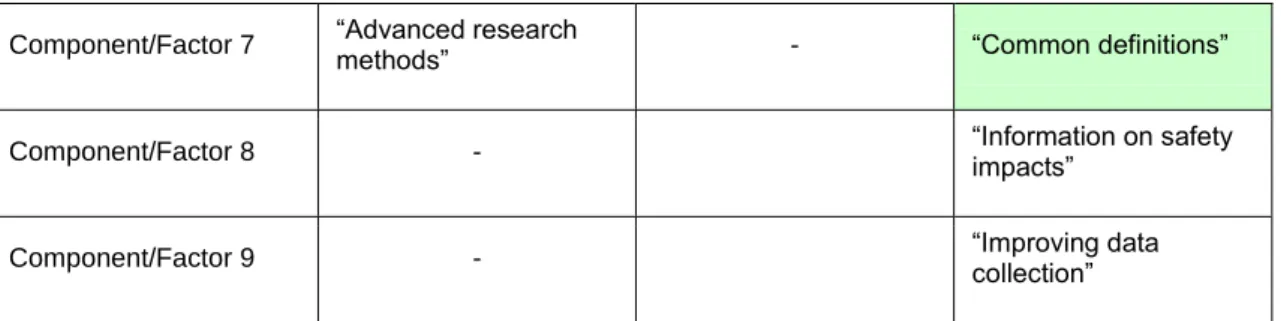
DaCoTA_Final_Report.docx 26 Component/Factor 7 “Advanced research methods” - “Common definitions”
Component/Factor 8 - “Information on safety impacts”
Component/Factor 9 - “Improving data collection”
Table 1: Overview of the components/factors selected on the basis of the separate and combined analysis of priority and availability ratings
It observed that, working with priority ratings exclusively, with availability ratings exclusively, or with a combination of the two ratings, resulted for a large part in the identification of “similar” components. Some dimensions, on the other hand, seem to emerge more specifically when analysing availability ratings or the scale combining priority and availability ratings. This is the case, for example, for “Exposure and behaviour data”, and “Road safety policies, rules and regulations”.
2.3.1.5. Grouping stakeholders
The components shown in Table 1 were used to identify “groups” (clusters) among the stakeholders, sharing common priorities in terms of data and tools, and common data availability concerns. In this case as well, three analyses were carried out:
Grouping stakeholders on the basis of priority ratings
Grouping stakeholders on the basis of availability ratings
Grouping stakeholders on the basis of the combined priority and availability ratings
Working exclusively on the priority ratings, 4 different clusters (groups) of stakeholders were identified:
Cluster 1: stakeholders with “low priority for everything”;
Cluster 2: stakeholders considering that data and models are specifically important,
Cluster 3: stakeholders that tend to assign “high priority for everything, but especially implementation”,
Cluster 4: stakeholders assigning high priority to in-depth data mostly
On the basis of availability ratings, 3 clusters of stakeholders were identified:
Cluster 1: stakeholders who declare that information on costs and benefits of measures are available, but that models are not.
Cluster 2: stakeholders declaring that models are available, but that data and definitions are needed.
Cluster 3: stakeholders who lack information about the costs and benefits of measures.
Finally, when working with the combined scale of priority and availability, 6 clusters of stakeholders are identified:
Cluster 1 “needs for most items, especially accident and infrastructure analysis”;
Cluster 2 “moderate needs for all”,
Cluster 3 “High needs for models, moderate needs in other, implementation unimportant”,
Cluster 4 “No needs for models, moderate needs in implementation”
Cluster 5 “Low importance of implementation and models, moderate needs in crash causation”
DaCoTA_Final_Report.docx 27
Cluster 6 “High needs for implementation but no use of accident and infrastructure analyses
The investigation of background characteristics of the stakeholders in the various clusters reveals little association with the countries the stakeholders work in, but a stronger relationship with the type of organisation they work for. Interestingly, researchers and policy makers are equally represented in clusters, indicating that they have similar needs and priorities, although the opposite is often assumed in road safety analyses.
2.3.1.6. A particular sub-group of road safety stakeholders: the
policy-makers
A sub-sample of 150 policy-makers was identified in the sample of respondents to the stakeholders’ survey. Belgium and the UK were over-represented in this Policy-Makers’ Group, which can be partly explained by the number of European organizations based in Belgium and the original survey only being in English. The majority of Policy Makers had worked in Road Safety for many years. 57% had worked 11 years or more in Road Safety with only 18% having worked less than 5 years.
Over 50% of Policy Makers stated that 13 data/tool items were of high priority: A common definition of a serious injury, information on crash causation factors, a common definition of a fatality, information on road user behaviour and attitudes, exposure data, statistical methods for priority setting, crash databases that link police and hospital data, information on the costs and benefits of road safety measures, information on the safety impacts of combined road safety measures, “good practice” catalogue of measures - including implementation conditions, standardised procedures and methods for carrying out evaluations of road safety measures, focusing on seriously injured counts in addition to fatality counts, and methods for evaluating the saf