STATE INVESTMENT
IN RESEARCH AND
DEVELOPMENT
Table of Contents
Executive Summary 4
Introduction 6
Chapter 1: State funding of research and development 8
1.1 Types of Research and Development indicators 8
1.2 Government budget spending on research and development 9
1.3 Detailed Government department spending on research and development 10
1.4 Programmes classified by area of research 13
1.5 GBAORD as a percentage of GNP and international comparisons 14
Chapter 2: Expenditure on R&D performed in the public sector 18 2.1 Total expenditure on R&D performed in the Government sector 18
2.2 Types of Research 21
2.3 Fields of science 22
Chapter 3: Human resources dedicated to publicly performed R&D 23 3.1 Research and development personnel 23
3.2 Gender and qualifications of State sector research staff 24
3.3 Research and development staff by fields of science (FTE) 25
Appendix
Appendix 1: Methodology 27 Appendix 2: Definition of Research & Development 28 Appendix 3: Government Departments and Agencies included in the report 29 Appendix 4: Acronyms 30 Appendix 5: Government Departments and Agencies' Programmes 31 Department of Agriculture, Food and the Marine 31 Bord Iascaigh Mhara 33
Marine Institute 34
Teagasc 36
Department of Arts, Heritage & the Gaeltacht 38
Údarás na Gaeltachta 39
Department of Communications, Energy & Natural Resources 40 Inland Fisheries Ireland 42
Department of Education and Skills 44 Dublin Institute for Advanced Studies 46
FÁS 47
Higher Education Authority 48
Irish Research Council for the Humanities and Social Sciences 52 Irish Research Council for Science, Engineering and Technology 53
Department of Jobs, Enterprise and Innovation 54
Office of Science, Technology and Innovation (OSTI) 54
Enterprise Ireland 56
Forfás 57
IDA Ireland 58
InterTradeIreland 59
Science Foundation Ireland 60
Shannon Development 64
Dept. Environment, Community & Local Government 66
Environmental Protection Agency 66
Met Éireann 68
Radiological Protection Institute of Ireland (RPII) 69
Department of Finance 70
Economic and Social Research Institute (ESRI) 70
Department of Health 71
Health Research Board 72
Department of the Taoiseach 74
The National Economic and Social Council 74 Department of Transport, Tourism and Sport 75
National Roads Authority 75
Offices 76
Central Bank and Financial Services Authority of Ireland 76
Office of Public Works (OPW) 77
Appendix 6: Sample Questionnaire 79
Appendix 7: Forfás Board Members 83
List of Figures
Figure 1: Gross Expenditure on R&D (GERD) - elements 8
Figure 2: GBAORD trend in current prices, €m. (2003-2012) 10
Figure 3: GBAORD trend (€m) and GBAORD as a percentage of GNP (2003-2012) 14
Figure 4: International comparison of GBAORD as a percentage of GDP/GNP (2011) 16
Figure 5: Average annual growth rate of GBAORD for selected countries, (2002–2011) 17
Figure 6: GOVERD as a percentage of GNP and GOVERD €m trend, (2003-2012) 18
Figure 7: Major State research and development performers, per cent of total (2012) 19
Figure 8: Total R&D personnel by occupation - headcount terms (2010-2011-2012) 23
Figure 9: Total R&D personnel by occupation – Full Time Equivalents (FTEs), (2012) 24
Figure 10: FTE Researchers by gender and qualification, (2012) 24
Figure 11: Researchers classified by gender and field of science (FTE), (2012) 26
List of Tables
Table 1: Main Government Depts & Agencies with spending of R&D activities (2012 est) 10
Table 2: GBAORD classifications for Ireland 2012 13
Table 3: GBAORD as a percentage of economic activity (GDP/GNP) 15
Table 4: GOVERD as a percentage of GDP, selected countries (2002, 2007, 2011) 19
Table 5: GOVERD by type of research (2011-2012) 21
Table 6: Field of science classified by type of research, (2011-2012) €m. 22
Table 7: Total male/female and as percentage of total by field of science, (2012) 25
Science Budget Categories
GBAORD (R&D)
- the total expenditure by Government on research and development
GOVERD (R&D)
- the research and development carried-out in Government Departments or Agencies (a sub-set of GBAORD)
GOVERD (R&D) – Researchers
Exe
The St Approp fundin intensi GBAOR Ireland Europe Interncutive
tate’s investm priations and g levels have ity level of iRD trend (€m
From 2008, result of stro
In 2012, GBA reduction in recent years d’s GBAORD ean partners ational com
Summa
ment in rese d Outlays on e fallen from nvestment hm.) and GBA
the GBAORD ong R&D spe
AORD intensi n the amount
s.
intensity rat s at 0.65 per
mparison of G
ary
earch and deR&D (GBAO m a peak of € has continued
AORD as a pe
D intensity ra ending outpa
ity remained t of funding.
te in 2011 of cent of GDP
GBAORD as a
evelopment, RD), was ma €948m in 200
d at over 0.6
ercentage of
ate has rema acing nomina
d consistent This is due
f 0.63 per ce P.
a percentage
also known a aintained in 2 08 to €796m 6 per cent of
f GNP, 2003
ained consist al economic g
at 0.61 per c e to a marke
ent of GNP is
e of GDP/GN
as Governme 2012 from 20 in 2012 (-16 f GNP since 2
3-2012
ent at 0.6 p growth.
cent of GNP ed reduction
broadly in l
NP, 2011
ent Budget 011. Overal 6%). The
2008.
per cent as a
despite a in GNP in
line with our l
a
GOV The (GO Tota It is Gov
VERD trend a
10-year tren OVERD) i.e. R
Expenditu allocation
GOVERD a illustrated has dropp relatively
al R&D perso
estimated t vernment sec Between
while non
The numb 2011. Th cent in 20
0 100 200 300 400 500 600 Re and GOVERD
nd as illustra R&D perform
ure on R&D i n of €96m in
as a percenta d in this grap ped from 0.1 y stable since
onnel by occ
that overall t ctor decrease
2011 and 20 n-PhD researc
ber of techni ere has also 012.
361 370 323
esearchers w PhDs
D as a perce
ated above s ed in the Sta
n the State s 2012.
age of GNP o ph. This sho 1 per cent in e 2005.
cupation in
the number ed in 2012 ov 12 the numb chers have d
icians are es been a decr 246 2 3
with Resea withou 20
entage of GN
shows that le ate sector ha
sector has fa
over the ten ows that, as n 2003-04 to
Governmen
of personne ver the num ber of PhD re decreased by
stimated to h rease in the 229 167 archers ut PhDs 010 2011 NP, 2003-20
evels of Gove as been main
allen from a
-year period a percentag o 0.07 per ce
nt Sector (he
l engaged in mbers recorde esearchers h y 27 per cent
have decreas number of r
238 275251
Technicians
1 2012
12
ernment Exp ntained for t
high in 2004
from 2003 t ge of GNP, th
nt in 2012 a
eadcount ter
R&D in insti ed for 2011 a
as decreased t over the sa
sed by 9 per esearch supp 288 32
s Other S
Sta
penditure on the last four
4 of €138m to
to 2012 is als he level of G nd it has bee
rms, 2010-2
itutions with as shown abo d by 13 per c ame period.
Introduction
This report tracks public funding and performance of State-funded Research & Development (R&D) and aims to capture key performance metrics within the State sector. A total of 35 Government departments and agencies who are engaged in some form of R&D activity in 2011-2012 were surveyed. This report presents findings from the ‘Research and Development Funding and Performance in the State Section – 2011-12’ survey undertaken by Forfás with the final outturn data for 2011 together with estimates for 2012.
This survey data is required for, and/or included in, the following reports:
Commission Regulation (EC) No 995/2012 of 26 October 20121. This Regulation covers the
production and development of Community statistics on science and technology. Data is required by Eurostat on Government expenditure and on the numbers employed in research and development in the public sector.
OECD ‘International data collection on resources devoted to research and development’.2
Strategy for Science, Technology & Innovation. Indicators collected are included in the
SSTI Indicators report to identify issues arising and resulting policy requirements.
The metrics analysed in the report include:
Chapter 1: State funding of research and development
Government Budget Appropriations and Outlays on Research and Development
(GBAORD).
Data on Government Departments / Agencies funding by area of research and as a
percentage of GNP & international comparisons.
Chapter 2: Expenditure on R&D performed in the Public Sector
Government Expenditure on Research and Development (GOVERD). R&D performed in
Government Departments and their Agencies.
Chapter 3: Human resources dedicated to publically performed R&D
Data on the overall totals, gender, qualifications and occupations of R&D staff.
The survey is carried out using the definitions, rules and guidelines set out in the OECD Frascati Manual3. This allows for a common dataset to be collected across all OECD and EU countries which facilitates better international comparisons and benchmarking.
1 Commission Regulation (EC) No 995/2012 of 26 October 2012
http://eur-lex.europa.eu/LexUriServ/LexUriServ.do?uri=OJ:L:2012:299:0018:0030:EN:PDF
2 Main Science and Technology Indicators (MSTI) , OECD
http://www.oecd.org/science/innovationinsciencetechnologyandindustry/msti.htm
3OECD (2002), Frascati Manual: Proposed Standard Practice for Surveys on Research and Experimental
Data on GBAORD, GOVERD and human resources is also prepared under European statistical legislation. All international comparison figures relate to the most recent data available for each country.
The findings from this survey complement the findings from the other R&D performance surveys conducted by Forfás and the Central Statistics Office. These include the Business Expenditure R&D survey (BERD) and the Higher Education R&D performed survey (HERD). The total performance of R&D in the State is then added to create the Gross Expenditure on R&D (GERD) metric.
Forfás would like to thank the many respondents to this survey who have taken the time to gather information and complete the data requests for this key area of Government policy.
For further information on this survey please contact:
Deborah Quinn Forfás Wilton Park House
Cha
dev
In this decade 1.1 R&D, a order t and th the fol Figure4 OECD
Deve
apter 1:
velopme
report Gove e and bench
Types of as defined by
to increase t he use of this llowing R&D
GBAORD – G chapter) This is all t the econom Agencies. GOVERD – M This is the a agencies. Total annua expenditure illustrates t Ireland.
e 1: Gross e
(2002), Frasc lopment, OEC
: State
ent
ernment spenmarked agai
research a y the OECD, the stock of s stock of kn internationa
Government
he money al my e.g. withi
Measure of R actual expen
al expenditu e to business the elements
expenditure
cati Manual: P CD, Paris, www
e fundin
nding on res nst internati
and develop “comprises knowledge, owledge to d al data meas
Budget Appr
located by G n the educa
R&D performe nditure on R&
re on R&D is s and higher s which com
on R&D (GE
roposed Stand
w.oecd.org/st
ng of re
earch and de ional compe
pment indi creative wo including kn devise new a sures:
ropriations o
Government tion sector,
ed in the Go &D performe
s estimated b education R mprise the Gr
ERD) - eleme
dard Practice ti/frascatiman
esearch
evelopment etitors. cators rk undertake nowledge of applications”or Outlays on
to R&D to be by businesse
overnment se ed in Govern
by adding Go R&D expendi ross Expendit
ents
for Surveys o
nual
h and
(R&D) is cha
en on a syste man, culture ”.4 This repo
n R&D – Spen
e performed es or by Gove
ector (Chapte nment depart
ovenerment ture amount ture on R&D
n Research an
arted for the
ematic basis e and society ort focuses o
nding (this
d in all secto ernment
er 2) rtments and
performed R ts. Figure 1
1.2 Government budget spending on research and development
The internationally recognised indicator for benchmarking State-funding performance of R&D is the Government Budget Appropriations and Outlays on R&D metric (GBAORD), which includes:
funding for R&D programmes in the higher education sector administered by the
Department of Education and Skills, the Higher Education Authority (HEA), Science Foundation Ireland (SFI) and others;
funding for business sector R&D, administered via State agencies including IDA Ireland,
Enterprise Ireland and others; and
funding for Government sector-performed R&D e.g. Teagasc, The Marine Institute, and
[image:10.595.104.491.370.571.2]others.
Figure 2: GBAORD trend in current prices, €m. (2003-2012)
As can be seen, rapid gains were made in State R&D spending over the last decade. While there is a decline in allocated expenditure in the last four years, the level of R&D funding from the State remains significant, with an allocation of €796m in 2012.
Although there has been a drop in State funding sources from the EU over the last five years, this has been overshadowed by a more rapid slowdown in direct exchequer sourced funding for R&D activities.
528
635
739
784
915 948 909
838
802 796
0 100 200 300 400 500 600 700 800 900 1000
1.3 Detailed Government department spending on research and development Table 1 provides a breakdown of estimated public R&D spending by the main administrating Government departments and agencies.
The largest agency funding R&D projects in 2012 was the Higher Education Authority, which has allocated an estimated €225.2m to R&D activities (or 28.3 per cent of the total State spending on R&D). This spending includes expenditure on R&D programmes and indirect funding via the HEA block grant to supported institutions. The HEA also allocates direct funding via the Programme for Research in Third-Level Institutions (PRTLI) on behalf of the Minister for Jobs, Enterprise and Innovation.
[image:11.595.76.508.338.698.2]The next largest funder of R&D activities was Science Foundation Ireland, allocating an estimated €161m (20.2 per cent) to R&D in 2012 via research grants and other research supporting programmes.
Table 1: Main Government Departments and Agencies with spending on R&D activities (2012 estimates)
Funding Department/Agency 2012
€m % of Total
Higher Education Authority 225.2 28.3%
Science Foundation Ireland 161.0 20.2%
Enterprise Ireland 112.0 14.1%
IDA Ireland 63.4 8.0%
Teagasc 58.3 7.3%
Health Research Board 37.3 4.7%
Dept. of Agriculture, Food and the Marine 28.4 3.6%
Irish Research Council for Science Engineering and Technology 20.1 2.5%
Dept. of Jobs, Enterprise and Innovation 19.2 2.4%
Irish Research Council for Humanities and Social Science 10.7 1.3%
Environmental Protection Agency 9.6 1.2%
Others 50.8 6.4%
Total €796m 100%
€225.2 million - The Higher Education Authority’s (HEA) research programme is designed to enhance the research capabilities, capacity and infrastructure of Ireland’s higher education institutions. These investments have been divided into a portfolio of programmes across disciplines spanning humanities and social sciences, the biosciences and technology and innovation sectors. Research is funded from the core grant which is allocated to institutions and the internal allocation of funds between teaching and research is a matter for each institution.
€161 million - Science Foundation Ireland (SFI) was established in 2000 to support globally competitive scientific research. SFI funds a variety of academic researchers and research teams which aim to promote research excellence in biotechnology, information communication technology (ICT), sustainable energy and energy efficient technologies. The allocation of finance is decided by SFI on the basis of scientific merit. In line with the recommendations of the Report of the Research Prioritisation Steering Group, SFI is committed to supporting scientific research in areas with the greatest potential for economic return.
€112 million – Enterprise Ireland (EI) is the national organisation responsible for bringing together innovation, business development and internationalisation for Irish industry. They aim to facilitate collaborative links between enterprise and the research community that will lead to the practical application of research in business. As such, EI offers a variety of supports and funding to companies that wish to engage in R&D.
€63.4 million - IDA Ireland has national responsibility for securing new investment from overseas in manufacturing and international services, and for encouraging the existing foreign enterprises to expand their business. The Research, Development & Innovation (RD&I) Support programme is designed to support companies at all stages of RD&I and enable them to move from start-up R&D, through developing capacity and adding competence, to a fully integrated RD&I function. Support levels are tied to an assessment of strategic objectives, in conjunction with commercial and technical assessments
€58.3 million – Teagasc, the Agriculture and Food Development Authority, is the Irish institute responsible for research in agricultural production, the environment and the rural economy. The annual research portfolio comprises 300 research projects, carried out by 500 scientific and technical staff in research centres throughout Ireland. The four main research areas are: Animal and Grassland; Crops, Environment and Land Use; Rural Economy and Development and Food
€37.3 million - The Health Research Board’s (HRB) research funding role provides support for projects, programmes and fellowships in health research through an open competition process, along with an element of peer review. Funding covers all areas of health research from biomedical, translational, clinical and practised-based research through to population health and research concerning the health services.
development expenditure in 2011 was concentrated in the areas of crop improvement, veterinary and meat laboratory R&D activities, food and agricultural production and improvement of livestock genetic resources in plants and animals.
€20.1 million - The Irish Research Council for Science, Engineering and Technology (IRCSET)5 funds R&D in science, engineering and technology in third-level institutes. It
seeks to position Ireland as an international centre of excellence and achievement in research. It does this through a series of programmes of assistance, postgraduate research awards and the PhD fellowship scheme.
€19.2 million – The Department of Jobs, Enterprise & Innovation has a wide economic development and job creation remit. Within the Department, the Office of Science, Technology and Innovation (OSTI) is focussed on delivering this goal through the development, promotion and co-ordination of national science, technology and innovation policy, and by progressing the Strategy for Science, Technology and Innovation. In support of these aims, the Department manages Ireland’s membership of the European Space Agency (ESA) (a principal objective of this membership is to promote opportunity for high-technology industry in Ireland) and the European Molecular Biology Laboratory (EMBL) (an Inter-Governmental Research Organisation whose mission is the development of molecular biology throughout Europe). Membership of EMBL complements Ireland's significant investment in the biotechnology area by presenting opportunities for research training, networking and enhanced international collaboration.
€10.7 million – The Irish Research Council for Humanities and Social Science (IRCHSS)6
funds cutting-edge research in the humanities, social sciences, business and law with the objective of creating new knowledge and expertise beneficial to Ireland's economic, social and cultural development. IRCHSS Government of Ireland Post-Graduate Scholarships and Government of Ireland Post-Doctoral Fellowships fund research at pre- and post-doctoral levels. Three schemes offer research opportunities for members of the academic staff of recognised third-level institutions to undertake stated projects (Government of Ireland Senior Research Scholarships, Government of Ireland Research Fellowships and Government of Ireland Senior Research Fellowships). Finally, Government of Ireland Research Project Grants fund world-class innovative research undertaken on an extended or group project basis.
€9.6 million – The Environmental Protection Agency supports R&D activities in a range of environmental areas. This work is carried out by researchers in third-level institutions, state agencies, Government departments, local and regional authorities, the private sector and individuals. The EPA research programme for the period 2007-2013 is entitled Science, Technology, Research and Innovation for the Environment (STRIVE). The purpose of the programme is to protect and improve the natural environment by addressing key environmental management issues through the provision of world-class scientific knowledge generated through a vibrant, competitive programme of research developed supported and co-ordinated by EPA.
5 On 29th March 2012, The Irish Research Council for Science, Engineering and Technology (IRCSET) and
The Irish Research Council for Humanities and Social Science (IRCHSS) were merged into the new Irish Research Council
1.4 Programmes classified by area of research
[image:14.595.88.515.163.531.2]The total expected GBAORD for 2012 can be classified into a number of economic areas:
Table 2: GBAORD classifications7 for Ireland 2012
2012 - €m
R&D financed from sources other than General University Funds (GUF) 252.4
Industrial production and technology 183.0
R&D financed from General University Funds (GUF) 164.2
Agriculture 99.3
Health 39.8
Exploration and exploitation of space 14.8
Environment 10.0
Political and social systems, structures and processes 8.6
Energy 7.8
Education 7.7
Transport, telecommunication and other infrastructures 6.1
Exploration and exploitation of the earth 2.3
Total €796m
Over half of total GBAORD funding for 2012 was allocated for R&D performed in higher education. This €416m includes funding for various agencies, such as Science Foundation Ireland, the Higher Education Authority’s PRTLI (Programme for Research on Third-Level Institutes) and other research funding bodies operating in the higher education sector.
Industrial production and technology, which accounts for 23 per cent of total GBOARD and is expected to reach €183m in 2012 is an important category of R&D funding.
Agriculture at €99.3m accounted for 12.5 per cent of total Government spending on R&D programmes while health accounts for 5 per cent of total spend.
The remaining GBAORD is divided between exploration and exploitation of space and the earth, the environment, energy, political and social systems, transport, telecommunications and other infrastructures and the exploration and exploitation of the earth.
7
1.5 In orde recom Frasca from t In Figu increa been a €796m Figure The GB activit The pe during From 2 nomina Since 2 a redu
8 OECD
Develop
9 GNP 2
http:
GBAORD er to compar
mends using ati Manual8. G
he EU. It als
ure 3 the GBA se in state R a downward m down by €1
3: GBAORD
BAORD inten ty divided by
eriod 2004 to a period of
2008 the GBA al economic
2010, GBAOR uction in the
D (2002), Frasc pment, OECD,
2012 – forecas //www.finan
as a percen re state fund g the GBAORD
GBAORD incl so includes fu
AORD trend R&D spending
trend in the 52m (16 per
trend (€m) a
nsity ratio [St y Gross Natio
o 2007 saw t strong fundi
AORD intensi growth.
RD intensity amount of f
cati Manual: P , Paris, www.
st €130.8, Dep ce.gov.ie/doc
ntage of GN ding of R&D a D indicator w ludes funding unding for R
line shows th g from €528m last four ye r cent) comp
and GBAORD
tate R&D fun onal Product
he GBAORD ing arising ou
ity rate rose
has remaine funding.
Proposed Stan
oecd.org/sti/fr
partment of Fi cuments/publ
NP and inte across intern with data de
g for R&D fro R&D in the hu
hat between m to €948m ears with the pared to the
D as a percen
nding for R& (GNP)] has r
intensity rat ut of strong
e as a result o
ed consistent ndard Practice frascatimanual inance, Mediu lications/othe ernational c national com erived using t om direct ex umanities an
n 2003 and 2 by 2008 in c e allocated 2 2008 figure
ntage of GNP
&D activities risen over th
tio hover ove economic gr
of strong R&
t at around 0
e for Surveys o
l um-Term Fisca er/2012/midte comparison mpetitors, the the guideline xchequer sou d social scie
008 there wa urrent prices 012 GBAORD of €948m.
P (2003-2012
as a per cen he last decad
er 0.50 per c rowth.
&D spending o
0.6 per cent
on Research a
al Statement, ermfiscnov201
ns e OECD es set out in urces and als ences.
as a rapid es. There ha
D figure of
)
nt of econom de.
cent - this wa
outpacing
of GNP9 des
Table 3: GBAORD as a percentage of economic activity (GDP/GNP)10
Alongside this overall funding, we can also examine the civil GBAORD figures. Civil GBAORD is a good metric for international comparisons as it does not include the defence portion of the R&D budget, for which Ireland does not allocate any sum of money.
Country 2002 2011
Finland 0.95% 1.07%
Portugal 0.63% 1.02%
Denmark 0.73% 1.02%
Germany 0.74% 0.87%
Estonia 0.39% 0.79%
Norway 0.70% 0.79%
France 0.77% 0.78%
Netherlands 0.81% 0.78%
Austria 0.67% 0.77%
Sweden 0.68% 0.76%
Spain 0.54% 0.67%
Czech Republic 0.46% 0.66%
EU 27 0.64% 0.65%
Ireland GNP 0.47% 0.63%
Belgium 0.60% 0.63%
United Kingdom 0.50% 0.51%
Ireland GDP 0.39% 0.50%
Slovak Republic 0.29% 0.46%
Australia 0.51% 0.46%
United States 0.47% 0.42%
Greece 0.26% 0.28%
10 OECD – Main Science & Technology Indicators, Jan 2013, Vol. 2012/2. All GBAORD data used in these
Over t perfor In Irela to 0.63 same p Figure Finland OECD c develo investm
11 OECD
graphs
he last ten y mance relat
and the GBA 3 per cent of period was 0
e 4: Internat
d, with GBAO countries. opment or 0.
ment levels
D – Main Scien are ‘civil’ GB
years most O ive to econo
AORD intensit f GNP in 201 0.39 per cent
tional compa
ORD spendin In 2011, Irel 50 per cent of our Europ
ce & Technolo AORD i.e. ex
OECD countri omic activity
ty ratio also 1. The inten t in 2002 com
arison of GB
ng of 1.07 pe and invested of total GDP pean partner
ogy Indicators cludes defenc
es have seen y.
increased in nsity ratio fo mpared to 0.
BAORD as a p
er cent of GD d 0.63 per ce P. This leve rs at 0.65 pe
s, Jan 2013, V ce expenditur
n an improve
n this period or R&D invest .50 per cent
percentage o
DP, is one of ent of GNP o el of intensity
r cent.
Vol. 2012/2. A re.
ement in GBA
from 0.47 p tment agains in 2011.
of GDP/GNP
the stronges on research a y is in line w
ll GBAORD da AORD
per cent in 20 st GDP for th
P (2011*)11
st performin and
with the
ata used in the 002 he
ng
Figu
Figu the cent
The com
12OE
ure 5: Avera
ure 5 shows t data is avail t though, as
average ann mpared with a
ECD – Main Sci
age annual g
the annual a lable. Luxem shown in Ta
nual growth an EU-27 cou
ience & Techn
growth rate
verage grow mbourg stand able 3, this w
rate of Irela untries avera
nology Indicat
e of GBAORD
wth rate of G ds out with a was from a lo
and’s GBAOR age of 4 per
tors, Jan 2013
D for selecte
BAORD since an annual av ow base.
D for the las cent.
3, Vol. 2012/2
d countries,
e 2002 for al verage increa
st 10 years is
. All GBAORD
, (2002–201
l countries w ase of 21.2 p
s 5.3 per cen
data used in 1)12
where per
nt
Cha
dev
Resear agenci The fu other s gather Develo Expend can be contin 2.1 To Gover The ex sector report decrea Figure below GOVER in Figu This gr per ce Figure13 GNP
http:
apter 2:
velopme
rch and deve ies is measur
unding for Go sources but d red in a sepa opment (HER diture on R& e calculated. ues to be Te
otal expen rnment sec xpectation fo in 2012 is th ed at €96m ase of approx
6 below sho €100 but ha
RD as a perce ure 6.
raph shows t nt in 2003 to
e 6: GOVERD
2012 – foreca //www.finan
: Expe
ent per
elopment pered using the
overnment E does not inc arate survey RD) survey. W &D) data, the
. As can be s eagasc.
diture on r ctor
or expenditu hat it remain in 2012 dow ximately 1 p
ows that GOV ave been mai
entage of GN
that, as a pe o 0.07 per ce
D as a percen
st €130.8, De ce.gov.ie/doc
nditure
rformed
rformed by r e GOVERD m
xpenditure o lude R&D pe conducted b When GOVER e cumulative een later in
research an
ure on resear ns at approxi n slightly fro per cent.
VERD expend intained in t
NP over the t
rcentage of ent in 2012.
ntage of GN
partment of F cuments/publ
e on res
d in the
relevant Govetric.
on R&D (GOV erformed in t by Forfás titl RD is combine e Gross Expe
this chapter
nd develop
rch and deve imately the om €97m in 2
diture levels the last three
ten-year per
GNP13, the l
P and GOVE
Finance, Medi lications/othe
search
e public
vernment de VERD) comes the higher e led, the Highed with the nditure on R r, the main p
ment perfo
elopment pe same level a 2011 which r
dropped in e years and n
riod from 200
evel of GOV
ERD €m trend
um-Term Fisc er/2012/midte
and
c secto
partments a
s from public ducation sec her Education
HERD and BE R&D for the c performer of
ormed in th
rformed in t as 2011. Exp represents a
2009 and aga now stand at
03 to 2012 is
ERD has drop
d, (2003-20
al Statement, ermfiscnov201
or
and theirc, private an ctor which i
n Research a ERD (Busines country (GER f GOVERD he the Governm penditure is marginal
ain in 2010 t t €96m.
s also illustra
pped from 0
012)
[image:19.595.87.481.535.739.2]Figu Figu be s larg tota econ Othe (6.3 cont More by i Tab Cou Ge Slo Un Fin Cze
ure 7: Major
ure 7 illustra seen, Teagas gest performe
al GOVERD). nomy sector
er major con 3 per cent) a
tribution to
e detailed in ndividual pro
ble 4: GOVER
untry rmany ovenia ited States nland ech Republic
r State resea
tes the majo sc, the Irish a er of Govern Teagasc sup rs.
ntributors in nd the Econo GOVERD from
nformation o ogramme is
RD as a perc
arch and dev
or contributo agriculture a nment R&D in pports scienc
clude the De omic and Soc m the Marine
on research s available in
entage of G
velopment p
ors to in-hou and food dev n 2012, with ce-based inno
epartment o cial Researc e Institute is
spending in t Appendix 5. GDP, selected 2002 0.34 0.34 0.32 0.35 0.26 performers,
use R&D in th velopment au h expenditure ovation in th
f Agriculture h Institute a s €3.6m (3.7
the Governm d countries 200 0.3 0.3 0.3 0.2 0.3
per cent of
he State sect uthority, con e of €60m (6 he agri-food
e, Food and t t €6.2m (6.5 per cent).
ment sector b
(2002, 2007 07 35 35 32 29 31
f total (2012
tor in 2012. ntinued to b 62.9 per cent and broader
the Marine a 5 per cent).
by institution
7, 2011)14
France 0.37 0.34 0.32
OECD 0.27 0.26 0.28
Luxembourg 0.16 0.21 0.27
Norway 0.26 0.25 0.27
Poland 0.25 0.20 0.26
Spain 0.15 0.22 0.26
EU – 27 countries 0.24 0.23 0.25
Netherlands 0.24 0.22 0.22
Estonia 0.12 0.09 0.19
Hungary 0.33 0.24 0.19
Slovak Republic 0.15 0.16 0.19
Belgium 0.14 0.15 0.18
Canada 0.21 0.19 0.18
Italy 0.20 0.17 0.17
United Kingdom 0.17 0.16 0.16
Israel 0.24 0.18 0.16
Austria 0.12 0.13 0.15
Portugal 0.14 0.11 0.11
Ireland/GNP 0.10 0.09 0.08
Denmark 0.18 0.08 0.07
In Table 4 above, GOVERD as a percentage of GNP15 in Ireland is compared with GOVERD as a percentage of GDP in countries where data is available. The most recent data for 2011 is compared with data from 2002 and 2007.
Ireland had the second lowest intensity rate from the selected countries with 0.08 per cent in 2011 compared with an EU-27 average of 0.25 per cent. There is a concentration in Ireland on increasing the R&D performance in the higher education part of the overall research system. Note that the figures for Higher Education Research & Development (HERD) are not included in this survey. Another reason for Ireland’s low ratio is the relatively small size of the Irish public sector compared to other countries.
15 GNP is used as a more accurate denominator for Ireland to reflect the large multinational base in
2.2 Types of Research
The type of research being performed in the various Government departments and agencies is also measured in this survey. The OECD Frascati Manual defines the three categories of research as follows:
Basic Research – experimental or theoretical work undertaken primarily to acquire
new knowledge, without any particular application or use in view;
Applied Research – original investigation undertaken in order to acquire new
knowledge, primarily directed towards a specific practical aim or objective; and
Experimental Development - systematic work, drawing on existing knowledge gained
[image:22.595.95.512.356.507.2]from research and practical experience that is directed at producing new materials, products and devices, to installing new processes, systems and services, or to improving substantially those already produced or installed.
Table 5: GOVERD by type of research (2011-2012)
Type of Research 2011 2012
€m. % of total €m. % of total
Applied Research 66.3 68.4% 65.3 67.9%
Basic Research 19.7 20.3% 19.1 19.9%
Experimental Development 10.9 11.3% 11.7 12.2%
Total €96.9 100% €96.1 100%
Of all allocated funds for research to be undertaken by Irish Government departments and agencies in 2012, 67.9 per cent is in applied research, with expenditure amounting to €65.3m. Basic research accounts for 19.9 per cent of total funding and stands at €19.1m. Experimental development accounts for 12.2 per cent of all expenditure at €11.7m.
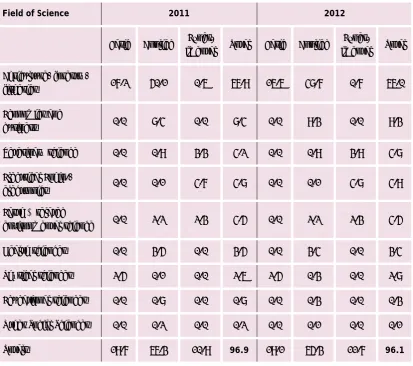
2.3 Fields of science16
[image:23.595.77.491.175.541.2]The fields of science classifications are defined by the OECD Frascati Manual in agreement with European nations.
Table 6: Field of science classified by type of research, (2011-12) €m.
Field of Science 2011 2012
Basic Applied Exper-
imental Total Basic Applied
Exper-imental Total
Agriculture, forestry,
fisheries 17.2 50.1 0.6 67.9 16.6 48.7 0.7 66.0
Economics and
business 0.0 8.4 0.0 8.4 0.0 9.3 0.0 9.3
Veterinary science 0.0 0.9 3.3 4.2 0.0 0.9 3.9 4.8
Electrical Engin.,
electronics 0.0 0.1 4.7 4.8 0.0 0.1 4.8 4.9
Earth & related
environmental science 0.0 2.2 2.3 4.5 0.0 2.2 2.3 4.5
Health sciences 0.0 3.5 0.0 3.5 0.0 3.4 0.0 3.4
Physical sciences 2.5 0.1 0.0 2.6 2.5 0.3 0.0 2.8
Educational sciences 0.0 0.8 0.0 0.8 0.0 0.3 0.0 0.3
Other Social Sciences 0.0 0.2 0.0 0.2 0.0 0.1 0.0 0.1
Totals 19.7 66.3 10.9 96.9 19.1 65.3 11.7 96.1
The majority of funds spent on research performed in the public sector is spent on applied research, this amounted to an allocation of €65.3m out of a total spend of €96.1m in 2012 and €66.3m out of a total spend of €96.9m in 2011.
Applied research in agricultural sciences continues to be the field of science in which most expenditure takes place. In 2012, €48.7m was spent on applied science in this area with €16.6m on basic research and another €0.7m spent on experimental development.
The major performer of R&D in the Government sector is Teagasc which, along with the Department of Agriculture, Food and the Marine, are engaged in the field of agricultural sciences.
Other agencies working in this field are Bord Iascaigh Mhara, the Inland Fisheries Board and the Marine Institute.
16
Chapter 3: Human resources dedicated to publicly
performed research and development
Personnel engaged in R&D activities performed in institutions within the Government sector are examined in this chapter. The data was collected from survey returns from 35
Government departments and agencies and relates only to personnel working in research and development in the Government sector. It does not include R&D personnel in the higher education or business sectors.
The survey seeks to ascertain the amount of time spent by staff on R&D activities or in Full-Time Equivalent (FTE) terms, in addition to gathering information on the overall totals, gender, qualifications and occupations of R&D staff. The research personnel are divided into PhD and non-PhD researchers, technicians and other support staff. A researcher spending 70 per cent of their time on research activities equals one researcher in headcount terms, and 0.7 researchers in FTE terms. Gathering information on the time spent by Government sector researchers and research support staff, specifically on R&D work, allows for more robust benchmarking with comparable data from other countries.
3.1 Research and development personnel
[image:24.595.129.477.506.679.2]Based on estimates, it is anticipated that there will be a decrease of 13 per cent in 2012 in the overall number of research personnel employed in the Government sector. The total number of research personnel was 1,196 in 2011 and are expected to total 1,039 in 2012 (Figure 8). The overall trend is also down 9 per cent on the total research personnel 2010 number of 1,133.
Figure 8: Total R&D personnel by occupation - headcount terms (2010-2011-2012)
It is estimated that the number of PhD researchers decreased by 13 per cent between 2011 and 2012, while researchers without a PhD have decreased by 27 per cent.
The numbers of technicians are estimated to decrease by 9 per cent in 2012 over 2011 and there is also a decrease in the number of research support staff of 7 per cent in 2012.
361
246 238
288 370
229
275 322
323
167
251
298
0 100 200 300 400 500 600
Researchers with
PhDs without PhDsResearchers Technicians Other Support Staff
Figure In ‘full 2012, s 3.2 Figure suppor full-tim Figure
e 9: Total R&
l-time equiv supported by
Gender a 10 shows a rt staff), as a me equivalen
e 10: Resea
&D personne
alent’ terms y 442.5 FTE
and qualific breakdown o a percentage nt terms.
rchers by ge
el by occupa
s, there were technicians
cations of S of Governme e of the tota
ender and q
ation – full-t
e 536.4 FTE and other su
State secto ent research al, by gender
ualification ime equival researchers upport staff. As ill of FT quali of FT degre 20.2 resea empl with of the other Gove r research er grades (ex r and type of
- full time e
Male Ph continue employe represe total. M level (14 cent of Female per cent research research account cent. ents (FTEs),
in the Gover
ustrated her TE R&D perso fication, whi TE R&D perso ees below Ph
per cent of G arch personn
oyed at tech the remainin e FTE total, r support rol rnment rese staff xcludes tech f qualificatio equivalents D researche e to dominat ed in the Gov nting 35.2 pe Male research
44) account total researc
PhDs (115) r t of Governm hers with fem hers below P ting for anot
, (2012)
rnment Sect
re, 31 per ce onnel hold a ile 23.7 per onnel hold hD level.
Government nel were
hnician level ng 25 per ce working in les for earchers.
hnicians and on, for 2012,
(FTEs), (20
rs (188.9) te the numb vernment se er cent of th hers below P
for 26.8 per chers.
represent 21 ment
male PhD level
[image:25.595.119.303.204.382.2] [image:25.595.117.300.558.731.2]3.3 Research and development staff by fields of science (FTE)
[image:26.595.87.521.230.544.2]Of the total 537 PhD and non-PhD (FTE) researchers employed in the Government Sector in 2012, 333 were male and 204 were female, and the following table sets out their fields of science.
Table 7: Total male/female and as percentage of total by field of science, FTEs (2012)
Fields of Science Male
Researchers Male researchers as % of all male researchers
Female Researchers
Female researchers as % of all female researchers
Agriculture, forestry and fisheries 156.6 47.0% 90.8 44.6%
Electrical Engineering, electronics 79.0 23.7% 20.0 9.8%
Physical sciences 41.0 12.3% 14.0 6.9%
Economics and Business 35.7 10.7% 39.5 19.4%
Veterinary science 6.5 2.0% 0.0 0.0%
Earth & related environmental sciences 5.5 1.7% 5.1 2.5%
Educational sciences 3.0 0.9% 2.6 1.3%
Health sciences 3.0 0.9% 30.0 14.7%
Other social sciences 2.4 0.7% 0.9 0.4%
Environmental Engineering 0.3 0.1% 0.7 0.3%
Total 332.9 100% 203.6 100%
When analysed by the OECD standard fields of science17, the following statistics emerge for 2012. The majority of the Government researchers work in the ‘agricultural, forestry and fisheries’ field. Some 47 per cent of all male researchers and 44.6 per cent of female researchers are engaged in research and development work in this area.
The next largest category for men is ‘electrical engineering & electronics’ with 23.7 per cent of male R&D staff working in this area. For women the next two areas are ‘economic & business’ with 19.4 per cent and the ‘health sciences’ with 14.7 per cent.
In terms of the numbers of researchers, there are more or as many male researchers in every Field of Science with the exception of ‘health sciences’, ‘economics and business’ and ‘environmental engineering’.
(Note that these percentages are based on a small population sample)
17
Figure
Figure for ma FTEs in
e 11: Resear
11 below ill ale and fema n 2012 was 5
rchers classi
lustrates the ale researche 536.5.
fied by gend
e gender brea ers in full-tim
der and maj
akdown with me equivalen
jor field of s
hin the diffe nts number (
science (FTE
rent major f (FTE). The t
E), (2012)
fields of scie total number
Appendix 1
Methodology
The information given in this report relates to information supplied by 35 institutions in receipt of monies from the exchequer for the performance or support of research and
development. In general, institutions and information relating to them are listed separately. In a few cases an institution is listed with its parent department or organisation but identified separately.
Expenditure data for specific programmes refer to the 2011 outturn costs of programmes and to the expected costs in 2012. The outturn costs are mainly funded by matching grant-in-aid or voted monies. Where programmes are funded in other ways these monies are noted separately. In these instances, the expenditure (cost) data shown includes both exchequer and other income contributions.
Expenditures are based on unaudited figures, except in a few cases where they are identical with a vote by the Oireachtas. For convenience, general overheads, where shown, are distributed in proportion to programme expenditures.
Programmes are attributed to the institution most directly involved - that is to those actually operating them, but not necessarily funding them. An example of the latter is the
Department of Jobs, Innovation and Employment which funds, but does not operate or manage programmes. Only their own administrative costs are attributed to the funding institutions in such cases.
Appendix 2
Definition of Research & Development
For the purpose of this survey research and development is defined as:
Research:
Original, experimental or theoretical investigations undertaken to acquire new knowledge, with or without a particular application or use in view.
Development:
Appendix 3
Government Departments and Agencies included in the 2011-2012
Science Budget
Government Departments Associated Agencies
Department of Agriculture, Food and the Marine
Bord Iascaigh Mhara Marine Institute Teagasc
Department of Arts, Heritage and the
Gaeltacht Údarás na Gaeltachta
Department of Communications, Energy and Natural Resources
Inland Fisheries Ireland
Sustainable Energy Authority of Ireland
Department of Education and Skills
Dublin Institute for Advanced Studies FÁS
Higher Education Authority
Irish Research Council for Humanities and Social Sciences
Irish Research Council for Science, Engineering and Technology
Department of Jobs, Enterprise & Innovation
Enterprise Ireland Forfás
IDA Ireland InterTradeIreland
Science Foundation Ireland Shannon Development
Department of the Environment, Community and Local Government
Environmental Protection Agency Met Éireann
Radiological Protection Institute of Ireland
Department of Finance Economic and Social Research Institute
Department of Health Health Research Board
Department of the Taoiseach National Economic and Social Council
Department of Transport National Roads Authority
Offices
Central Bank and Financial Services Authority of Ireland
Appendix 4
Acronyms
BERD Business Expenditure on R&D
CSO Central Statistics Office
DIAS Dublin Institute for Advanced Studies
EPA Environmental Protection Agency
ESRI Economic and Social Research Institute
FÁS Foras Áiseanna Saothair – National Training and Employment Authority
FTE Full Time Equivalent
GBAORD Government Budget Appropriations and Outlays on R&D
GERD Gross Expenditure on R&D
GOVERD Government Expenditure on R&D
HEA Higher Education Authority
HERD Higher Education Expenditure on R&D
HC Head Count
HRB Health Research Board
IRCHSS Irish Research Council for the Humanities and Social Sciences
IRCSET Irish Research Council for Science, Engineering and Technology
NESC National Economic and Social Council
NRA National Roads Authority
OPW Office of Public Works
OST Office of Science and Technology - Department of Jobs, Enterprise and Innovation
RPII Radiological Protection Institute of Ireland
SEAI Sustainable Energy Authority of Ireland
Appendix 5:
Government Departments and Agencies' Programmes
Department of Agriculture, Food and the Marine
The Department of Agriculture, Food and the Marine (DAFM) is a multi–functional organisation which provides a wide range of services directly and through specialist state agenciesoperating under its aegis. Its mission is to lead the sustainable development of a competitive, innovative, consumer focused agriculture, food, fishery and forestry sector and contribute to a vibrant rural and coastal economy and society.
The Department operates a number of testing centres and laboratories, in the areas of, veterinary diagnostics and research; meat control; seed testing; plant variety testing; cattle performance testing; pesticide control and dairy products control.
It should be noted that the figures below refer only to research expenditure by DAFM itself, as the agencies under DAFM’s responsibility (Teagasc and the Marine Institute) complete their own separate returns. DAFM engages in a broad range of R&D activities and these are outlined below with corresponding figures for the 2011 expenditure outturn and the 2012 expenditure allocation.
2011 €’000
2012 €’000 Research and development programmes – Funded In-House
R&D-Related Veterinary Laboratory Activities
Operation of a central veterinary research laboratory at Backweston, Celbridge, Co. Kildare, regional veterinary research laboratories at Cork, Limerick, Sligo, Athlone and a testing laboratory in Waterford.
Improvement of Crops
Improving the quality of crops and crop products through the use of the highest quality varieties and seeds. The main activities leading to achievement of this objective include the operation of two stations/farms at Fermoy in Co. Cork and Backweston in Co. Dublin, where plant varieties are evaluated, the operation of a potato laboratory at Raphoe in Co. Donegal and the carrying out of trials in farmers’ fields throughout the country.
Research and development programmes – Funded Elsewhere
Institutional Food Research – Competitive Funding Programme
In its implementation of the Food Institutional Research Measure of the RTDI component of the Productive Sector OP under the National Development Plan 2000 – 2006 and 2007 - 2013, the Department is involved in the management of competitive tendering by food research institutions for grant aid to support food research in priority areas. It monitors the progress of successful projects, payment of grant aid and evaluation of the
programme.
4,134
940
14,946
4,903
1,150
Agricultural Production Research- Competitive Funding Programme
This is the Research Stimulus Fund measure of the Productive Sector OP of the NDP 2000-2006 and NDP 2007-2013 which encourages co-operative research in agricultural
production. This involves management of competitive tendering by research institutions for grant aid to support agricultural research projects in priority areas, monitoring of progress of successful projects, payments of grant aid and evaluation of the programme.
COFORD- Competitive Funding Programme.
COFORD was subsumed into DAFM on 1st August 2009. The figures mentioned here relate to grant payments to research institutions under the COFORD research programme of the Productive Sector OP of the NDP 2000-2006 and NDP 2007-2013 which supports the economic, environmental and social goals of forest policy through funded research aimed at developing national forest research capacity and competence.
Improvement of Livestock
Improving the quality of livestock and livestock products through adoption of better breeding and selection practices carried out in Irish Cattle Breeding Federation (ICBF). The main activities leading to achievement of these objectives are operation of on-farm and central testing stations; recording schemes; collaboration with and support for research in animal breeding at research institutions and at the Irish Equine Centre, Co. Kildare which undertakes R&D activities relating to equines.
Genetic Resources in Plants and Animals
The Department of Agriculture, Food and the Marine’s grant aid scheme for the
conservation of genetic resources for food and agriculture has been in place since 1996. The Scheme has an annual call for projects aimed at supporting the conservation and sustainable use of genetic resources for food and agriculture. Projects are evaluated by an advisory committee, representing broad national stakeholder interests.
International Equine Institute
Based in University of Limerick the Institute receives a grant payment from DAFM to work on issues of relevance to the equine industry.
5,795
3,199
964
275
270
8,404
3,000
914
252
Department of Agriculture, Food and the Marine
Bord Iascaigh Mhara
BIM is the Irish State agency with responsibility for developing the Irish Sea Fishing and Aquaculture industries. BIM was established under the Sea Fisheries Act 1952. BIM’s mission is “to promote the sustainable development of the Irish seafood industry at sea and ashore and support its diversification in the coastal regions so as to enhance its contribution to
employment, income and welfare both regionally and nationally”.
€’000 2011
€’000 2012
Research and Development Programmes
Marine Technical
The objectives of the Marine Technical Section are to progress development of
responsible fishing practices addressing environmental and sustainability issues through technical innovation and technology transfer. The section carries out sustainability-orientated projects, aimed at promoting the use of more selective gear types and protection of key fisheries together with identifying ways to reduce operating costs through diversification into alternative, fuel-efficient fishing methods.
74 76
Resource Development
The primary focus of the Resource Development Section work programme will see the further development of mechanisms by which the industry can compete in the
marketplace through increased quality. At the core of this strategy is the development of quality schemes for the catching sector that are suitable for integration into the QSP programme. This will enable Irish fishermen to compete at the highest levels of quality and traceability now demanded by the consumer.
12 12
Inshore Fisheries
The primary function of the inshore fisheries section is the implementation of the framework for the management of the major inshore stocks announced by the Minister in 2004. The work involves establishing species advisory groups and drawing up management plans for important inshore fisheries. Monitoring of stocks in support of management and the further development of applied research programmes are funded through the NDP in support of the framework.
33 33
MEPS - Marine Environment Protection
The Marine Environment Protection Measure has been developed in accordance with Article No. 37 and 38 of Council Regulation (EC) No 1198/2006 of 27 July. The Measure facilitates projects to address issues of environmental concern, particularly those intended to protect and develop the marine environment.
522 500
Seafood Development Value Adding Scheme
Business Development and Innovation Programme Seafood Development Centre
Department of Agriculture, Food and the Marine
Marine Institute
The Marine Institute has the general functions “to undertake, to co-ordinate, to promote and to assist in marine research and development and to provide such services related to marine research and development that in the opinion of the Institute will promote economic
development, create employment and protect the marine environment” (Marine Institute Act, 1991). The key services delivered by the Marine Institute include:
Research
The Marine Institute's activities, in relation to marine research, fall into three main areas: 1. Research Performer: The Marine Institute undertakes research (both applied and
experimental development) through its operational programmes and also through leading and participating in many national and international research projects. 2. Research Funder: The Marine Institute administers the Marine Research
Sub-Programme of the National Development Plan 2007-2013.
3. Research Promoter, Coordinator and Catalyst: As the lead implementing agency for
Sea Change – A Marine Knowledge, Research & Innovation Strategy for Ireland 2007-2013, the Institute co-ordinates and promotes marine research, bringing together industry, higher education institutions and Government bodies to support the development of Ireland’s knowledge economy and the marine sector.
Monitoring, Data Collection and other Technical Services
The Institute carries out statutory and non-statutory monitoring and data collection to underpin the development of the marine sector and the sustainability of the marine environment and resource aimed at:
Food safety monitoring (e.g. biotoxins, residues, microbiology);
Managing fisheries resources (including migratory stocks);
Understanding and monitoring the marine environment and climate change (e.g.
hazardous substances, nutrients, phytoplankton);
Implementing environmental directives (e.g. EU Birds & Habitats Directives); and
Monitoring & auditing impact of marine economic activity.
Provision and Formulation of Scientific, Technical and Strategic Policy Advice
The Marine Institute provides advice to a range of national and international agencies and departments which supports both national and EU policy decisions across all marine sectors. This includes the formulation of EU Marine Science Policy & Programme Development.
Sectoral Development
The Marine Institute has developed world-class marine research infrastructure including: HQ & Laboratory Complex (54 labs) in Oranmore, Co. Galway; an Aquaculture & Catchment Management Research Facility in Newport, Co Mayo; two multi-purpose National Research Vessels, a remotely operated vehicle (ROV); an Ocean Energy Test & demonstration site in Galway Bay; and a range of specialist scientific equipment and data management facilities.
€’000 2011
€’000 2012
Research and Development Programmes
Marine Institute R&D Programmes
The Marine Institute is a significant research performer - competing for and securing funds from both national and international (EU FP and INTERREG) funding sources. This research supports the provision of Government services, including the provision of policy advice; underpins the competitiveness and market accessibility to Irish seafood production (fisheries and aquaculture) through a range of scientific research
assessment and monitoring programmes spanning fisheries resources, marine environment monitoring and marine food safely. In addition to the Institute’s direct participation in externally funded research projects, the Institute also participates in marine research via in-kind contribution e.g. through the provision of research facilities/infrastructure for projects that are complementary to the Institute’s core activities.
3,534 3,601
NDP 2007-2013: Marine Research Sub-Programme
The Marine Institute administers on a competitive basis the national marine research funding programme: Marine Research Sub-Programme of the 2007-2013 National Development Plan. Research funding is awarded on a competitive basis for ‘applied’ marine-related R&D in line with the objectives set out in Sea Change. The Institute administers and manages the following categories of funding:
Project-Based Awards: Strategic Research Projects, Applied Research Projects, Demonstration Projects and Desk/Feasibility Studies;
Researcher Awards: Strategic Research Appointments, Research
Capacity/Competency Building, Post-Doctoral Fellowships and PhD Scholarships;
Industry-Led Research Awards: Company Awards and Collaborative Awards; and
Infrastructure Awards: Infrastructure Acquisition and Access to Infrastructure, e.g. Shiptime.
Department of Agriculture, Food and the Marine
Teagasc
Teagasc, the Agriculture and Food Development Authority, is the leading organisation in the fields of agriculture and food research in Ireland undertaking research in four main areas:
Animal and Grassland
Crops, Environment and Land Use Rural Economy and Development Food
Teagasc partners with many other research providers, particularly Irish Universities in conducting research and works closely with may industry organizations, such as the Irish Cattle Breeding Federation, Bord Bia, Animal Health Ireland and Enterprise Ireland in delivering on shared priorities.
€’000 2011
€’000 2012
Research and Development Programmes
Animal & Grassland Research and Innovation Programme
The aim of the Teagasc Animal and Grassland research and Innovation Programme is to increase the profitability, competitiveness and sustainability of Irish livestock
production through research and innovation. The programme incorporates all animal (dairy cows, cattle, sheep and pigs) and grassland science, livestock systems research into a single programme thus positioning Teagasc as one of the leading international authorities on pasture-based systems of animal production.
The objective of the animal component of the programme is to generate and procure new knowledge to support innovation in the key areas of Irish livestock production including breeding, nutrition, growth, reproduction, health, product quality, labour efficiency and facilities that will underpin the future profitability, competitiveness and sustainability.
The objective of the grassland component of the programme is to generate and procure evidence-based knowledge to support innovation in the key areas of Irish grass
production including grass breeding, growth, fertilisation, utilisation, nutritional value, and develop grazing systems that will underpin the profitability, competitiveness and sustainability of the sector and enhance food security.
Crops, Environment and Land Use Programme
The aim of the Teagasc Crops, Environment and Land Use programme is to develop and transfer cost-effective crop production systems, along with evidence-based knowledge to support and underpin the development of an environmentally sustainable,
competitive and profitable agri-food sector. This will be achieved by focusing on:
Crop science: to develop cost effective crop production systems, including crops for energy and bio-processing, which improve competitiveness, profitability and product quality, and minimise impact on the environment.
Forestry development: develop forests and forest management systems that maximize the potential of farm forestry from economic, social and environmental perspectives.