In-Vitro, Ex-Vivo Characterization of Furosemide
Bounded Pharmacosomes for Improvement of Solubility
and Permeability
Vivekanand K. Chatap
2, Prashant L. Patil
1, Savita D. Patil
1,*1Department of Biopharmaceutics, H. R. Patel Institute of Pharmaceutical Education and Research, Shirpur, Dist-Dhule, Maharashtra,
India, 425405
2Department of Pharmaceutics, H. R. Patel Institute of Pharmaceutical Education and Research, Shirpur, Dist-Dhule, Maharashtra, India,
425405
*Corresponding Author: [email protected]
Copyright © 2014 Horizon Research Publishing All rights reserved.
Abstract
The design of the present investigation was to prepare furosemide bounded pharmacosomes to enhance solubility and permeability drug by simple reproducible solvent evaporation technique and further investigated. Furosemide bounded pharmacosomes formulation (PMC1 & PMC2) was taken and compared with pure drug by way of enhanced solubility 5.4 fold in the water, 3.33, 4.76 fold in pH 7.4 and pH 5.8 respectively, increases permeability of furosemide bounded pharmacosomes 28.28% when compared with pure drug, drug content showed 94.83, N-octanol/water partition coefficient from 2.33 to 5.15 and in-vitro release profile exhibits excellent sustained drug release properties. Prepared furosemide bounded Pharmacosomes were confirmed from differential scanning calorimetry (DSC), X-ray diffraction (XRD) and FT-IR. The pharmacosomes reported amphiphilic nature may responsible for the improvement of solubility and permeability leads to enhancement of oral bioavailability. From this study it can be concluded that, this formulation strategy becomes important for drug belongs to the BCS class- II & IV.Keywords
Furosemide, Phospolipid, Pharmacosomes, In-Vitro, Ex-VivoGraphical Abstract
1. Introduction
Recently more than 40% active pharmaceutical ingredients developed over the year in the pharmaceutical industry are having poor bioavailability, and the formulation development of poorly soluble as well as poorly permeable substances for oral delivery present great challenges to researchers in the pharmaceutical industry1.In the case of BCS class IV drug, drug dissolution also permeation is the rate limiting step in the process of drug absorption1.
[image:1.595.326.544.535.639.2]Furosemide (FRMD) (fig. 1) is 5-(aminosulphonyl) -4-chloro-2-[(2-fuanyl-methyl) amino] benzoic acid, a potent high ceiling (loop) diuretic, mainly used in the treatment of hypertension. It is a BCS class IV drug that is of low solubility (6 mg/L in urine) and low permeability (log P o/w 1.4)2, 3. Furosemide inhibits the active reabsorption of chloride ions in the thick ascending limb of the loop of Henle by binding to one of the Cl- binding sites of the Na+/ 2Cl-/ K+ Co-transport system4.
Figure 1. Structure of furosemide.
tension and at higher concentrations exhibit mesomorphic behavior. This decrease in the interfacial tension leads to an increase in the contact area, thereby increasing bioavailability of drugs5.
In this research, furosemide bounded pharmacosomes (Furo–SPC) was studied in order to improve oral bioavailability of furosemide6, 7. The phospholipid molecular structure includes a two fat-soluble tails and water soluble head. Because of this dual solubility or amphiphilic nature, the phospholipid acts as an effective emulsifier6.
The objective of this research is that a) furosemide-phospholipid complex was prepared by simple method; b) the physicochemical characters of furosemide bounded pharmacosomes were evaluated, such as DSC, XRD and FT-IR. The n-octanol/water partition coefficient (P) study of the furosemide – SPC was performed in order to measure the improved solubility properties of furosemide–SPC in comparison with furosemide6,7. c) Compared with those of the furosemide, the rat abdomen permeability of furosemide bounded pharmacosomes was studied.The complex prepared on furosemide-phospholipid exhibits good physicochemical properties, might be the candidate for future clinical study8.
2. Materials and Methods
2.1. Materials
Furosemide was procured as gift sample from Torrent pharma. Ltd. Ahmedabad. Soya phosphatidylcholine (SPC) (Lipoid s 75-3) was kindly provided as a gift sample by lipoid Gmbh Germany. All other chemicals were of analytical grade.
2.2. Preparation of Furosemide Bounded Pharamacosomes
Furosemide-SPC complex was prepared by associating furosemide with different molar concentration of SPC. The different molar concentration of the SPC and furosemide were placed in a 100-mL round bottom flask and dissolved in methyl alcohol. The solvent was evaporated under vacuum at 60 °C in a rotary vacuum evaporator (Perfit Model No. 5600, Buchi type, Perfit Ltd., India). The pharmacosomes were collected as the dried residue and placed in a desiccator overnight and then subjected to characterization9.
2.3. The Yield of OMT “Present as a Complex” (%)
The furosemide–SPC prepared as above description was dispersed insufficient dichloromethane (5 ml/mg furosemide–SPC). The complex and phospholipids both were easily checked up in the dichloromethane, but the furosemide was practically insoluble in the dichloromethane. The furosemide non-complexes was sedimented and separated to assay. The yield of furosemide “present as a
complex (%) was defined using following formula equation. 100% a b The yield a − = ×
Where a was the content of furosemide “present as a complex”, b was the content of furosemide “no-present as a complex” in the complex10.
2.4. Determination of the Content of Furosemide in Phospholipids Complex
The contents of furosemide in the complex were determined spectrophotometrically. A powder of 10 mg of the complex equivalent to the drug was dissolved in 10 ml of acetone and stirred for 2 h on a magnetic stirrer. The absorption of furosemide in the complex was determined by making suitable dilution and, measuring the absorbance of the result so obtained at 228 nm11.
2.5. Solubility of Pharmacosomes Complexes
Furosemide pharmacosomes complexes solubility was found out by preparing saturated solutions in 5.8 phosphate buffer ,7.4 phosphate buffer, 1.2 pH buffer distilled water at 37°C ± 0.5°C and continually shaken into mechanical orbital shaker (Remi mechanical shaking incubator, Bombay) up to 24 hrs. Withdrawn samples were filtered through a 0.45 µm
membrane filter (Millipore, India) followed by dilution and
analyzed spectrophotometrically at 228 nm, respectively (UV/Vis Spectrophotometer, Shimadzu-1800) 12.
2.6. Partition Coefficient
Partition Coefficient of Furosemide determination of furosemide material, pharmacosomes was carried out by adding 40mg of pharmacosomes equivalent to dug, furosemide to a series of 10mL water solutions in sealed glass containers at 25°C, respectively. Each experiment was executed in triplicate for each term. All the liquids were agitated for 24 h and centrifuged to remove excessive residues (15 min, 8000 rpm), respectively. Each liquid was added 10mL n-octanol and agitated for 24 h. And so they were centrifuged at 8000 RPM for 15 min, respectively. The water phase and n-octanol phase were separated. The water phase and n-octanol phase were filtrated through a 0.45μm
membrane, respectively. Suitable dilution were made, the concentrations of furosemide were measured respectively10.
2.7. In-Vitro Dissolution Studies
The dissolution profile of pure furosemide,
pharmacosomes formulation were determined in a dissolution apparatus (Electrolab TDT-08l plus) following the USP paddle method. All tests were conducted in 900, 5.8 phosphate buffer. The dissolution medium was maintained at a temperature of 37 ± 0.5℃ with a paddle rotation speed at 50 rpm. Aliquots (5 ml) withdrawn at various time intervals
and assayed for drug content spectrophotometrically (shimandzu- 1800) at 228 nm, The absorbance values were transformed into concentration by reference to a standard calibration curve obtained experimentally, The in vitro dissolution test was performed in triplicate for each batch13, 14.
2.8. Ex-Vivo Permeation Study
Ex vivo permeation study of Pharmacosomes and pure furosemide through the rat abdomen membrane was performed using Franz- diffusion cell at 37°C ± 0.2°C and 50rpm. The membrane was stored in buffer at 4°C upon collection. After the abdomen membrane was equilibrated for 30 min with a buffer solution, the membrane was placed between both the chambers, the receiver chamber was filled with fresh pH 7.4 buffer solution. The Pharmacosomes and furosemide was placed in donor chamber and suspended with 1ml of buffer solution (pH 5.8) Aliquots (3 ml) were collected at predetermined time intervals and filtered through a filter paper, and the amount of drug permeated was then determined by measuring the absorbance at 228 nm using a UV spectrophotometer. The medium which was pre warmed at 37°C was then put back into the receiver chamber15.
2.9. Drug-Release Kinetics
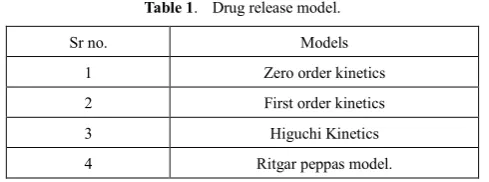
[image:3.595.56.301.469.560.2]The kinetics of furosemide release from the Pharmacosomes were determined by fitting the curves to distinct models (summarized in Table no. 1). The criterion for selecting the most appropriate model was based on a goodness-of-fit test8.
Table 1. Drug release model.
Sr no. Models
1 Zero order kinetics
2 First order kinetics
3 Higuchi Kinetics
4 Ritgar peppas model.
Characterization of Furosemide–SPC Complex 2.10. Particle Size Determination
The particle diameter and size distribution of Pharmacosomes were analyzed by using the Malvern Zetasizer (Malvern instrument, Zetasizer 2000, UK). Samples were cut with distilled water to make the recommended scattering intensity of 100 000 counts/s. Each sample was measured in triplicate in the analysis. The values
(d50) were expressed for Pharmacosomes as mean size range16.
2.11. Fourier Transforms Infrared (FT-IR) Spectroscopy
The FTIR study of phospholipids, pure furosemide, the physical mixture and phospholipids complex was carried out to identify the functional group shifting. For FTIR spectroscopy, sample and dried KBR were mixed. Then the IR spectrum was taken on a FTIR spectrophotometer (IR Infinity, Shimadzu) by the DRS technique (Diffuse reluctant substance) 17.
2.12. Differential Scanning Calorimetry (DSC)
The samples sealed in the aluminium crimp cell were heated at the speed of 5℃/min from 0 to 300℃ in the air of nitrogen (Mettler Toledo). The peak transition onset temperature was determined by means of an analysis. The peak transition onset temperatures of phospholipids, pure furosemide, the physical mixture and phospholipids complex were compared18.
2.13. X-ray Powder Diffraction (XRPD)
The crystalline state of furosemide in the different samples was measured using X-ray powder diffraction. Diffraction patterns were obtained on a Bruker axs- D8 Discover Powder X-ray diffractometer, Germany. The X-ray generator was operated at 40kV tube voltages and 40mA tube current, using the K a line of copper as the irradiation source. The scanning angle ranged from 1 to 80°. Furosemide, SPC (Lipoid S-75-3), physical mixture and the prepared complex were analysed19.
2.14. Scanning Electron Microscopy (SEM)
To detect the surface morphology of the pharmacosomes, SEM of the complex was recorded on a scanning electron microscope20.
2.15. Stability Study
The purpose of stability testing is to provide evidence on how the quality of a drug substance or drug product varies with time under the influence of a variety of environmental factors such as temperature, humidity and light and to establish a re-test period for the drug substance or a shelf life of the drug product and recommended storage conditions.
3. Results and Discussion
3.1. Preparation of Furosemide–Phospholipid Complex
We prepared furosemide–phospholipid complex, according to the different quantity ratio of phospholipids and drugs, such as PMC1 (1:1), PMC2 (1: 2). The outcomes indicated that when the ratio was 1 or more than 1 the drug content also get increased, For the purpose to find the best tone and use the fewest quantity of phospholipids, at last we prepared furosemide–phospholipid complex in term of the quantity ratio 1:2. The yield (%) for the pharmacosomes batches showed 62.93% and 93.70% in PMC1, PMC2 respectively.
3.2. Solubility Studies
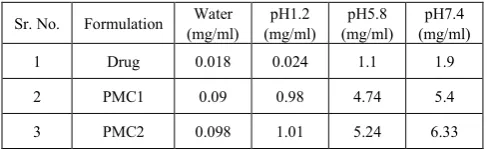
Solubility of the furosemide and furosemide complex was found to be much higher (in water and various buffers). Table no.2. Provides the solubility data. The increase in the solubility of furosemide in the complex can be explained by the solubilisation resulted from the formation of micelle in the medium. As an amphiphilic surfactant, phospholipids could increase the solubility of the drug by the action of wetting and dispersion. The complex showed an amphiphilic nature, which in turn may prove to be responsible for improved solubility, which may lead to enhancement of bioavailability of the drug.
[image:4.595.312.554.131.202.2]The information showed that furosemide pharmacosomes was increased water solubility of furosemide at 5.4 fold and in the event of buffer, it increases the solubility of 3.33, 4.76 fold in pH 7.4 and pH 5.8 respectively.
Table 2. Solubility study of furosemide and Pharmacosomes.
Sr. No. Formulation (mg/ml) Water (mg/ml) pH1.2 (mg/ml) pH5.8 (mg/ml) pH7.4
1 Drug 0.018 0.024 1.1 1.9
2 PMC1 0.09 0.98 4.74 5.4
3 PMC2 0.098 1.01 5.24 6.33
3.3. Partition Coefficient
Solubility of the furosemide complex was found to be much higher (in water and n octanol) than the furosemide. Table no 2. Provides the solubility data. Table no.3. Shows the n-octanol/water partition coefficient (P) of furosemide, the and furosemide Pharmacosomes at n-octanol/water The data showed that Pharmacosomes significantly increased the lipophilicity of furosemide, and the Partition of furosemide Pharmacosomes in n-octanol and water significantly, these were due to the strong dispersibility or/and amphiphilic
nature of the Pharmacosomes and a polar group of furosemide were masked by phospholipids.
Table 3. n-octanol/water partition coefficient data of furosemide and Pharmacosomes.
Sr.no Solvent Furosemide PMC4 PMC5
1 n-octanol 0.042mg/ml 0.35 mg/ml 0.51 mg/ml
2 water 0.018 mg/ml 0.095mg/ml 0.099mg/ml
3 P value 2.33 3.68 5.15
3.4. In-vitro dissolution Study of Furosemide & Pharmacosomes
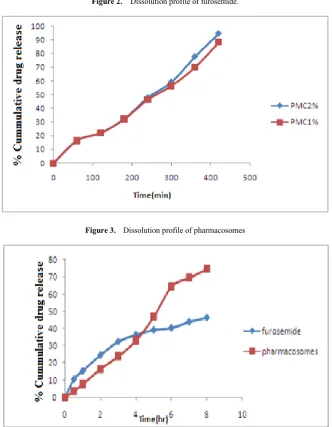
The furosemide has been classed as a class IV drug as per the biopharmaceutical classification system (BCS) as an outcome of its low solubility and oral bioavailability; one of the major causes of its low oral bioavailability is its solubility. These also clearly indicated in figure no.2. Also that at the end of 120 min only 62.95% furosemide had been released and it remains constant up to 165 min so it indicates the less drug release. The furosemide–phospholipid complex showed better dissolution profile than the furosemide (Fig. No. 3). Unlike the free furosemide (which showed a total of only 62.95 % drug release at the end of 120 min in fig no.2.) furosemide complex showed 88.48%drug release in PMC1 and 94.71% drug release in PMC2 at the end of 420 min of dissolution study in pH 5.8 buffer. The solid dissolution is a complex operation influenced by a great number of factors, not only the particle size. Differences in crystal habit, surface area, surface energies, particle size and wettability may all play a role in affecting the dissolution rate of the powder. Phospholipids being an amphiphilic surfactant increased the solubility of the drug by the action of wetting and dispersion. And that’s why the dissolution profile of the complex was found to be improved.
3.5. Ex-Vivo Permeation Study
[image:4.595.56.300.484.559.2]Figure 2. Dissolution profile of furosemide.
Figure 3. Dissolution profile of pharmacosomes
[image:5.595.139.472.280.708.2]Figure 5. Particle size distribution of pharmacosomes.
Figure 6. Zeta potential of pharmacosomes.
Figure 7. FTIR spectra of A) SPC B) furosemide C) Physical mixture D) Pharmacosomes
Characterization of Furosemide-SPC
3.6. Particle Size Distribution and Zeta Potential
Figure no. 5 and 6 presents the size and zeta potential of pharmacosomes after slightly shaking in distilled water, The size, and zeta potential, of the prepared pharmacosomes solution is characterized by Malvern zetasizer. The mean particle size and potential centered at the maximum intensity peak is about 361.8 nm and -26.9 respectively for the pharmacosomes samples. All particles were below 1000 nm.
3.7. Fourier Transforms Infrared (FT-IR) Spectroscopy
[image:6.595.135.475.214.591.2]showed the changes in peaks in complexes and places from that of furosemide and SPC. FT-IR spectra of pharmacosomes (complex) showed significant differences in peak from that of components and that of physical mixtures. Furosemide showed the characteristic IR (Kbr) peaks of N-H stretching at 3401cm-1, N-H stretching in sulfonamide at 3353 and 3287 cm-1. The C=O stretching, vibration was at 1674 cm-1, S=O stretching, vibration at 1144cm-1, most important stretching vibration was o-H stretching at 3122cm-1.The O-CO- stretching vibration at 1674 cm-1 in furosemide has been changed to the higher wave number side in the pharmacosomes (complex) with medium absorption band at 1735 cm-1. –OH stretching at 3122 cm-1 was diminished because there was shifting of hydrogen from it.
The –CN stretching in the phosphatidylcholine at 1236 cm-1 (strong band) has shifted to 1244 cm-1 in the pharmacosomes (complex) .Thus the FTIR spectra indicate the interaction of SPC with furosemide – COOH group.
3.8. Differential Scanning Calorimetry (DSC)
DSC is a fast and reliable method to screen drug- excipient compatibility and provides distinct information about the potential interactions. In DSC, an interaction is concluded by
elimination of endothermic peaks, appearance of new peaks, change in peak form and its onset, peak temperature-melting point and relative peak area or heat content. Figure no.8. The thermogram of furosemide showed a single broad exothermic peak at 221℃ 18.
Thermogram of phospholipids exhibits a broad endothermic peak at 78℃. Physical mixture of furosemide and phospholipids shows two sharp peak one at 221℃ and another one at 78℃. The thermogram of the pharmacosomes (complex) shows a single peak, which differs from the peak of furosemide. It is evident that the original peaks of furosemide disappear from the thermogram of Pharmacosomes (complex). This showed that furosemide may interact with phospholipids and the interaction is hydrophobic in nature.
[image:7.595.130.476.373.575.2]There is also some contribution of hydrogen bonding apart from the hydrophobic interaction in the furosemide – phospholipids interaction. The –OH groups of the furosemide are involved in bonding. The interaction of furosemide with the polar component of phospholipids, make the long hydrocarbon tail of phospholipids to turn freely and ‘entrapped’ the polar head of phospholipids containing the furosemide.
Figure 9. XPRD spectra of a) furosemide b) physical mixture c) Pharmacosomes.
Figure 10. SEM of furosemide bounded pharmacosomes.
3.9. X-ray Powder Diffraction (XRPD)
To determine whether the alterations in the furosemide crystal morphology correspond to a polymorphic transition and to examine the strong state of furosemide phospholipid complex, XRPD analysis was taken. From these shapes, the level of crystallinity could be assessed utilizing the relative integrated intensity of reflection peaks in the given range of
reflecting angle, 2θ. The value of 2θ means the diffraction
angle of ray beams, which is shown in the abscissa of Fig.no.9.
The XRPD of furosemide showed major significant peak intensity at 5.95, 18.9, 20.36, 21.28. The crystalline peak of pure drug diminish into Pharmacosomes which indicating that the furosemide was converted into amorphous at major
form in phospholipid complex. The disappearance of furosemide crystalline diffraction peaks confirmed the formation of phospholipid complex.
3.10. Scanning Electron Microscopy (SEM)
[image:8.595.137.476.401.558.2]We could see that phospholipids did not subsist in the appearance of the drug, but drug uniformly dispersed in phospholipids and formed the social system of disc shaped. On the other hand the surface of the complexes prepared with the highest purity grades of phospholipids (70 %) show rough, non-sticky and free running nature.
3.11. Drug-Release Kinetics
Mathematical models such as zero-order, first-order, and Higuchi’s and Ritger–Peppas models are usually used to describe the kinetics of the drug release from the test formulation. The zero-order kinetics describes the systems where the drug release rate is independent of time and drug concentration of the dissolved substance. The first-order kinetics describes systems where the drug release rate depends on its concentration. The Higuchi model indicate that the drug release is controlled by diffusion mechanism. The Ritger–Peppas model provides a better understanding of the mechanisms for the controlled release.
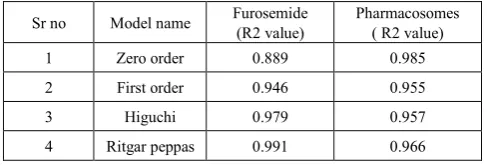
[image:9.595.310.555.254.322.2]The criterion for selecting the most appropriate model was based on a goodness-of-fit test. Representative regression coefficients (R) obtained by fitting experimental release data to distinct models are shown in Table. no 4 and 5.
Table 4. The regression coefficient of furosemide release from Pharmacosomes in Ex-vivo.
Sr no Model name Furosemide (R2 value) Pharmacosomes ( R2 value)
1 Zero order 0.889 0.985
2 First order 0.946 0.955
3 Higuchi 0.979 0.957
4 Ritgar peppas 0.991 0.966
Table 5. The regression coefficient of furosemide release from pharmacosomes In-vitro
Sr no Model (R2value) PMC1 (R2 value) PMC2 Furosemide (R2 value).
1 Zero order 0.988 0.984 0.942
2 First order 0.853 0.806 0.974
3 Higuchi 0.932 0.926 0.976
4 Ritgar-peppas 0.991 0.987 0.995
From the table no.4 and 5, it is observed that the R value is the largest when fitted to the Ritger–Peppas model as opposed to the other model, which indicates a Ritger–Peppas release from these aggregates. When n approximates 0.43, a Fickian diffusion controlled release is implied. However, for n = 1, the drug release occurs as an apparent zero-order mechanism (transport case II), which is not dependent on time. Values of n between 0.43 and 1 are an indication of anomalous transport (not Fickian). The criterion for selecting the most appropriate model was based on a goodness-of-fit test. The release exponent are 1.38, 1.35, 1.19 for PMC4, PMC5 and furosemide respectively, in case of Ex-vivo release exponent are 1.33 and 1.58 for Pharmacosomes and furosemide respectively. Hence the value of release
exponent indicates apparent zero-order mechanism (transport case II), which is not dependent on time.
3.12. Stability Studies
After storage Pharmacosomes powder were analyzed for various parameter like drug content, % drug release in case of dissolution profile, Infra-red spectroscopy for checking bond status and physical appearance. No major difference was found between evaluated parameters before and ageing/storage and all are in acceptable limits. Therefore formulation remains stable for sufficient time. Results were shown in table no. 6
Table 6. Evaluation parameter indicating stability.
Sr
no. Evaluation parameter stability Before
After 1 month storage After 2 month storage After 3 month storage.
1. Drug content 94.83% 94.21% 92.61% 90.09%
2. release. % drug 93.59% 93.18% 91.58% 90.14%
4. Conclusion
In the present work, a Furosemide-phospholipid complex (Pharmacosomes) was organized by a si
m
ple and reproducible method and evaluated for various physicochemical parameters. The IR, DSC and XRD studies showed that there was more or less interaction between furosemide and phospholipid and formed some sort of bond that may be covalent bond, hydrogen or van der Waals forces. The pharmacosomes had enhance aqueous as well as n-octanol solubility as compared to pure drug also the furosemide release behaviour from pharmacosomes showed excellent sustained release property. The prepared molecule not only showed biological activity, but also amphiphilic nature. The release and permeation mechanism of furosemide pharmacosomes follows the Ritger-Peppas model. The absorption behaviour from intestine requires further in-vivo studies.Acknowledgements
The author gratefully acknowledge Dr. S. B. Bari, Principal, H. R. Patel Institute of Pharmaceutical Education and Research, Shirpur for providing necessary facilities to carried out the research work. Authors are also thankful to UICT, NMU, Jalgaon for carried out the XRPD, FESEM study.
REFERENCES
[image:9.595.56.300.394.478.2][2] Chaulang g, Patil. k, Ghodke d., Khan s., Yeole p., Research J. Pharm. and Tech, (2008), 1(4), 386-389.
[3] Goud r.n., Gangavaram s., Kuthuru s., Pal s., Manjunatha s. g., Nambiar s., Nangia a., (2012), Journal of Pharmaceutical Sciences, 101, 664–680.
[4] Tom b. v., Andrea j. a, M. van der ven, (1999), J. Pharm. Pharmacol. 51, 239-248.
[5] Goyal t., Rawat a. s., Chauhan m, (2012),International Journal of Pharmacy and Pharmaceutical Sciences, 4, (3), 25-29. [6] Peng-fei y., Hai-long y., Xian-yi l , Ming y, Wei-feng z.,
(2010), International Journal of Pharmaceutics, 387, 139–146.
[7] Pathan, r.a., Bhandari, u., (2011), Journal of Dispersion Science and Technology, 32(8), 1165-1172.
[8] Yue j., YUXIA l., Fei q., Lanxia z., Zhonghao l., RSC Advances, (2012), 2, 6905–6912.
[9] Semalty, a., Semalty, M., Singh d., Rawat, m.s.m., 2010, International Journal of Pharmaceutical Sciences and Nanotechnology, (3)2,940-946.
[10] Peng-fei y., Qin z., Bin w., Ming y., Mu-sheng w., Hai-yan z., Peng-yi hu, Zhen-feng wu, 2012, Pharmaceutical Development and Technology, 17(1): 94–102.
[11] Kumar m., Ahuja m., SHARMA s.k., Sci Pharm. 2008, 76, 761–774.
[12] Semalty a., Semalty m., Singh d., Rawat m.s.m. 2010, Indian journal of pharmaceutical sciences, 72(5), 576-581.
[13] United State Pharmacopeia, National Formulary, 2004, the official compendia of standard, asian edition, pp.844-846. [14] Semalty a., Semalty m., Singh d., Rawat m.s.m, 2009, Acta
Pharm. 59, 335–344.
[15] Krishna v. ravi, y., Rao madhusudhan, K p.chinna. sujatha, 2011, Int. J. Drug Dev. & Res., 3 (4), 351-361.
[16] Chadha r., Gupta s., Pathak n., 2012, Drug Development and Industrial Pharmacy, 38(12): 1538–1546.
[17] Xin j, Zhen-hai z, E sun, Xiao-bin t, Fen-xia z, Xiao-bin j, A, 2012, Drug Development and Industrial Pharmacy, 1-10. [18] Tahereh khazaeinia, Fakhreddin jamali, 2003, J Pharm
Pharmaceut Sci, 6(3),352-359.
[19] Fude cui , Kai shi a, Liqiang zhang a, Anjin tao a, Yoshiaki kawashima, 2006, Journal of Controlled Release, 114, 242–250.