Available online www.jocpr.com
Journal of Chemical and Pharmaceutical Research, 2012, 4(3):1546-1552
Research Article
ISSN : 0975-7384
CODEN(USA) : JCPRC5
Development of paptodes for determination of hydrazine in water and its
application in biological samples and pharmaceutical tablet
Anita Baghel
aand Sulbha Amlathe
b*a
Department of Chemistry, Barkatullah University, BUIT, Bhopal(M.P.), India
b
Department of Chemistry, BUIT, Barkatullah University, Bhopal(M.P.), India
______________________________________________________________________________
ABSTRACT
A new disposable chemo-strip is developed for detection and determination of hydrazine. The sensor was constructed by immobilizing vanillin and oxalic acid on TLC (Thin layer chromatography) paper. In this method hydrazine is coupled with vanillin in acidic medium and formed yellow aldazine product. The products are detected by scanner. Changes in RGB values of color spots on TLC strips create a pattern. The obtained pattern was analyzed by “MATLAB software”. Degree of color spot was found to be proportional to the concentration of the tested analyze i.e. hydrazine. The proposed sensor is linear in concentration range of 1.92-6.72µg/ml of hydrazine. Effective intensity, Reproducibility, SD, RSD have been calculated. The reaction time, concentration of reagent, stability of sensor has been optimized. The method has been successfully applied for the determination of hydrazine in waste water, biological and pharmaceutical samples.
______________________________________________________________________________
INTRODUCTION
Hydrazine has the formula N2H4 is a colorless liquid with an ammonia-like odour. Hydrazine is highly toxic and
dangerously unstable, and is usually handled while in solution for safety reasons. Hydrazine is mainly used as a foaming agent, but uses as a precursor to polymerization catalysts and pharmaceuticals. Hydrazine hydrate and its derivatives react with benzothiazole derivatives and synthesized newly compound wear evaluated for antibacterial activity. Hydrazine is also used as rocket fuels and to prepare the gas precursors used in air bags. Hydrazine is extensively used in many industries like power plant to reduce corrosion of metal pipes and fittings. Hydrazine derivative is isonicotinylhydrazine (INH) is also Isoniazid is one of the most common drugs used for Tuberculosis. It is inexpensive, effective and easy to take. It can prevent most cases of Tuberculosis. The threshold limit value for hydrazine by ACGIH is 0.1ppm (TWA) and recommended exposure limit for hydrazine by NIOSH is 0.03ppm (2-hour).[1-9]
Several methods have been described in the literature for the determination of hydrazine using different analytical techniques such as voltammetry[10-13], spectrofluorimetry[14-15], spectrophotometry[16-20] and titrimetry[21] Many methods have been suggested for the determination of hydrazine based on its basic character or reducing property. Spectrophotometric methods are more useful for the determination of hydrazine at low concentration level, but these methods suffer from poor linear dynamic ranges and some of them require expensive instruments.
Sulbha Amlathe
et al
J. Chem. Pharm. Res., 2012, 4(3):1546-1552
______________________________________________________________________________
Previously, Gupta and coworkers had developed test paper for detection and semi-quantitative determination of hydrazine in water and air [25, 26] later on using the same principle Abbaspour et al. introduced paptode. They have developed paptode for determination of iron and hydrazine [27, 28] further Sharma and Amlathe developed paptode for determination of arsenic [29].
The proposed method describes the development of paptode for determination of hydrazine. In the proposed method, paptode is prepared by immobilizing vanillin (2-hydroxy-1-napthaldehyde) as chromogenic reagent on TLC strips followed by drying of the paper then oxalic acid was immobilized on TLC strips and again it is dried. A yellow product was formed on TLC strips after injection of hydrazine on paptode. Hydrazine is coupled with vanillin in acidic medium, resulting yellow aldazine product forms a particular pattern on an inert support [30]. The product on TLC strips are detected by scanner and obtained pattern was analyzed with program written in visual basic 6.0 (VB6).
EXPERIMENTAL SECTION
Apparatus and software
In the spot test analysis commercially available flatbed-scanner (HP SCANJET G2410) is used for obtaining the images of color spots. The obtained images have been transferred to computer for analysis and determination.
A specific area has been selected for analysis of color spot. The number of pixels that can be indicated by this area was about 10000–300000 and this program can average these pixels. Therefore, the signal to noise ratio can be increased dramatically. Area of the spots, which were used to measure the color intensity, was a square with 90000 dpi (300_300 dpi).The spots were perfectly homogeneous. Resolution of the scanner was regulated at 300 dpi. For analyzing color values in RGB (red, green, blue) system, the software, which was written in visual basic media, was used. A mircolit-mircopipate was used for injecting samples paptode.
The experimental data can be saved to analyse with more powerful scanner in future, short response time of paper optode, portability and user friendly application are some advantages of the method.
Chemicals and reagents
Hydrazine solution: 1 %( v/v) stock solution of hydrazine hydrate was prepared in 10% of 2M hydrochloric acid.
Vanillin: 2% (w/v/) solution was prepared in 25% aqueous ethanol.
Oxalic acid: 2 %( v/v) solution was prepared in double distilled water.
Preparation of paptode
To construct the sensor strips for hydrazine, strips of TLC was dipped into known concentration of the vanillin and dried then dipped into known concentration of oxalic acid for few seconds and again dried. Aliquots of 48µl of hydrazine solution containing 3.84µg/ml were injected on these TLC strips. Then after formation of yellow color (Aldazine product), the stripes were scanned and images of spots was analyzed by software system for finding their R, G and B values. The RGB color model is an additive color model in which red, green and blue light are added together in various ways to produce a broad array of colors. Any color can be analyzed to obtain its corresponding R, G and B value. Effective intensity for any color values of color spot was calculated as follows:
Ar = –Log (Rs/Rb) Ag = –Log (Gs/Gb) Ab=–Log(Bs/Bb)
Ar, Ag and Ab are effective intensities for red, green and blue color. Rs, Gs, Bs and Rb, Gb and Bb refer to R, G and B values of sample and blank respectively. To obtain calibration curves, effective intensities of R, G and B values were plotted with respect to analyte concentrations.
RESULTS AND DISCUSSION
Sulbha Amlathe
et al
______________________________________________________________________________
Optimization of the reaction conditions
Injection volume: The influence of volume of the analyte solution which must be inject
investigated. The optimum sample volume was obtained to be 48µl. With greater injected volume spot spreading occurs due to diffusion and consequently the intensity of color was decreased.
Effect of vanillin: The TLC strips were p
Then 48µl of standard solution containing 03.84µg/ml of
micropipette and effective intensity of the R, G and B values were The maximum color intensity was observed at 2
experimental work. (Fig1)
Where
Effective intensity is the antilog of RGB values of sample to RGB of blank Ar = effective intensities for R values
Ag= effective intensities for G values Ab= effective intensities for B values
Effect of oxalic acid concentration:
method. Different concentration of oxalic acid were prepared
allowed to dry. After drying 48µl of standard solution containing 03.84µg/ml of hydrazine was injected on each TLC strips and corresponding effective intensity of the R, G and B values were plotted (Fig 2).The maximum color intensity was observed at 2% solution of oxalic acid and this concentration was selected for further experimental work
Where
Effective intensity is the antilog of RGB values of sample to RGB of blank Ar= effective intensities for R values
Ag= effective intensities for G values Ab= effective intensities for B values
Drying methods: After immobilizatio
such as drying at room temperature, oven and hot air were applied and no change in signal was observed. However for increasing the speed of analysis, using an oven is recommended.
J. Chem. Pharm. Res., 2012, 4(
______________________________________________________________________________
Optimization of the reaction conditions
The influence of volume of the analyte solution which must be inject
investigated. The optimum sample volume was obtained to be 48µl. With greater injected volume spot spreading occurs due to diffusion and consequently the intensity of color was decreased.
The TLC strips were prepared containing vanillin solution in different concentration and dry. Then 48µl of standard solution containing 03.84µg/ml of hydrazine was injected on each
micropipette and effective intensity of the R, G and B values were plotted with respect to concent
The maximum color intensity was observed at 2-3% solution of vanillin. 2% vanillin solution was chosen for
Fig: 1 Effect of vanillin concentration
sity is the antilog of RGB values of sample to RGB of blank Ar = effective intensities for R values
Ag= effective intensities for G values Ab= effective intensities for B values
Effect of oxalic acid concentration: To study the effect of oxalic acid for maintaining acidic medium in this on of oxalic acid were prepared each solution immobilized on a TLC strips then was After drying 48µl of standard solution containing 03.84µg/ml of hydrazine was injected on each TLC strips and corresponding effective intensity of the R, G and B values were plotted (Fig 2).The maximum color intensity was observed at 2% solution of oxalic acid and this concentration was selected for further experimental
Fig 2 Effect of oxalic concentration
Effective intensity is the antilog of RGB values of sample to RGB of blank Ar= effective intensities for R values
Ag= effective intensities for G values Ab= effective intensities for B values
After immobilization of reagent onto the TLC Strips, the strips need to be dried. Some methods such as drying at room temperature, oven and hot air were applied and no change in signal was observed. However for increasing the speed of analysis, using an oven is recommended.
J. Chem. Pharm. Res., 2012, 4(3):1546-1552
______________________________________________________________________________
The influence of volume of the analyte solution which must be injected onto the TLC strip was investigated. The optimum sample volume was obtained to be 48µl. With greater injected volume spot spreading
tion in different concentration and dry. hydrazine was injected on each TLC strips with micro-lit plotted with respect to concentration of vanillin. solution was chosen for this
aintaining acidic medium in this each solution immobilized on a TLC strips then was After drying 48µl of standard solution containing 03.84µg/ml of hydrazine was injected on each TLC strips and corresponding effective intensity of the R, G and B values were plotted (Fig 2).The maximum color intensity was observed at 2% solution of oxalic acid and this concentration was selected for further experimental
Sulbha Amlathe
et al
______________________________________________________________________________
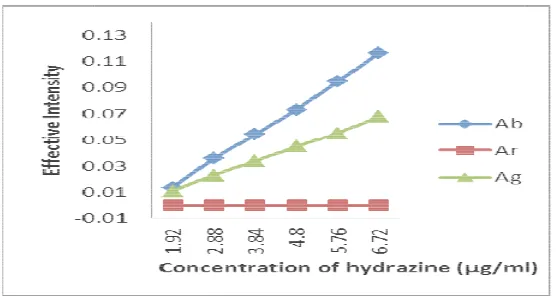
Calibration Curves
Calibration graph of hydrazine at optimum condition (Cvanilline=2% and Coxallic acid =2%) shown in fig 3.In this figure linear relationship between effective intensity and concentration of hydrazine is 1.92 µg/ml to 6.72 µg/ml. (Fig 3) Calibration in different concentration of hydrazine is shown by photogra
Fig: 3Calibration graph of hydrazine at optimum condition Where
Effective intensity is the antilog of RGB values of sample to RGB of blank Ar= effective intensities for R values
Ag= effective intensities for G values Ab= effective intensities for B value
[image:4.595.168.446.127.277.2]
Fig: 4 Photographs of yellow color changes upon the addition of hydrazine in vanillin solution and calibration of hydrazine in different
Reproducibility, response time, stability and detection limit of the system
Reproducibility of the proposed system is investigated at seven different sensors under optimum condition for various concentrations of hydrazine.
The response time of the system was evaluated under optimum experimental condition for 3.84µg/ml of hydrazine. It was calculated by measuring the time required to achieve 95% values of color
time of 10-15 seconds was achieved.
To study the stability of color spots, 3.84µg/ml of hydrazine was injected under optimum experimental condition on the sensors. Scanning of the strips was done in the time period of 5
420,480 min. No change in color intensity was observed for a period up to 420 min that shows the sensors are stable for 7 hours after injection of the hydrazine.
In order to study the stability of the sensors, after immobilization vanillin on the TLC strips it was used periodically each day, the signal did not show any significant change within 33 days of experiment .After 33 days a response time was found to be increased from 15 seconds to 3 minute. This reveals that the prepared strips are stable at least for a month.
For each RGB factor there is one Detection limit (DL 0.38µg/m1 for G and B values respectiv
J. Chem. Pharm. Res., 2012, 4(
______________________________________________________________________________
Calibration graph of hydrazine at optimum condition (Cvanilline=2% and Coxallic acid =2%) shown in fig 3.In this figure linear relationship between effective intensity and concentration of hydrazine is 1.92 µg/ml to 6.72 µg/ml.
3) Calibration in different concentration of hydrazine is shown by photograph (fig 4)
Fig: 3Calibration graph of hydrazine at optimum condition
Effective intensity is the antilog of RGB values of sample to RGB of blank for R values
[image:4.595.160.462.360.494.2]Ag= effective intensities for G values Ab= effective intensities for B value
Fig: 4 Photographs of yellow color changes upon the addition of hydrazine in vanillin solution and calibration of hydrazine in different concentration on the test paper.
Reproducibility, response time, stability and detection limit of the system
Reproducibility of the proposed system is investigated at seven different sensors under optimum condition for various concentrations of hydrazine. Table 1 shows the reproducibility of the proposed method.
The response time of the system was evaluated under optimum experimental condition for 3.84µg/ml of hydrazine. It was calculated by measuring the time required to achieve 95% values of color intensity of the spot. The response
15 seconds was achieved.
To study the stability of color spots, 3.84µg/ml of hydrazine was injected under optimum experimental condition on the sensors. Scanning of the strips was done in the time period of 5, 10, 15, 20, 30, 60 120, 180, 240, 300, 360, 420,480 min. No change in color intensity was observed for a period up to 420 min that shows the sensors are stable for 7 hours after injection of the hydrazine.
In order to study the stability of the sensors, after immobilization vanillin on the TLC strips it was used periodically each day, the signal did not show any significant change within 33 days of experiment .After 33 days a response creased from 15 seconds to 3 minute. This reveals that the prepared strips are stable at least
For each RGB factor there is one Detection limit (DL) [27].Theoretical DL of this method
µg/m1 for G and B values respectively. As the R value does not vary considerably by changing the
J. Chem. Pharm. Res., 2012, 4(3):1546-1552
______________________________________________________________________________
Calibration graph of hydrazine at optimum condition (Cvanilline=2% and Coxallic acid =2%) shown in fig 3.In this figure linear relationship between effective intensity and concentration of hydrazine is 1.92 µg/ml to 6.72 µg/ml.
Fig: 3Calibration graph of hydrazine at optimum condition
Fig: 4 Photographs of yellow color changes upon the addition of hydrazine in vanillin solution and concentration on the test paper.
Reproducibility of the proposed system is investigated at seven different sensors under optimum condition for Table 1 shows the reproducibility of the proposed method.
The response time of the system was evaluated under optimum experimental condition for 3.84µg/ml of hydrazine. intensity of the spot. The response
To study the stability of color spots, 3.84µg/ml of hydrazine was injected under optimum experimental condition on , 10, 15, 20, 30, 60 120, 180, 240, 300, 360, 420,480 min. No change in color intensity was observed for a period up to 420 min that shows the sensors are stable
In order to study the stability of the sensors, after immobilization vanillin on the TLC strips it was used periodically each day, the signal did not show any significant change within 33 days of experiment .After 33 days a response creased from 15 seconds to 3 minute. This reveals that the prepared strips are stable at least
Sulbha Amlathe
et al
J. Chem. Pharm. Res., 2012, 4(3):1546-1552
______________________________________________________________________________
concentration of hydrazine, we calculated DL only for G and B values. We can also determine the detection limit by practical experiment. Practical DL is the lowest concentration that would give a color on the TLC strip [22]. Practical DL was about 0.1µg/ml.
Table1: Reproducibility of the method
Concentration of
Hydrazine (µg/ml) AB AG
6.72 5.76 3.84 1.92
Avea SDb RSDc Avea SDb RSDc
0.204 0.05 1.0 0.076 0.03 2.0
0.054 0.03 2.3 0.013 0.01 4.0
0.782 0.03 1.5 0.040 0.02 2.2 0.030 0.02 2.5 0.090 0.01 4.0
a Average of seven measurement on different TLC b Standard deviation
c Relative standard deviation
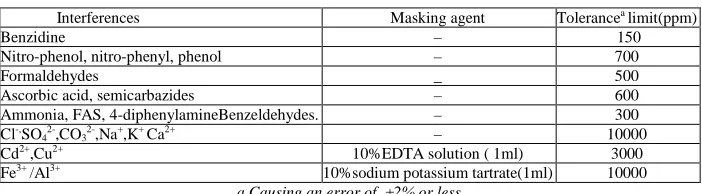
Interferences Study
[image:5.595.131.482.321.418.2]To check the validity of method the effects of various interferences have been studied under optimum experimental conditions. The method was found to be free from most of the interferences including organic compound and metal ion in water. The tolerance limits for various interferences tested on paptode are shown in table 2.
Table 2 Effect of foreign species on the determination of hydrazine
Interferences Masking agent Tolerancea limit(ppm)
Benzidine – 150
Nitro-phenol, nitro-phenyl, phenol – 700
Formaldehydes _ 500
Ascorbic acid, semicarbazides – 600
Ammonia, FAS, 4-diphenylamineBenzeldehydes. – 300
Cl-,SO
42-,CO32-,Na+,K+ Ca2+ – 10000
Cd2+,Cu2+ 10%EDTA solution ( 1ml) 3000
Fe3+ /Al3+ 10%sodium potassium tartrate(1ml) 10000
a Causing an error of ±2% or less
APPLICATION
The proposed method for determination and sensing of hydrazine is successfully applied in biological sample, waste water sample, and pharmaceutical tablets.
In waste water: To assess the applicability of the sensor, it is applied for sensing hydrazine in waste water samples. No real sample was found containing hydrazine hence synthetic samples were prepared by taking waste water samples of the nearby industrial area. The synthetic samples were prepared by adding known amount of hydrazine to the waste water samples, and then analyzed by proposed as well as already reported method [30].The results are shown in Table 3A.
Table 3A Analysis of hydrazine in waste water and biological samples*
*Amount of samples 1ml **mean of three replicate analyse
In Biological sample: To check the applicability of the method, it is analyzed in urine samples. Hydrazine is reported to be present in biological samples i.e. urine [31]. The samples were first deproteinated by adding trichloroacetic acid prior to analysis. Then analyzed for presences of hydrazine using proposed paptode[30]. The percent recovery was found 98 %. (Table3A)
In pharmaceutical tablets: To check the sensitivity of the sensors, the proposed sensors are applied for sensing hydrazine in pharmaceutical tablets like isoniazid (isokin) tablets in which hydrazine is present as hydrazide.
Sample Hydrazine added(µg/ml) Found by proposed
method (µg/ml) Recovery(%)
Found by reported
method (µg/ml) Recovery (%)
In waste water*
20 30 40
21.1 29.9 42.0
100.2 99.8 102.3
19.7 29.2 38.2
99.2 99.3 100
In biological samples(urine sample)*
20 30 40
19.8 30.0 39.1
99.2 100.00
98.00
20.0 27.4 35.9
Sulbha Amlathe
et al
J. Chem. Pharm. Res., 2012, 4(3):1546-1552
______________________________________________________________________________
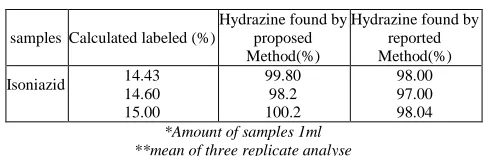
Tablets containing isonicotinic acid hydrazide are used as a therapeutic agent for tuberculosis [32, 33] these tablets were analyzed for the determination of hydrazine present as hydrazide. The stock solution was prepared of tablets by dissolving one tablet (300mg) in 10% 2M hydrochloric solution. The determination of hydrazine were carried out by proposed method and compared with a reported method [25] (Table3B).
Table 3B Analysis of hydrazine in pharmaceutical tablets**
samples Calculated labeled (%)
Hydrazine found by proposed Method(%)
Hydrazine found by reported Method(%)
Isoniazid 14.43 14.60 15.00
99.80 98.2 100.2
98.00 97.00 98.04
[image:6.595.184.427.148.226.2]*Amount of samples 1ml **mean of three replicate analyse
Table 4: Comparison of the propose paptode with some repoted method
CONCLUSION
The proposed chemo-sensor is highly sensitive and free from most of the interfering species. The proposed method was found to be superior to other method. This method is simple and rapid and it does not need any expensive apparatus. The proposed method can be used for the determination of hydrazine in industrial health and safety monitoring work.
Acknowledgements
The authors are grateful to Director, BUIT Barktullah University Bhopal and Principal, Govt. Sarojini Naidu Girls College Bhopal, for providing laboratory facilities and for their kind support.
REFERENCES
[1] Jean-Pierre Shirmann, Paul Bourdauducq “Hydrazine” in Ullamann’s Encyclopedia of Industrial Chemistry, 2001.
[2] Occupational Safety and Health Act, Commerce Clearing House Inc., U.S.A., 1984, 3825-3827. [3] W. Leithe,“The Analysis of Air Pollutant”, Ann Arbor Science Publishers, 1977, 174-175.
[4] Vijay N. Bhosale, Sambhaji P. Vartale, Vinayak K. Deshmukh and Sharad V. Kuberkar, J. Chem. Parma. Res., 2010, 2(3), 51-58
[5] E.H.Vernot, McEwen, J.D.Bruner, R.H.Haus, C.C. and kinkead, E.R., Fundam. Appl. Toxicol, 1985, 5, 1050. [6] Isoniazid - Wikipedia, The free encyclopedia, 2011, 1-5.
[7] Debjit Bhowmik, Chiranjib , R.Margret Chandira, B.Jayakar, K.P.Sampath Kumar, Journal of Chemical and Pharmaceutical Research, 2009, 1 (1), 113-133
[8] American Conference of Governmental Industrial Hygienists (ACGIH). TLV and BEI. Threshold Limit Values for Chemical Substances and Physical Agents, Biological Exposure Indices. Cincinnati, 1999.
[9] National Institute for Occupational Safety and Carcinogenic Health U.S. Department of Health, Education and Welfare, 1992 DHHS#, 92-100.
[10] N.Maleki, A. Safavi, E. Farjami and F.Tajbadi, Anal.Chim. Acta, 2008, 611, 151. [11] A. Salimi, L. Miranzadeh and R. Hallaj, Talanta, 2008, 75, 147.
[12] M.S.M. Quintino, K Araki, H.E. Toma and L. Angnes, Talanta 2008, 74, 730.
Reagent Technique Linear range
(µg/ml)
Detection limit (µg/ml)
Response
time Remark Ref.
p-Dimethylamino-benzeldehyde Spectrophotometry 0.06-0.47 _ _ Urea,semi-carbezide interfere [34]
Saliylldehyde spectrophotometry 0.29-1.25 – 15min Less sensitive [35]
2-hydroxy-1-naphthaldehyde
Extraction-
spectrophotometry 0.035-0.70 _ 20min
Reaction at 100˚c
(extractive) [36 ]
p-Dimethylamino-benzeldehyde
FIA-
spectrophotometry 2.0-40.0 1.0 _ Less sensitive [19]
p-Dimethylamino-benzeldehyde
Spectrophotometry 0.020-.50 0.01 _
Less sensitive [18]
p-Dimethylamino-benzeldehyde Based on paptode 10-300 0.1 2min PH dependent [28]
Vanillin Proposed method 1.92-6.72 0.1 10-15sec Highly sensitive, simple,rapid, quantitative, less interferences
Sulbha Amlathe
et al
J. Chem. Pharm. Res., 2012, 4(3):1546-1552
______________________________________________________________________________
[13] A.A. Ensafi and B.Rezaei, Talanta, 1998, 47, 645. [14] A.Afkhami and M.Bahram, Talanta, 2006, 68, 1148.
[15] A.Afkhami and A. Afshar-E-Asl, Anal. Chim. Acta, 2000, 419, 101. [16] M. George, K. S. Nagaraja and N. Balasubramanian, Talanta, 2008, 75, 27. [17] A.Afkhami and A.R.Zarei, Talanta, 2004, 62, 559.
[18] A.A. Ensafi and B.Naderi, Microchem J., 1997, 56,269. [19] Ali Reza Zarei, Anal. Biochem, 2007, 369, 161.
[20] K. K. Verma, A. Srivastava, J. Ahmed and S. Bose, Talanta, 1978, 25,469. [21] S. Dadfarnia and K. Dehghan, Bull. Korean Chem. Soc., 2004, 25, 213.
[22] F. Feigl and V. Anger, Spot Test in Inorganic Analysis, Elsevier,Amsterdam, 6th ed., 2005 ,first Indian reprint. [23] D. Kealey, Talanta, 1972, 19, 1563.
[24] R. Narayanaswamy and F. Sevilla, Mikrochim. Acta, 1989, 97, 293.
[25] R. Kaveeshwar and V.K.Gupta Fresenius J Anal Chem., 1992, 344, 114-117. [26] S.Amlathe and V.K.Gupta, Microchemical Journal, 1990, 42,331-335.
[27] A. Abbaspour, M. A. Mehrgardi, a. Noori, m. A. Kamyabi,a. Khalafi-nezhad and M. N. Soltani rad, sens. Actuators, B,2006, 113, 857.
[28] Abdolkarim, Abbaspur ,Ehsan Mirchandani and Abdolreza Khajehzadah ,Anal Method , 2010, 2, 349-353. [29] R. D. Sharma, S. Joshi and S. Amlathe, Anal methods, 2011, 3, 452-456.
[30] S. Amlathe and V. K.Gupta , Analyst, 1988, 113, 1481-1483.
[31] John A. Timbrell, James M. Wright, Clare M. Smith, Journal of Chromatography A, 1977,138 165-172. [32] Ravi G Patel, Chirag K Patel, Vimal I Patel, D. J. Sen, B. Panigrahi and C. N. Patel, J. Chem. Pharm. Res., 2010, 2(2), 112-117 .
[33] Smita Sharma , Mukesh Chandra Sharma and A. D. Sharmac, J. Chem. Pharm. Res., 2010, 2(2), 357-365. [34] G W Watt, J D Chrisp, Ind Eng Chem. Anal, 2006, 24, 1952.
[35] L.C. Bailey and T. Medwick, Anal, Chim. Acta, 1996, 113, 1481.