© 2016, IRJET | Impact Factor value: 4.45 | ISO 9001:2008 Certified Journal
| Page 1229
Analysis of an Analog Sallen Key Band Pass Filter Based On Particle Swarm
Optimization Technique
Akash kumar
1Arjun Kumar
1Sunny Kushwaha
1Prof. Anil Kumar Singh
21
M.tech student, Electronics dept. Kamla Nehru Institute of Technology Sultanpur (U.P.)
2Professor, Electronics Engg. Department, Kamla Nehru Institute of Technology, Sultanpur
Abstract: -
In this paper, an active second order RC sallen key band-pass filter is designed at different values of quality factor Q. The center frequency of filter is taken 15 kHz. Analog filters depend upon the values of Resistors and Capacitors which are taken from the series following sustain values selected. It is very difficult to search on all probable combinations of value choices for an optimized design. Thus this paper presents one of the evolutionary computation techniques i.e. Particle Swarm Optimization (PSO) for the design of above filter. PSO is a random algorithm which provides optimal filter coefficients. PSO provides many advantages such that total error function is reduced, simple implementation, enhanced search capability and provides fast response. Simulation study affirms that the proposed algorithm is accurate and gives fast results. Various results acknowledge the superiority of the algorithm.Keywords:-Band-pass filter, Quality factor, center
frequency,Particle Swarm Optimization (PSO), MATLAB
INTRODUCTION:-
Filters which process signals in a frequency domain. The basic concept of a filter can be explained by examining the frequency dependent nature of the capacitors and inductors. Consider a voltage divider where the shunt leg is a reactive impedance. As we change the frequency, the value of the reactive impedance changes, and the voltage divider ratio also changes. This mechanism leads to the frequency dependent change in the transfer function that is defined as the frequency response.
The Sallen-Key topology, also known as a voltage control voltage source. It is one of the most widely used filter topologies. This topologyis used becausethis configuration shows the least dependence of filter performance on the performance of the op-amp because op-amp is configured as an amplifier, as opposed to an integrator, which reduces the gain bandwidth requirements of the op-amp. This leads to design a higher frequency filter than with other topologies since the op-amp gain-BW product will not limit the performance of the filter as it would if it were configured as an integrator. The signal phase through the filter is maintained
(no inverting configuration). Another advantage of this configuration is that the rate change of the largest resistor value to the smallest resistor value and the largest capacitor value to the smallest capacitor value are low, which means component spread is low, which is good for manufacturability. The frequency and Q terms are independent, but they are very sensitive to the gain.
The Sallen-Key is very Q-sensitive to element values, especially for high Q sections.
PARTICLE SWARM OPTIMIZATION:
Particle swarm optimization is a population based stochastic optimization technique evolved by Dr. Eberhart and Dr. Kennedy in 1995, inspired by social behavior of bird flocking or fish schooling.
PSO deals many similarities with evolutionary computation techniques such as Genetic Algorithms (GA). The system is initialized with a population of random solutions and searches for optimized by updating generations. However, unlike GA, PSO has no progression operators such as crossover and mutation. In PSO, the potential solutions, called particles, fly through the problem space by following the current optimum particles. The detailed information will be given in following sections.
Compared to GA, the advantages of PSO are that PSO is easy to implement and there are few parameters to adjust. PSO has
been successfully applied in many areas: function
optimization, artificial neural network training, fuzzy system control, and other areas where GA can be applied.
Mathematical Formulation
© 2016, IRJET | Impact Factor value: 4.45 | ISO 9001:2008 Certified Journal
| Page 1230
better positions over time. Numerically, the position x of a
particle iat iteration k+1 is updated as:
PSO simulates the behaviors of bird flocking. Suppose the following scenario: a group of birds are randomly searching food in an area. There is only one piece of food in the area being searched. All the birds do not know where the food is. But they know how far the food is in each iteration. So what's the best strategy to find the food? The effective one is to follow the bird which is nearest to the food.
PSO learned from the scenario and used it to solve the optimization problems. In PSO, each single solution is a "bird" in the search space. We call it "particle". All of particles have fitness values which are evaluated by the fitness function to be optimized, and have velocities which direct the flying of the particles. The particles fly through the problem space by following the current optimum particles.
PSO is initialized with a group of random particles (solutions) and then searches for optima by updating generations. In every iteration, each particle is updated by following two "best" values. The first one is the best solution (fitness) it has achieved so far. (The fitness value is also stored.) This value is called pbest. Another "best" value that is tracked by the particle swarm optimizer is the best value, obtained so far by any particle in the population. This best value is a global best and called gbest. When a particle takes part of the population as its topological neighbors, the best value is a local best and is called lbest.
After finding the two best values, the particle updates its velocity and positions with following equation (a) and (b).
v[ ] = v[ ] + c1 * rand( ) * (pbest[ ] - present[ ]) + c2 * rand( )
* (gbest[ ] - present[ ]) (a)
present[ ] = present [ ] + v[ ] (b)
v[ ] is the particle velocity, present[ ] is the current particle (solution). pbest[ ] and gbest[ ] are defined as stated before. rand ( ) is a random number between (0,1). c1, c2 are learning factors. Usually c1 = c2 = 2.
The pseudo code of the procedure is as follows:
For each particle Initialize particle
End
Do
For each particle
Calculate fitness value
If the fitness value is better than the best fitness value (pBest) in history
set current value as the new pBest
End
Choose the particle with the best fitness value of all the particles as the gbest
Foreach particle
Calculate particle velocity according equation (a) Update particle position according equation (b)
End
While maximum iterations or minimum error criteria is not attained
Particles' velocities on each dimension are clamped to a maximum velocity Vmax. If the sum of accelerations would cause the velocity on that dimension to exceed Vmax, which is a parameter specified by the user. Then the velocity on that dimension is limited to Vmax.
Application to the Optimal Design of the Sallen Key Band Pass Filter:
The architecture that has been used to implement the second order band-pass filter is the Sallen-Key Topology. This topology is chosen due to its simplicity compared to other known architectures such as multiple feedback and state variable. The circuit diagram below shows a second order Sallen-Key band pass filter:
© 2016, IRJET | Impact Factor value: 4.45 | ISO 9001:2008 Certified Journal
| Page 1231
We use below specification for desired filter design. By using [image:3.612.318.532.526.576.2]these specification,the required filter characteristic is simulated with MATLAB:
Table 1: Sallen key band pass Filter specifications: Center Frequency 15 kHz
Stop band Attenuation -20 dB
Pass Band Ripple 0.1 dB
𝐕𝐩−𝐩 10 mV
Design Implementation
The general transfer function of a second order band pass filter is given as:
H(s) = 𝑎1𝑠
𝑠2+𝑏1𝑠+𝑏0 (1)
Where 𝑎1, 𝑏1 and 𝑏0 are constants.
The transfer function of the second order Sallen-Key band pass filter in Fig. 1 is:
H(s)= 𝑠𝑐2𝑅2𝑅5
𝑠2𝑐
1𝑐2𝑅1𝑅2𝑅5+ s [𝑐2𝑅2𝑅5 (1 – G) + 𝑐2𝑅1𝑅5 + 𝑐2𝑅1𝑅2+ 𝑐1𝑅1𝑅2] + (𝑅1 + 𝑅2)
(2)
Equation (5) can be simplified by putting R1 = R2 = R, R5 = 2R, C1 = C2 = C this is known as the equal component Sallen-Key band-pass filter [3]:
H(s) = 𝑆𝐶𝑅𝐺
𝑆2𝐶2𝑅2+𝑆𝐶𝑅 3−𝐺 +1 (3)
Resonant frequency (fo) 1/2πCR
Bandwidth (β) 𝑓0/Q
Op-amp gain (G)
1 +𝑅4 𝑅3
Gain at 𝜔0 (A) 𝐺
3 − 𝐺
Quality factor (Q) 1
3 − 𝐺
The poles of the transfer function are:
𝑆1,2= [ (G – 3)/RC ± √{((3 – G)/RC)2 + 4(1/RC)2}] / 2
From equation (4) it can be seen that the quality factor is governed by the term G (op-amp gain). Hence, the quality factor (Q) can be varied via the inner gain (G) without
modifying the center frequency. A drawback is, however, that Q and A (gain at center frequency) cannot be adjusted independently. When G approaches the value of 3, A and Q tend to infinitely increase and cause the circuit to oscillate. As G grows greater than 3, Q becomes negative and consequently, A becomes negative too, thus from equation (4), the s – coefficient is equal to zero indicating that H(s) has right half-plane poles [7]. This problem can be solved by adding an input buffer that gives a gain adjustment so as to just compensate for a Q adjustment with a change in the input gain. This will increase the number of components used for design and construction thereby raising the cost of the circuit. Substituting, the above transfer function can be written in standard form as:
H(s) = 𝑆𝐴(𝜔0/Q)
𝑆2 + (𝜔0/Q)s + ω 0
2 (4)
Let the design components be
C = 10nF, R3 = 10k, R4 = 10k, fo = 15kHz R = 1/ (2*π*15000 * 10 x 10-9) = 1.06k G = 1 + (10/10) = 2
A = 2/ (3 - 2) = 2 Q = 1/ (3 – 2) = 1
Bandwidth = fo/Q = 15 kHz/ 1 = 15 kHz
The transfer function:
H(s) = 188520 𝑆
𝑆2 +94260 s + 8.88E09 (5)
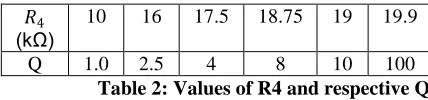
The Quality factor can be varied by varying the gain G through the resistor R4 or R3. In this paper, R3 is chosen to be constant at 10k, while R4 is chosen as the resistor to be varied. Thus, the different values of Q will be obtained for R4 = 10k, 16k, 17.5k, 18.75k, 19k, 19.9k from the table below:
𝑅4 (kΩ)
10 16 17.5 18.75 19 19.9
Q 1.0 2.5 4 8 10 100
Table 2: Values of R4 and respective Q
By using the transfer function, the frequency response of the filter at varying Q’s can be plotted using MATLAB to verify
the design. The cutoff frequency (𝜔𝐿,𝜔𝐻) and the selectivity
factor (𝑄1,𝑄2) of filter, which depend only on the values of the
passives components For comparison reasons, the
specification chosen here is: 𝑄1=0.7654 𝑄2=1.8478 The values
of the resistors and capacitors to choose must be able to
generate 𝜔𝐿, 𝜔𝐻, 𝑄1and 𝑄2 approaching the specified values.
© 2016, IRJET | Impact Factor value: 4.45 | ISO 9001:2008 Certified Journal
| Page 1232
TE = αΔω + βΔQ (6)
Where
[image:4.612.31.263.360.625.2]Δω = 𝜔𝐿−𝜔 +|𝜔𝐻−𝜔 | 𝜔
ΔQ = |𝑄1−
1
0.7650| + |𝑄2− 1 1.8478|
The objective function considered is the Total Error which is calculated for the different values of α and β. The decision variables are the resistors and capacitors forming the circuit.
SIMULATIONS & RESULTS:
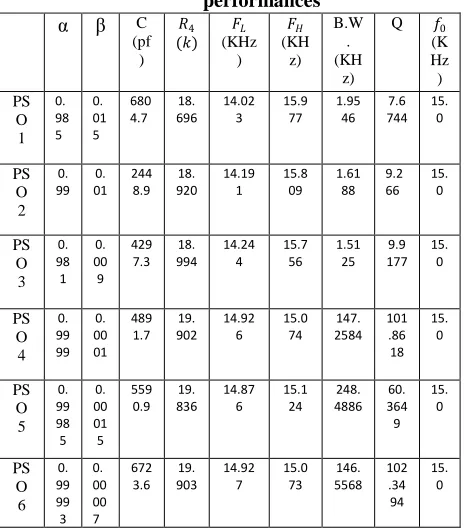
In this section ACO algorithm is applied to perform optimization of a second order Sallen-Key band pass filter. The optimal values of resistors and capacitors forming the considered filter and the performance. Associated with these values for the different series are shown in Table 3:
Table 3: Values of components and related filter performances
Simulation of PSO1.
α β C
(pf ) 𝑅4 (𝑘) 𝐹𝐿 (KHz ) 𝐹𝐻 (KH z) B.W . (KH z)
Q 𝑓0
© 2016, IRJET | Impact Factor value: 4.45 | ISO 9001:2008 Certified Journal
| Page 1233
Simulation of PSO2.
Simulation of PSO3.
Simulation of PSO4.
© 2016, IRJET | Impact Factor value: 4.45 | ISO 9001:2008 Certified Journal
| Page 1234
: Simulation of PSO6.
CONCLUSION:
In this work an application of the Particle Swarm
Optimization is presented for optimal design of a Second Order Sallen Key Analog Band pass filter. Investigation for the selection of passive components has been done. The design of the analog filter with high accuracy and short execution time is successfully realized using the PSO. It is shown that the tolerances of the spacing values associated to the components affect significantly the performance of the filter. MATLAB simulations confirm the validity of the proposed algorithms. For the future work one can apply the proposed PSO technique in dealing with the optimal design of complex analog circuits.
REFERENCES:
[1] Teryima D. Kureve, Johnson A. Mise, Benard A. Atsuwe, ―Implementation Of An Active RC Band-Pass Filter At Varying Quality Factors Using Matlab‖ ,International Journal of Scientific & Technology Research Volume 3, Issue 5, May 2014.
[2]HOU Zhi-rong, LU Zhen-su, “Particle Swarm Optimization Algorithm for IIR Digital Filters Design”,Journal of Circuits and Systems, vol. 8, no. 4, 2003,pp.16-20.
[3] Liu H B, Wang X K, Tan G Z, “Convergence Analysis of Particle Swarm Optimization and Its improved Algorithm Based on Chaos”, Control and decision,2006,21(6):636-640, 645.
[4] Gao S, Yang J Y, Swarm Intelligence Algorithms and Applications, China water power press, Beijing, 2006. [5] Bachir Benhala, ―Ant Colony Optimization for Optimal Low-Pass Butterworth Filter Design‖, E-ISSN: 2224-266X Volume 13, 2014.
[6]S.M. Ahmed, Design of FIR filters with arbitraryamplitude and phase specifications using geneticalgorithm, in: 46th IEEE International Midwest Symposium on Circuits and Systems MWSCAS 2003,
2003, pp. 648-651.
[7] B. Benhala, A. Ahaitouf, M. Kotti, M. Fakhfakh, B. Benlahbib, A. Mecheqrane, M. Loulou, F. Abdi and E. Abarkane, ―Application of the ACO Technique to the Optimization of Analog Circuit Performances‖, book; Analog Circuits: Applications, Design and Performance, Ed., Dr. Tlelo-Cuautle, NOVA Science Publishers, Inc., 2011, pp. 235-255.
[8] B. Benhala, A. Ahaitouf, A. Mechaqrane, B. Benlahbib, F. Abdi, E. Abarkan and M. Fakhfakh, ―Sizing of current conveyors by means of an ant colony optimization technique‖, The International Conference on Multimedia Computing and Systems (ICMCS'11), 201, pp. 899-904, Ouarzazate, Morocco.