Comparative Study on Distributed Generator Sizing Using Three Types of Particle
Swarm Optimization
J.J. Jamian, M.W. Mustafa
Faculty of Electrical Engineering,Universiti Teknologi Malaysia [email protected] [email protected]
H. Mokhlis
Faculty of Engineering,University of Malaya [email protected]
M.N. Abdullah
Faculty of Electrical and Electronic Engineering, Universiti Tun
Hussein Onn Malaysia [email protected]
Abstract— Total power losses in a distribution network can be
minimized by installing Distributed Generator (DG) with correct size. In line with this objective, most of the researchers have used multiple types of optimization technique to regulate the DG’s output to compute its optimal size. In this paper, a comparative studies of a new proposed Rank Evolutionary Particle Swarm Optimization (REPSO) method with Evolutionary Particle Swarm Optimization (EPSO) and Traditional Particle Swarm Optimization (PSO) is conducted. Both REPSO and EPSO are using the concept of Evolutionary Programming (EP) in Particle Swarm Optimization (PSO) process. The implementation of EP in PSO allows the entire particles to move toward the optimal value faster. A test on determining optimum size of DGs in 69 bus radial distribution system reveals the superiority of REPSO over PSO and EPSO.
Keywords-distributed generation sizing; distribution network; optimal sizing; power losses reduction
I. INTRODUCTION
The connection of Distributed Generation (DG) at the consumer site has given lot of opportunities for the distribution network to improve their performance. By having one or more DG units in the network, the power injections from DG to the distribution network will change the network power flows and can cause the existing power losses and the reinforcement cost reducing [1,2]. Not only that, the allocation of DG also can give beneficial impact to the economic and financial aspect and increase the reliability and efficiency of the network [3,4]. However, all these advantages are only can be achieved with the proper method to do the sizing of DG units. With the incompatibleness of size and location of the DG, it will give an opposite effect to the distribution network such as power loss increasing and voltage operate in out of the limit [5-7]. Therefore, many researchers have conducted studies to obtain the appropriate location and size for the DG either for a single DG unit [8,9] or for multiple DG units [10,11].
The optimization techniques such as Genetic Algorithm (GA), Particle Swarm Optimization (PSO), Evolutionary Programming (EP), Ant Colony Optimization (ACO) and other heuristic methods are usually used in finding the optimal size of DG. With this optimization method, it could help the power system planner to have an idea the optimal capacity of DG size for the network and reduce the chances for the network to have higher power losses. The analysis in
[1] is one of the most recent studies on optimal placement and sizing of DG units in distribution system. The author used combination of two heuristic optimization methods which are GA and Immune System (IS) in order to maximize the benefit of DG. Since the size of DG is directly related to the power losses and the cost of reinforcement, thus the authors try to minimize both factors in order to achieve the optimal DG output in the system.
The implementation of DG optimal sizing is not only restricted to distribution network. R.K. Singh et. al. [2] and M. M. Elnashar et. al. [12] have implemented the GA method and visual optimizing approached to allocate and optimal the size of DG units for network or meshed system respectively. Thus, the optimization method can be used for both radial and meshed network in sizing the DG units. Furthermore, the objective of DG sizing is not only limited to the reduction of power loss or lowering the cost of generation, but it can also be used to minimize the THD in the network [13], lowering the short circuit level that represents the protective device in the network [12], minimizing electric cost for consumers [14] and many more.
However, most of the heuristic optimization methods such as PSO consist of several random numbers or non-fixed parameters (c1, c2, wi) in their algorithm. Even though they
could obtain an optimal value, sometimes they might get stuck at the local optimal, hence, missing the best optimal value due to the exclusion of other global optimal values. Therefore, the analysis of standard deviation will serve as an indicator to show the efficiency of the method in reaching the best optimal value. Moreover, the PSO used in optimizing the DG size for a large system will also take a longer time to solve the optimization problem. Thus, it is very important to have a hybrid method that can improve the number of iteration and the time consumption in solving the problem. In this paper, the sizing of DG units will be performed using 3 different types of PSO which are traditional PSO, Evolutionary PSO (EPSO) and Rank Evolutionary PSO (REPSO) for radial distribution network. Both EPSO and REPSO are using the concept of hybridization between Evolutionary Programming (EP) and the PSO.
The details of all these algorithms are discussed in Section III. Section IV shows performance of all these algorithms using standard test function. The simulation results in term of power loss and voltage profile for 69 bus
radial distribution systems is discussed in Section V. Last but not least, Section VI presents the conclusion of the study.
II. FORMULATION OF DGSIZING WITH SOME ELECTRICAL CONSTRAINTS
For a single supply radial distribution system, the real power losses in the network with ‘n’ number of branches can be written as:
¦
== n
i i i
losses I R
P
1
2 (1)
From (1), when the main source sending a large amount of current, Ii though a certain branch in the network to fulfill the demand at the end feeder, it will cause the total power loss in the network to increase. However, with the existence of DG units in the network, it can be used to supply certain amount of power to the certain loads whilst other loads continue to receive power supply from the main source.
This strategy will allow the power losses in the network to be reduced and at the same time, improve the reliability of the network. However, without proper sizing of DG, opposite effect might occur. Power losses might increase and cause the voltage to be under acceptable limit. Thus, optimization methods (REPSO, EPSO and PSO) will be used in this study in order to get the optimal size of DG. The objective of this DG sizing process is to get the minimum real power losses in the distribution network and to meet the load demand of the power system. It is presented as:
¦
== n
i losses losses
total P
P Minimize
1
(2)
There are some constraints that have been set in order to get the maximum benefit from the DG sizing where:
1) Generator operation constraints:
max min
i DGi
i P P
P ≤ ≤ (3)
All DG units are only allowed to operate within the acceptable limit where Pimin and Pimax are the lower and upper bound of DG output.
2) The total power of DG must be less than the total amount of load in the network.
DG of no k P
P
P Load Losses
k
i
DG , .
1
= +
<
¦
= (4)It is needed to avoid the effect of power injection from DG units to the main source and cause the power losses increase.
3) Power balance:
Losses Load
Substation k
i
DG P P P
P + = +
¦
=1(5)
Total power generated in the network is equal to the summation of total load and the total power losses. This is due to the principle of equilibrium between generated power and load.
4) Voltage bus constraints:
max min
i i
i V V
V ≤ ≤ (6)
All bus voltage must be within acceptable limit which is from 0.95 to 1.05p.u.
III. REVIEW OF PSO,EPSO AND REPSO
A. PSO
Particle Swarm Optimization is one of the heuristic methods used by researchers to solve optimization problem. The main idea of the PSO is based on the food searching behavior (foraging) of birds or fish. The birds or fish will move to the food in certain speed and position. Their movement will depend on their own experience and experience from other ‘friends’ in the group (Pbest and Gbest).
The new velocity,vi+1 and the new position, xi+1 for the fish or birds is obtained using (7) and (8) after the current Gbest
and Pbesthave been calculated.
) (
)
( 2 2
1 1
1 i best i best i
i V cr P x cr G x
v+ =ω + − + − (7)
i i
i v x
x+1= +1+ (8)
Different from other optimization methods such as Plant Growth Optimization (PGO), the PSO works with the population of potential solution rather than with single solution. Thus, all the population will adjust their position for each iteration based on the calculated velocity until it reaches the optimal point (food). The main step for the PSO algorithm is:
1) Initialization – randomize population (x) Repeat:
2) Calculate fitness (f(x))
B. EPSO
The EPSO introduced by Angeline, P.J [15] have the same process for initial step as PSO does. However, before the process of calculate the current Gbest and Pbest for the
population, the tournament selection process concept in EP is integrated in PSO. All the particles will be contested in a tournament with a number of positions other than itself according to the contestants’ percentage settings. Fig. 1 shows the summary for the EPSO process to determine the optimal point in the analysis.
For example, if 20 positions are selected, and the percentage is set to 40 percent, then all particles will be challenged by eight other contestants randomly, and each position will be weighted by the number of wins it obtains. A position gains a win when its fitness is better than its contender. This tournament is the part which is adapted from EP. After the tournament, the only particles which have higher wins will be used for the next iteration. The process of EPSO after obtaining the successful particles will be same as traditional PSO afterwards. Even though there is an extra step in the EPSO, but this step (tournament) will make sure that the only potential particle will be remain in the next iteration and can get the optimal value faster than traditional PSO. Thus, the equation for the next position for all particles is the same as in (8).
yi+1(max)- yi+1(min) = ? Iteration = max value?
Start
Determine Pbest &
Gbestvalue
Set the number (N), position (xi),
& velocity (v) of particles
Calculate the new position, x(i+1) and
velocity, v(i+1) from P
bestand Gbest value
Population sorted base on the highest score
Select N best particles from the result (survival particle)
All particle fulfil the constrain?
YES
Find Pbest and Gbest value for next
calculation Re-generate position
(xi) of particle
NO Determine the new fitness
of each particle, yi+1
Do the tournament selection process
End Calculate the fitness
of each particle (yi)
YES
[image:3.612.323.551.160.304.2]NO
Figure 1: The process of Evolutionary Particle Swarm Optimization (EPSO) Algorithm
C. REPSO
Different from EPSO, the REPSO used the combination and ranking concept in Evolutionary Programming (EP) in traditional Particle Swarm Optimization (PSO) in order to get faster solution. Figs. 2 (a) and (b) illustrate the differences between the concept of PSO and REPSO respectively.
(a)
(b)
Pbest, Gbest,
Vnew, Xnew
Target (Optimal Value) Particles (Possible Answer)
Vnew, Xnew
[image:3.612.79.273.353.661.2]Pbest, Gbest
Figure 2: Rank Evolutionary Particle Swarm Optimization (REPSO) Concept
From the figure, the best particles among the population in REPSO will move to the next position while the others will replace the position that has been left by them. This can be done by using the combination, ranking and selection method in EP. The new position of these particles in REPSO will be different compared to traditional PSO. It makes the particles in REPSO to be faster than PSO in approaching the optimal searching value as shown in Fig. 2. Compared to EPSO, the concept of competition/tournament in EP used in EPSO might cause the ‘lucky’ particles to remain in the system. This is due to the competition concept that entire particle will be compared randomly. Thus, there will be some chances for those ‘lucky’ particles to remain in the system even though it is not the best solution value. REPSO will address this entire problem and able to obtain faster result as compared PSO and EPSO.
IV. PERFORMANCE OF PSO,EPSO AND REPSO To evaluate the effectiveness and robustness of REPSO in comparing with EPSO and PSO, a simple test function [16] was performed with these 3 methods. The main purpose of this analysis is to determine the minimum value of (9) where the global best value for this function is -18.5916 when x=9.0400 and y=8.6645.
) 2 sin( 1 . 1 ) 4 sin( ) ,
(x y y x x y
f = + (9)
TABLE I THE PERFORMANCE OF PSO,EPSO AND REPSO FOR TEST
FUNCTION
50 times PSO EPSO REPSO
Function values
Best -18.5916 -18.5916 -18.5916
Worse -10.0366 -12.3199 -12.3199
Mean -17.674 -17.6474 -17.9560
Standard Deviation 2.243268 1.718802 1.359294 Average Computing
Time (s) 0.134881 0.122814 0.0802
From the result, it can be seen that the REPSO have the fastest computing time and lowest standard deviation (SD) value compared to the EPSO and traditional PSO. The REPSO only requires 3/5 total time which was required by traditional PSO to reach the optimal point and the standard deviation is also 39.4 percent lower than traditional PSO. Although the performance of EPSO is not as good as REPSO, EPSO still have better performance than traditional PSO. The EPSO have faster computation time as compared to the traditional PSO, where EPSO only required 0.122814 second to reach the optimal value. Furthermore, based on the standard deviation value, the EPSO have lower SD value as compared to PSO. This means that, at certain times, the random value generated during the process causes the PSO to not reach the optimal point. However, the result of REPSO is still superior to EPSO. Hence, it can be concluded that REPSO is more efficient than EPSO and traditional PSO.
V. RESULT AND DISCUSSION
The 69 bus radial distribution system as shown in Fig. 3 is used for the analysis on the performance of REPSO, EPSO and PSO. The power base value for this network is 10MVA and the voltage base value is 12.66kV. The line and load data can be obtained from [17].
Figure 3: 69 radial distribution system with existing of DG operated at PV mode
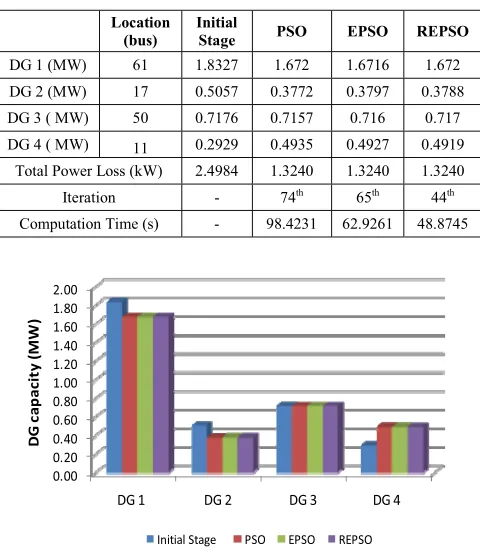
In this simulation, there are 4 units of DG which are located in the network at buses 11, 17, 50 and 61 and operating in P-V bus mode. The initial capacities of the DG units are 0.2929 MW, 0.5057 MW, 0.7176 MW and 1.8327 MW whilst the power loss in the network is 2.4984 kW. The method to find the location and size of the initial value is discussed in [18] when the DG is operating in PV mode.
[image:4.612.316.556.313.588.2]Table II shows the performance of REPSO, EPSO and PSO when tested using 69 bus distribution systems. It can be seen that all optimization methods give the same performance in term of total power losses value. Furthermore, the size of DG for these 3 methods is also quite similar where DGs that operate at buses 11, 17, 50 and 61 is running at approximately 0.49 MW, 0.37 MW, 0.71 MW and 1.67 MW respectively. Fig. 4 shows the reduction and increment of the DG’s capacity when optimization is implemented. The capacity of DGs 1 and 2 were reduced significantly whilst the capacity of DG 4 was increased substantially from the initial stage. Meanwhile, there were very minute decrements in the size of DG 3.
TABLE II THE PERFORMANCE OF PSO,EPSO AND REPSO FOR 69 BUS
SYSTEMS
Location (bus)
Initial
Stage PSO EPSO REPSO
DG 1 (MW) 61 1.8327 1.672 1.6716 1.672
DG 2 (MW) 17 0.5057 0.3772 0.3797 0.3788
DG 3 ( MW) 50 0.7176 0.7157 0.716 0.717
DG 4 ( MW) 11 0.2929 0.4935 0.4927 0.4919
Total Power Loss (kW) 2.4984 1.3240 1.3240 1.3240
Iteration - 74th 65th 44th
Computation Time (s) - 98.4231 62.9261 48.8745
0.00 0.20 0.40 0.60 0.80 1.00 1.20 1.40 1.60 1.80 2.00
DG 1 DG 2 DG 3 DG 4
DG
c
ap
ac
it
y (
M
W
)
Initial Stage PSO EPSO REPSO
[image:4.612.99.234.470.681.2]Figure 4: The differences in DG capacity for all cases Fig. 5 shows the relationship between total power generated by each unit of DG and total power losses in the network. Since the total power generated using REPSO, EPSO and PSO is nearly the same, it has given the same value of total power losses. Even though the initial condition has larger DG capacity (> 0.09 MW), it does not guarantee for the system to have lower power loss. It has been proved when the power loss at initial condition is higher than the losses
36 37 38 39 40 41 42 43 44 45 46
28 29 30 31 32 33 34 35
53 54 55 56 57 58 59 60 61 62 63 64 65
DG
2 3 4 5 6 7 8 9 10 11 12 13 14 15 16 17 18
66 67
19 20 21 22 23 24 25 26 27 51 52
47 48 49 50
DG
DG DG
68 69
after the optimization process. By resizing all the 4 units of DG, the total power losses is reduced from 2.4984 kW to 1.3240 kW which is a total of 1.1744kW of reduction or equal to 47 percent from initial power losses. Therefore, all units of DG must be configured to their optimal capacity size in order to reduce the power loss in the system.
3.3489
3.2584 3.2600 3.2597 2.4984
1.3240 1.3240 1.3240
0.0000 0.5000 1.0000 1.5000 2.0000 2.5000 3.0000
3.2000 3.2200 3.2400 3.2600 3.2800 3.3000 3.3200 3.3400 3.3600
Initial Stage PSO EPSO REPSO
T
o
ta
l P
o
w
e
r L
o
sse
s (
k
W
)
To
ta
l D
G
C
a
p
a
ci
ty
(
M
W
)
[image:5.612.78.279.150.303.2]Total DG Capacity (MW) Total Power Losses (kW)
Figure 5: Total DG Generated Power verses Total Power Losses
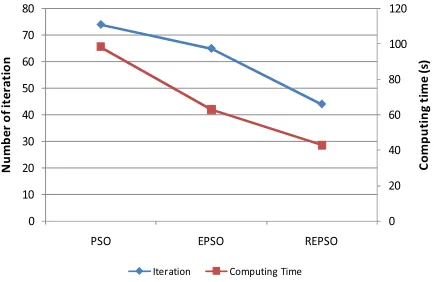
Furthermore, REPSO also gives better result in terms of processing time and number of iteration to reach the optimal value of DG sizing as shown in Fig. 6. For the traditional PSO, it requires 74 iterations followed by EPSO 65 iteration to converge. The REPSO only requires 44 iteration which is 40.54 percent lower than number of iteration that required by traditional PSO. The computing time for REPSO is also faster than EPSO and PSO where it only requires 48.8745 second to solve the optimization problem. The result shows that the adaption of EP in PSO can make the process for the particles to converge in PSO become faster as shown by EPSO and REPSO.
0 20 40 60 80 100 120
0 10 20 30 40 50 60 70 80
PSO EPSO REPSO
C
o
m
put
in
g ti
m
e (
s)
N
u
mb
er
o
f i
ter
at
io
n
Iteration Computing Time
Figure 6: Total DG Generated Power verses Total Power Losses
Since the capacity of all DG units are quite similar, the voltage profile for 69 bus network for all these three optimization method is also similar. The effect of different
value in DG size between these 3 optimization methods is too small and can be ignored. Fig. 7 shows the results on voltage value at each bus without considering optimization method and after doing the optimization method. By using optimization method, there will be some improvement on voltage value between buses 51 to 59. The other busses will have the similar value either with or without optimization method. Thus, the optimization method does not only give the lowest power losses, but also improves the overall voltage profile of the network.
Since the REPSO give the fastest solution compared to others and its performance is better than without optimization value, it can be concluded that REPSO is superior to other optimization methods and can be used to solve a complex system in the power system field.
0.9955 0.9960 0.9965 0.9970 0.9975 0.9980 0.9985 0.9990 0.9995 1.0000 1.0005
1 3 5 7 9 11 13 15 17 19 21 23 25 27 29 31 33 35 37 39 41 43 45 47 49 51 53 55 57 59 61 63 65 67 69
Vo
lt
a
g
e
(
p
.u
)
Bus Number
[image:5.612.319.556.248.407.2]Without Optimization PSO REPSO EPSO
Figure 7. Voltage profile for 69 bus distribution system VI. CONCLUSION
This paper proposed a superior method to optimize the size of DG in the distribution network using REPSO. By applying EP concept in PSO, it will allow the entire particles to move toward the optimal value in a shorter period of time as shown in EPSO and REPSO performance in the test. Furthermore, the standard deviation for the REPSO is smaller than traditional PSO and EPSO. This shows that the REPSO will have higher chances to achieve the optimal point compared to others. Besides that, the method to achieve the Pbest and Gbest value in REPSO also simpler
where it can be achieve just after the ranking and selection process.
[image:5.612.70.287.486.627.2]REFERENCES
[1] A. Soroudi and M. Ehsan, "Efficient immune-GA method for DNOs in sizing and placement of distributed generation units," European Transactions on Electrical Power, vol. 21, no. 3, Apr 2011, pp. 1361-1375.
[2] R. K. Singh and S. K. Goswami, "Optimum Siting and Sizing of Distributed Generations in Radial and Networked Systems," Electric Power Components and Systems, vol. 37, no. 2, 2009, pp. 127-145. [3] M. Afkousi-Paqaleh, A. A. T. Fard, and M. Rashidinejad,
"Distributed generation placement for congestion management considering economic and financial issues," Electrical Engineering, vol. 92, no. 6, Nov.2010, pp. 193-201.
[4] T. N. Shukla, S. P. Singh, V. Srinivasarao, and K. B. Naik, "Optimal Sizing of Distributed Generation Placed on Radial Distribution Systems," Electric Power Components and Systems, vol. 38, no. 3, 2010, pp. 260-274.
[5] T. Gozel and M. H. Hocaoglu, "An analytical method for the sizing and siting of distributed generators in radial systems," Electric Power Systems Research, vol. 79, no. 6, June 2009, pp. 912-918.
[6] C. L. T. Borges and D. M. Falcao, "Optimal distributed generation allocation for reliability, losses, and voltage improvement," International Journal of Electrical Power & Energy Systems, vol. 28, no. 6, July 2006, pp. 413-420.
[7] Zhipeng Liu, Fushuan Wen, Ledwich, G. and Xingquan Ji , “Optimal sitting and sizing of distributed generators based on a modified primal-dual interior point algorithm”, Electric Utility Deregulation and Restructuring and Power Technologies (DRPT), 2011 4th International Conference on , vol., no., 6-9 July 2011, pp.1360-1365. [8] P. Alemi, and G. B. Gharehpetian, “DG allocation using an analytical
method to minimize loss and to improve voltage security,” Power and Energy Conference, 2008, PECon 2008. IEEE 2nd International , vol., no., 1-3 Dec. 2008, pp.1575-1580.
[9] T. Gozel and M. H. Hocaoglu, “An Analytical Method for the Sizing and Siting of Distribution Generators in Radial System”, International Journal of Electric Power System Research, Vol. 79,No. 6, June 2009, pp. 912-918.
[10] Hedayati, H., Nabaviniaki, S.A., and Akbarimajd, A., “A Method for Placement of DG Units in Distribution Networks”, Power Delivery, IEEE Transactions on , vol.23, no.3, July 2008, pp.1620-1628. [11] Gareth P. Harrison, Antonio Piccolo, Pierluigi Siano and A. Robin
Wallace, “Distributed Generation Capacity Evaluation Using Combined Genetic Algorithm and OPF”, International Journal of Emerging Electric Power Systems, vol. 8, Iss. 2, Art 7, 2007, pp. 1 – 13.
[12] M. M. Elnashar, R. El Shatshat, and M. M. A. Salama, "Optimum siting and sizing of a large distributed generator in a mesh connected system," Electric Power Systems Research, vol. 80, no. 6, June 2010, pp. 690-697.
[13] A. Khanjanzadeh, M. Sedighizadeh, A. Rezazadeh, and A. Pahlavanhoseini, “Using Clonal Selection Algorithm for Sitting and Sizing of Distributed Generation in Distribution Network to Improve Voltage Profile and Reduce THD and Losses”, International Review of Electrical Engineering-IREE, vol. 6, no. 3, May 2011, pp. 1325-1331.
[14] J. Moshtagh, A. Jalali, and K. Karimizadeh, "Optimum Placement and Sizing of DG Using Binary PSO Algorithm to Achieve the Minimum Electricity Cost for Consumers," International Review of Electrical Engineering-IREE, vol. 5, no. 6, Nov 2010, pp. 2873-2881.
[15] Angeline, P.J., “Using selection to improve particle swarm optimization,” Evolutionary Computation Proceedings, 1998. IEEE World Congress on Computational Intelligence, vol., May 1998, no., pp.84-89, 4-9.
[16] R. L. Haupt, S. L. Haupt, “practicle genetic algorithms”, New Jersey: John Wiley & Sons Press, 2004.
[17] N. Rugthaicharoencheep and S. Sirisumrannukul, “Feeder Reconfiguration for Loss Reduction in Distribution System with Distributed Generators by Tabu Search”, GMSARN International Journal, vol. 3, 2009, pp. 47 – 54.