Genome Biology 2004, 5:P13
Deposited research article
The influence of RNA integrity, purity and cDNA labelling on glass
slide cDNA microarray image quality
Dachuan Guo, Belinda Cutri and Daniel R Catchpoole
Addresses: The Tumour Bank, The Oncology Research Unit, The Children’s Hospital at Westmead, Westmead, NSW 2145, Australia.
Correspondence: Daniel R Catchpoole. E-mail: [email protected]
comment
reviews
reports
deposited research
interactions
information
refereed research
.deposited research
AS A SERVICE TO THE RESEARCH COMMUNITY, GENOME BIOLOGY PROVIDES A 'PREPRINT' DEPOSITORY TO WHICH ANY ORIGINAL RESEARCH CAN BE SUBMITTED AND WHICH ALL INDIVIDUALS CAN ACCESS FREE OF CHARGE. ANY ARTICLE CAN BE SUBMITTED BY AUTHORS, WHO HAVE SOLE RESPONSIBILITY FOR THE ARTICLE'S CONTENT. THE ONLY SCREENING IS TO ENSURE RELEVANCE OF THE PREPRINT TO
GENOME BIOLOGY'S SCOPE AND TO AVOID ABUSIVE, LIBELLOUS OR INDECENT ARTICLES. ARTICLES IN THIS SECTION OF THE JOURNAL HAVE NOTBEEN PEER-REVIEWED. EACH PREPRINT HAS A PERMANENT URL, BY WHICH IT CAN BE CITED. RESEARCH SUBMITTED TO THE PREPRINT DEPOSITORY MAY BE SIMULTANEOUSLY OR SUBSEQUENTLY SUBMITTED TO GENOME BIOLOGY OR ANY OTHER PUBLICATION FOR PEER REVIEW; THE ONLY REQUIREMENT IS AN EXPLICIT CITATION OF, AND LINK TO, THE PREPRINT IN ANY VERSION OF THE ARTICLE THAT IS EVENTUALLY PUBLISHED. IF POSSIBLE, GENOME
BIOLOGYWILL PROVIDE A RECIPROCAL LINK FROM THE PREPRINT TO THE PUBLISHED ARTICLE. Posted: 16 July 2004
GenomeBiology2004, 5:P13
The electronic version of this article is the complete one and can be found online at http://genomebiology.com/2004/5/8/P13
© 2004 BioMed Central Ltd
Received: 14 July 2004
The influence of RNA integrity, purity and cDNA labelling on glass
slide cDNA microarray image quality.
Dachuan Guo1, Belinda Cutri2 and Daniel R. Catchpoole3*
The Tumour Bank, The Oncology Research Unit, The Children’s Hospital at Westmead, Westmead, NSW, 2145, Australia.
Running Title: Improving cDNA microarray quality assurance.
Submitted to Genome Biology
Date: 13/07/04
* Corresponding Author Authors Email.
The Tumour Bank, 1 [email protected]
The Children’s Hospital at Westmead 2 [email protected]
Locked Bag 4001, 3 [email protected]
Westmead, NSW, 2145 Australia
Phone: 61-2-98451205 Fax: 61-2-98453078
Abstract
Background: The accuracy of gene expression measurements generated using
cDNA microarrays is dependent on the quality of the image generated following
hybridization of fluorescently labelled cDNA. It is not known how this image is
influenced by sample preparation factors which such as RNA quality, cDNA
synthesis and labelling efficiency.
Results: In this study we used a simple metric based on the ratio of the total feature
(F) and background (B) fluorescence, which correlates with the visual assessment
of 60 microarray images, to determine the influence of sample preparation on image
quality. Results indicate that RNA purity (A260/A280) and integrity (18S:28S ratio) do
not strongly influence microarray image quality. cDNA having an nucleotide to dye
ratio greater than 100 produced poor microarray images, however, cDNA labelled
more efficiently was not a guarantee of a better image. The data also indicate that
the array image quality is not improved by loading more cDNA into the hybridization
mixture however poor image quality did result from a disproportionate amounts of
Cy5 and Cy3 labelled cDNA.
Conclusion: This study provides insight into the source of variation in microarray
image analysis introduced during sample preparation and will assist in the
Introduction
The ability to extract meaningful gene expression data from microarray experiments
is dependent upon the precision, sensitivity and reproducibility of the measured
values for each gene on the array. In the case of cDNA microarray spotted onto
glass slides, gene expression data is determined by the ratio of the relative signal of
two fluorescent Cy-dye labelled cDNA preparations that have been hybridized to the
microarray [1]. Following laser scanning of the hybridized array, a two colour image
is generated which consists of signals from the two laser-excited fluors. Image
analysis software digitally renders this image into pixels which are identified as
either corresponding to spot features, or as coming from the background [2,3]. The
intensity of the local background pixels is subtracted from the feature pixels for each
gene transcript to give the corrected intensity for each fluorescence dye [4,5]. The
ratio of the two fluorophore signals is consequently used as a relative measure of
the gene expression.
As gene expression data is generated from a multi-channel image the quality of that
image will greatly influence the accuracy of the gene expression values used for
biological inference. High quality images are a prerequisite for obtaining high
precision gene expression data [6,7]. Complex computational image metrics which
draw upon different segmentation algorithms including fixed circle, adaptive shape
and histograms [7,8], and background corrections involving Bayesian priors,
non-linear filter called ‘morphological opening’ and best-fit methods [9] are currently
being advanced. Such approaches seek to determine errors and variation in gene
expression read-outs from microarray images introduced by fluorescence intensity
fluctuations within the array, background from non-specific binding of labelled DNA,
developments, data output differences between scanners, software availability, and
a lack of appreciation of the statistical complexity of these approaches has restricted
the adoption of a common image analysis approach within the microarray research
community.
It has also been recognised that microarray generated gene expression data is also
influenced by experimental factors that can be introduced during the fabrication of
the cDNA microarrays themselves as well as the target preparation, labelling
reactions and hybridization processes [10]. The spotting and deposition of the cDNA
templates on the array slides is a recognised source of systematic bias in gene
expression data [11]. Considerable effort is being placed on optimizing spotting
conditions [12] as well as the surface chemistry [13] of the glass slides. The
accuracy of gene expression evaluation is recognised to be influenced by the quality
of the starting total RNA with this usually assessed by determining its purity using
the spectrophotometry and calculating the A260/280 ratio [14]. The integrity of the RNA
is evaluated using the relative intensity of the 28S and 18S ribosomal bands
following gel electrophoresis [6,14]. Preparation of the cDNA synthesis and
fluorescent labelling reaction has also been examined. Various studies have
compared cDNA labelling methods and have now shown that indirect labelling
protocols, which incorporates amino-allyl modified dUTP (aa-dUTP) and subsequent
coupling of Cy3 and Cy5 dyes is the preferred to direct labelling procedures as they
result in higher labelling efficiency [15,16].
Despite these improvements, the direct relationship between the quality of starting
RNA, or the degree of fluorescent dye labelling of the cDNA and the clarity of the
resulting image has not been reported. In order to examine this relationship simply
derived from 60 microarray experiments and compared the data which were
generated according to a standard indirect labelling protocol [17] and qualitatively
verified that this was an appropriate factor for distinguishing the visual quality of the
cDNA microarray image. To assist with this ‘back to basics’ approach we used the
ratio of the total combined feature fluorescence intensity (F) to total background
intensity (B) (F/B ratio) per array. Using this graded visual assessment and the F/B
ratio we examined the relationship between the microarray image clarity and several
sample preparation quality assurance indicators. Specifically, the RNA purity, RNA
integrity and cDNA labelling efficiency and the amount of cDNA present during
Material and Methods
RNA Isolation and cDNA Synthesis – RNA Purity and Integrity
The data used in our analysis was collected from a variety of microarray studies
ongoing within our laboratory with the RNA having been isolated from either frozen
bone marrow sample or CCRF-CEM (CEM) cell lines. Fourteen bone marrow
samples were obtained from the Children’s Hospital at Westmead Tumour Bank,
and were used with the approval of the hospital Human Research Ethics Committee
as well as the Tumour Bank Committee.
RNA was isolated from frozen bone marrow samples using Trizol LS (Gibco BRL)
according to a protocol optimized in our laboratory [18] whilst CEM cells (>1 x 10⁷
cells) were lysed in 1ml Trizol LS and the RNA isolated according to the
manufacturers protocol. RNA purity was assessed by determining the A260/280 ratio
by spectrophotometry. RNA (3µg) was loaded onto a 1% denaturing agarose gel,
subject to electrophoresis and the RNA visualised under UV transillumination
following staining with ethidium bromide. Gel images were taken and the intensity of
the 28S and 18S ribosomal RNA bands determined by pixel density. The 28S:18S
ratio was subsequently calculated and used as a measure of RNA integrity.
cDNA Microarray Hybridization – Labelling Efficiency
The technique used for the microarray cDNA preparation, indirect fluorescence
labelling and hybridization is per the techniques used at The Institute for Genome
Research (TIGR, USA) [17].
We combined Cy5-labelled cDNA derived from ‘test’ preparation with the
Cy3-labelled cDNA from controls and mixed with 5xSSC buffer which contained 25%
polyA, and 12µg yeast tRNA. This cocktail was denatured for 5 minutes at 95°C
prior to being hybridized to cDNA microarrays over night at 42°C. The cDNA
microarrays consist of either 6000 or 10500 sequence verified known human genes
spotted onto Telechem® slides. cDNA microarrays were obtained from the
Ramaciotti Centre for Genome Function at the University of New South Wales and
the Peter McCallum Cancer Centre. Following hybridization, the microarray was
wash in a pre-warmed (~50°C) 1xSSC solution containing 0.03%SDS for 5 minutes
followed by successive 5 minute washes in 0.2xSSC and 0.05xSSC at room
temperature. The microarrays were scanned on an Axon II Scanner with a
multi-channel image generated which was subsequently analysed with Genepix software
(Axon, USA).
Data Analysis - Calculations
For each array we determined the feature to background (F/B ratio) which is a
simple quality metric for the entire microarray image based on ‘signal to noise’
principle (4,6,19) but calculated to represent the whole array as opposed to
individual spots. To calculate the F/B ratio we selected the intensity values from the
Genepix data file for each spot or ‘Feature’ (F) and corresponding local background
(B) for each of the Cy5 (635nm, red) and Cy3 (532nm, green) fluorescence
channels detected. The F/B ratio for the entire array was calculated using the
following formula….
F/B =
Σ
i(F
532+ F
635)
…where i is each individual feature on the array.
The individual features on each array was also assessed for its signal intensity
according to the following formula….
Feature Intensity = (F532 - B532) + (F635 – B635)
The proportion of nucleotide coupled to each fluorescent dye moiety (N/D ratio) is
established as a measure of cDNA labelling efficiency and was calculated as
described in the TIGR protocol [17]. Similarly, the amount of cDNA and dye present
Results and Discussion
cDNA Microarray Image Quality Corresponds to F/B Ratio.
A practice undertaken by all who use cDNA microarray is the preliminary visual
examination of the array image upon which broad assessment of the quality of the
success of the hybridization and validity of gene expression data will be made. In
this present study, we wished to evaluate the visual appearance of the entire
microarray image and determine whether this was influence by downstream sample
preparation quality assurance measures. To achieve this we used the F/B ratio, a
broad scan of feature and background fluorescence intensity across the whole
array, as a simple quantitative metric which is representative of the visual
microarray image quality. It was chosen as it is computationally simple and
accessible for all two-colour spotted cDNA microarray analysis software tools.We
determined the F/B ratio for each of the 60 cDNA microarrays which was compared
to the quality of the image generated for each of these experiments. Qualitative
visual assessment of the microarray images was performed in a blinded fashion with
the array images categorized into 4 group according to the criteria described in
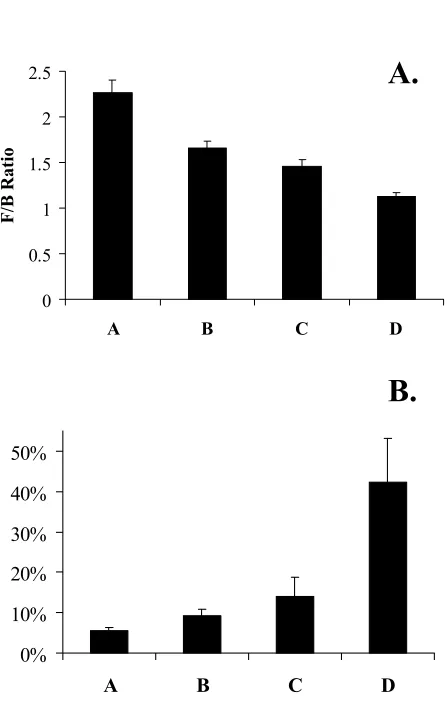
Table 1. The F/B ratio for each array was clearly correlated with the qualitative
assessment of microarray image and is shown to steadily decrease with each
category with the best microarray images having F/B ratios greater than 2.0 (Figure
1A).
The quality of an array experiment has also been determined by the number of
features on the microarray which fluoresce at a level greater than specified lowest
level cut-off which is often an arbitrary figure [6]. We determined the proportion of
features in each microarray for which the signal intensity was negative once the
eliminated from further analysis [9]. Figure 1B demonstrates that our visual
assessment of the microarray image quality corresponds to a greater number of
features having measurable gene expression values that fluoresced at levels above
background. The percentage of features was moderately inversely correlated to F/B
ratio according to Pearson correlation analysis (r = -0.503, p<0.01) and thus the
variability in the loss of readable spots on the array can be accounted for by the F/B
ratio. This correlation was not affected by the removal of outlier data points. Our
data demonstrates that there is a clear and logical relationship between the F/B ratio
and microarray image quality. It is likely that the various image segmentation and
fluorescence acquisition algorithms indicated above may create different scales of
F/B ratios [8]. However, it is uncertain that these improved image analytical
approaches will make the image look better upon visual assessment. The F/B ratio
is not intended as a spatial, feature-by-feature or even pixel-by pixel image
evaluation will only be useful when comparing image data generated using the
same analysis tool.
cDNA Microarray Image Quality and RNA Purity and Integrity.
It is generally presumed that accurate gene expression data is dependent on the
quality of the RNA isolated from the samples being examined as well as the
efficiency of the cDNA synthesis, labelling and hybridization reactions. Despite this
valid assumption, there has been scant experimental data to verify this assertion.
Spectrophotometric analysis of RNA (A260/280 ratio) in particular has been widely
accepted as an important quality assurance measures for microarray
experimentation [14] although, how the evaluation the purity of the RNA and the
presence of contaminating genomic DNA and protein influences cDNA microarray
than 1.8 to 2.0), whilst an indicator of sample purity, is not a guarantee for the intact
nature of the RNA as determined by gel electrophoresis and the 28S:18S ratio [22].
In total, our data was generated from replicate microarrays of 29 cell line and bone
marrow RNA preparations. To determine how microarray images are affected by the
quality of the starting RNA, we binned our data into groups based on the nearest
A260/280 ratio for each of the samples and compared the F/B ratios of all microarray
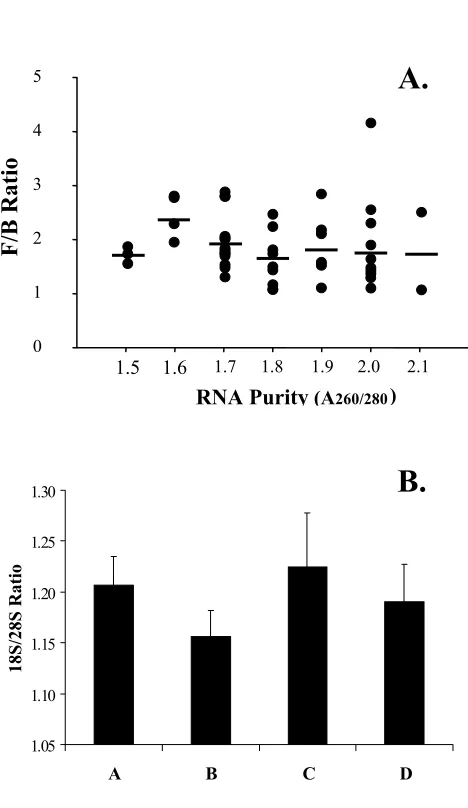
analyses with these samples. Figure 2A illustrates that RNA of lesser purity (A260/280
ratio = 1.5-1.6) did yield quality images and that Group D microarrays, having a F/B
ratio of ~1.0, actually came from experiments using more pure RNA (A260/280 ratio =
1.8-2.0). Similarly, RNA integrity, as determined by 28S to 18S ratio, did not appear
to influence F/B ratio (r = -0.160) nor associate with image quality groupings (Figure
2B). Our data demonstrates that the RNA purity and the 28S:18S ratio did not
influence the final array image quality (Figure 2A,B). Whilst the quality of the feature
and background signal on a cDNA microarray image is not influenced by starting
RNA purity and integrity, this parameters should not however be ignored. Degrading
RNA will influence the length of the cDNA transcript generated during reverse
transcription [23], which may lead to ineffective hybridization, poor signal and
ultimately, spurious gene expression values.
cDNA Microarray Image Quality and Labelling Efficiency.
How bright the fluorophore-labelled cDNA is prior to hybridization is also a
recognised factor in cDNA microarray image quality assurance. The TIGR protocol
used [17] states that for optimal hybridization 150 pmol of dye needs to be
incorporated per sample at a ratio of less that 50 nucleotide/dye molecule, although
as before, there is no definition as to how this value was experimentally deemed to
kits state that when determining the amount of dye coupled to the cDNA set the
criteria as being >40pmol of dye to >700pmol cDNA (Invitrogen)[24] or, at least 50
nucleotide per dye molecule in the case of the Stratagene Fairplay system [25]. In
all these instances there is a shortage of detail in how these parameters have been
interrogated with regards to determining the most favourable gene expression
profile. The proportion of spots that were brighter than the background, or
hybridization intensity, is one such measure of labelling efficiency [20,26].
As we have demonstrated that the proportion of measurable features is closely
correlated to the F/B ratio (Figure 1) we compared the F/B ratio to the cDNA
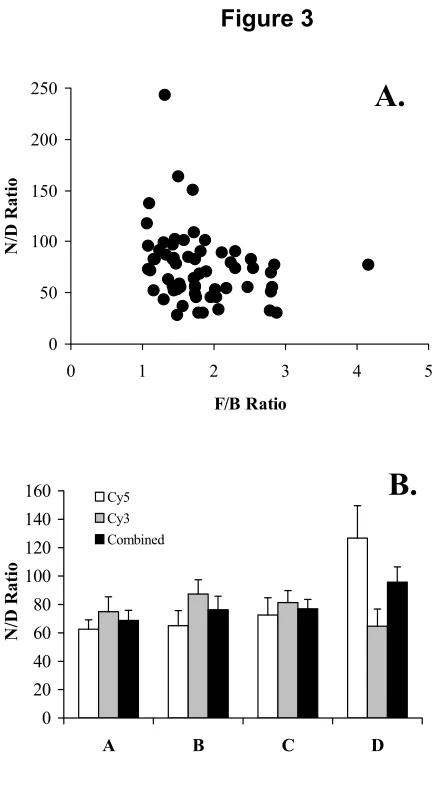
labelling efficiency calculated by the N/D ratio. There is a clear relationship between
F/B ratio and a nucleotide to dye ratio (N/D) of less than 100 (Figure 3A). N/D ratio
greater than 100 uniformly gave low F/B ratio values. This was confirmed when we
compared data based on quality assessment of the images (Figure 3B) with the
poorest images (Group D) having an average combined N/D ratio of 100. When the
N/D ratio for each Cy dye fluorophore were examined separately we discovered that
the Cy5 dye was most prone to inefficient indirect labelling and that this was
associated with poor image quality (Figure 3B, group D). It is pertinent to note
however, that well labelled cDNA probes having an N/D ratio less than 50, and even
as low as 20 nucleotides per dye molecule, also resulted in F/B ratios of less than
1.5 which is the average F/B ratio for group C results. The lack of linear relationship
between cDNA labelling efficiency and visual image quality was confirmed with
there being no strong correlation between N/D ratio and F/B ratio (r = -0.263). Our
finding that a low N/D ratio (<50) was not always associated with microarray images
with high F/B ratio (Figure 3A) suggests that other factors apart from labelling
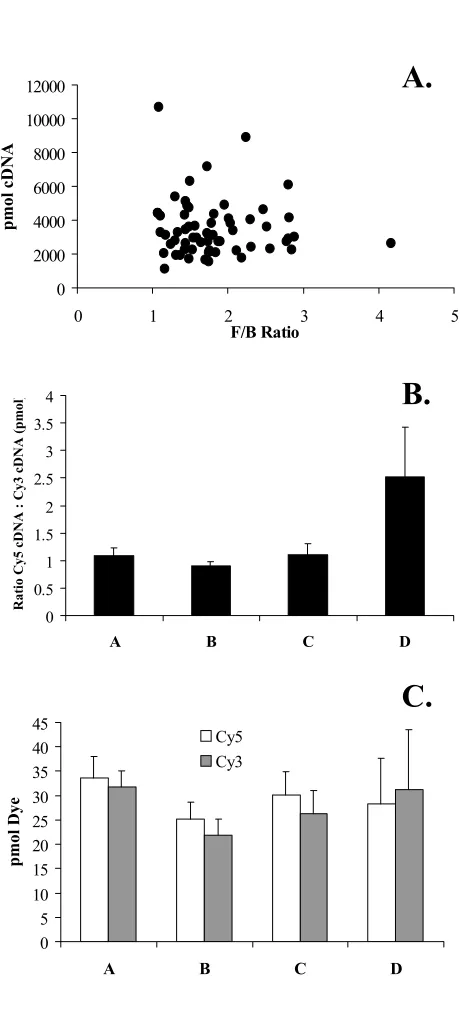
It has been considered [10] that adding more cDNA to the hybridization mixture will
produce greater consistency to microarray data. It is intriguing that commercial kits
do not specify an upper limit for the optimal amount of cDNA to be added during
hybridization. Hence, we next examined the total amount (pmol) of cDNA and Cy
dye which were added to each hybridization mixture. Figure 4A illustrates that
adding more cDNA to the microarray slide during hybridization did not yield better
microarray images. Rather, the poorest quality images (group D) were associated
with increased levels of cDNA (data not shown).
This raises the prospect that cDNA hybridization preparations can be overloaded
and that this can be a source of confounding. As the Cy5 dye is known to quench
preferentially to the Cy3 dye, there is a temptation to balance the hybridization
mixture based such that the amount of fluorescence from the two fluors is equal.
However, a more pronounced affect on image quality was observed when we
examined the ratio of the total Cy5 to Cy3 labelled cDNA in the hybridization mixture
with F/B ratio. The poorest group of microarray images (Group D) had on average
twice as much Cy5 labelled cDNA than Cy3, whilst the other quality assessment
group each averaged 1.0 (Figure 4B) and despite the level of amount (pmol) for
each of the fluorescent dyes being balanced in all cases (Figure 4C).
Conclusion
The methodological goal of all cDNA spotted glass slide microarray experiments is
to generate a high specificity of spot hybridization with a low or minimal background.
The fluorescent signal from the cDNA hybridized to the microarray generates a 16
bit multichannel TIFF image that is initially examined visually for the quality of the
feature signals, the level of background fluorescence and presence of artefacts. The
segmentation algorithms [2,3,7,19] and background correction strategies [5,7] which
determine the intensity of the emission peaks for the two fluorophores which are
being generated by each individual pixel of the image, with each pixel being
identified as part of a gene feature or as local background. An active area of
biostatistics research is the development of image analysis approaches which
improve the precision of the gene expression data extracted from cDNA microarray
experiments through improved gridding of array images [7], intensity-based or
spatial signal-background image segmentation [2,19], Bayesian approaches [21],
pixel-by-pixel feature assessment [9] and use of ‘signal to noise’ measurement as
quantitative control assessment of spot quality [4,6,19,20]. Whilst the value of such
development can not be underestimated, the absence of consensus as to the ‘best’
approach, as well as the complexity of the statistics involved, means that the
application of these image analysis applications are not common place. However,
despite this, this study provides insight into the source of variation in microarray
image analysis introduced during sample preparation and will assist in the
standardisation of cDNA glass slide microarray protocols.
Acknowledgements
This research has been financially supported by funds raised through the
philanthropic work of Kayaking for Kemo Kids for which we owe our gratitude. This
research was completed by DRC in his capacity as Research Fellow of the
References
[1] Duggan DJ, Bittner M, Chen Y, Meltzer P, Trent JM: Expression profiling
using cDNA microarrays. Nature Genetics1999, supp 21:10-14
[2] Nagarajan R: Intensity-based segmentation of microarray images.IEEE
Transactions on Medical Imaging 2003, 22:882-889
[3] Chen Y, Dougherty ER, Bittner ML: Ratio-based decisions and the
quantitative analysis of cDNA microarray images.J Biomedical Optics 1997,
2:364-374
[4] Chen Y, Kamat V, Dougherty ER, Bittner ML, Meltzer PS, Trent JM: Ratio
statistics of gene expression levels and applications to microarray data
analysis. Bioinformatics 2002, 18:1207-1215
[5] Kim JH, Shin DM, Lee YS: Effect of local background intensities in the
normalization of cDNA microarray data with a skewed expression profile.
Experimental and Molecular Medicine 2002, 34:224-232
[6] Yu J, Othman MI, Farjo R, Zareparsi S, MacNee SP, Yoshida S, Swaroop A:
Evaluation and optimization of procedures for target labelling and
hybridization of cDNA microarrays.Molecular Vision 2002, 8:130-137
[7] Yang YM, Buckley MJ, Speed TP: Analysis of cDNA microarray images.
Briefing in Bioinformatics 2001, 2:341-349
[8] Ahmed AA, Vias M, Iyer NG, Caldas C, Brenton JD: Microarray segmentation
methods significantly influence data precision. Nucleic Acid Research 2004,
[9] Brown CS, Goodwin PC, Sorger PK: Image metrics in the statistical analysis
of DNA microarray data.Proceeding of the National Acadamy of Science 2001,
98:8944-8949
[10] Franssen-van Hal NLW, Vorst O, Kramer E, Hall RD, Keijer J: Factors
influencing cDNA microarray hybridization on silylated glass slides.
Analytical Biochemistry 2002, 308:5-17
[11] Diehl F, Grahlmann S, Beier M, Hoheisel JD: Manufacturing DNA
microarrays of high spot homogeneity and reduced background signal.
Nucleic Acid Research 2001, 29:e38
[12] Rickman DS, Herbert CJ , Aggerbeck LP: Optimizing spotting solutions
for increased reproducibility of cDNA microarrays.Nucleic Acid Research
2003, 18:e109
[13] Dolan PL, Wu Y, Ista LK, Metzenberg RL, Nelson MA, Lopez GP: Robust
and efficient synthetic method for forming DNA microarrays.Nucleic Acid
Research 2001, 29:e107
[14] Baelde HJ, Cleton-Jansen A-M, van Beerendock H, Namba M, et al: High
quality RNA isolation from tumours with low cellularity and high
extracellular matrix component for cDNA microarrays: Application to
chondrosarcoma.Journal of Clinical Pathology 2001, 54:778-782
[15] Richter A, Schwagger C, Hentze S, Ansorge W, Hentze MW, Muckenthaler
M: Comparison of fluorescent tag DNA labelling methods used for
[16] Xiang CC, Kozhich OA, Chen M, Inman JM, Phan QN, Chen Y, Brownstein
MJ: Amine-modified random primers to label probes for DNA microarrays.
Nature Biotechnology 2002, 20:738-742
[17] Hegde P, Qi R, Abernathy K, Gay C, Dharap S, Gaspard R, Earle-Hughes J,
Snesrud E, Lee N, Quackenbush J: A concise guide to cDNA microarray
analysis. Biotechniques 2000, 29:548-562
[18] Barbaric D, Dalla-Pozza L, Byrne JA: A reliable method for total RNA
extraction from frozen human bone marrow samples taken at diagnosis of
acute leukaemia. J Clinical Pathology 2002, 55:65-867
[19] Wang X, Ghosh S, Guo S-W: Quantitative quality control in microarray
image processing and data acquisition. Nucleic Acid Research 2001, 29:e75
[20] Manduchi E, Scearce LM, Brestelli JE, Grant GR, Kaestner KH, Stoeckert
CJ: Comparison of different labelling methods for two-channel
high-density microarray experiments.Physiological Genomics 2002, 10:169-179
[21] Kooperberg C, Fazzio TG, Delrow JJ, Tsukiyama T: Improved background
correction for spotted DNA microarrays. J Computational Biology 2002, 9
:55-66
[22] Guo D, Catchpoole D: Isolation of intact RNA following cryosection of
archived frozen tissue.Biotechniques 2003, 34:48-50
[23] Wildsmith SE, Elcock FJ: Microarrays under the microscope.Journal of
[24] Invitrogen Superscript Indirect Labelling System Catalog Nos L1014-01 and
L1014-02 Version B, May 2003
[25] Fair Play® Microarray Labelling Kit Instruction Manual,
[www.stratagene.com]
[26] ‘t Hoen PAC, de Kort F, van Ommen GJ, den Dunnen JT: Fluorescent
labelling of cRNA for microarray applications. Nucleic Acid Research 2003,
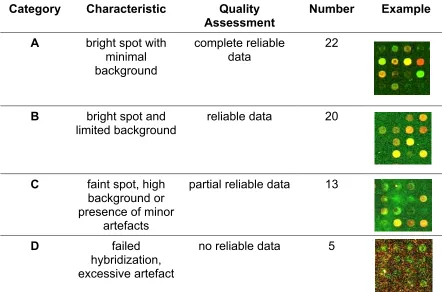
Table 1 Criteria for the qualitative assessment of cDNA microarray images.
Category Characteristic Quality
Assessment
Number Example
A bright spot with
minimal background
complete reliable data
22
B bright spot and
limited background
reliable data 20
C faint spot, high
background or presence of minor
artefacts
partial reliable data 13
D failed
hybridization, excessive artefact
Figure Legends
Figure 1 – F/B ratio corresponds to cDNA microarray image quality. A. Comparison of the average F/B ratio (y-axis) for each image quality category, described in Table 1. B. The average proportion expressed as a % (y-axis), of microarray features with in each array which were deemed undetectable due to having a negative signal intensity compared to local background intensity for each image quality category. The standard error is indicated by the error bars for each column.
Figure 2 – Evaluation of the influence of RNA quality on cDNA microarray images. A. Spectrophotometric assessment (A260/280) of RNA purity compared to the F/B
ratio. The mean F/B ratio for each bin is represented by the bars. B. RNA integrity as determined by the density of the 18S and 28S ribosomal bands is compared to the image quality category. The standard error is indicated by the error bars for each column.
Figure 3 – The effect of cDNA labelling efficiency on cDNA microarray image attributes. A. cDNA labelling efficiency, as determined by the average N/D ratio, for both Cy5 and Cy3 labelled cDNA preparations for each microarray experiment is directly compared to the F/B ratio. B. The labelling efficiency for both the Cy5 and Cy3 labelled cDNA preparations as well as the average (combined) N/D ratio is shown for each quality assessment category. The standard error is indicated by the error bars for each column.
Figure 1
0 0.5 1 1.5 2 2.5
A B C D
F/B Ratio
A.
B.
0% 10% 20% 30% 40% 50%
Figure 2
1.05 1.10 1.15 1.20 1.25 1.30
A B C D
18S/28S Ratio
B.
F/B Ratio
RNA Purity(A260/280)
1.5 1.6 1.7 1.8 1.9 2.0 2.1
A.
Figure 3
0 20 40 60 80 100 120 140 160
A B C D
N/D Ratio
Cy5 Cy3 Combined
B.
0 50 100 150 200 250
0 1 2 3 4 5
F/B Ratio
N/
D Rati
o
Figure 4 0 2000 4000 6000 8000 10000 12000
0 1 2 3 4 5
F/B Ratio pmo l cDNA 0 5 10 15 20 25 30 35 40 45
A B C D
pmol Dye Cy5 Cy3 0 0.5 1 1.5 2 2.5 3 3.5 4
A B C D
Ra
tio
Cy
5 cDNA : Cy
3 cDNA (pm
ol
)