comm
en
t
re
v
ie
w
s
re
ports
de
p
o
si
te
d r
e
se
a
rch
refer
e
e
d
re
sear
ch
interacti
o
ns
inf
o
rmation
Molecular processes during fat cell development revealed by gene
expression profiling and functional annotation
Hubert Hackl
¤
*
, Thomas Rainer Burkard
¤
*†
, Alexander Sturn
*
,
Renee Rubio
‡
, Alexander Schleiffer
†
, Sun Tian
†
, John Quackenbush
‡
,
Frank Eisenhaber
†
and Zlatko Trajanoski
*
Addresses: *Institute for Genomics and Bioinformatics and Christian Doppler Laboratory for Genomics and Bioinformatics, Graz University of Technology, Petersgasse 14, 8010 Graz, Austria. †Research Institute of Molecular Pathology, Dr Bohr-Gasse 7, 1030 Vienna, Austria. ‡ Dana-Farber Cancer Institute, Department of Biostatistics and Computational Biology, 44 Binney Street, Boston, MA 02115.
¤ These authors contributed equally to this work.
Correspondence: Zlatko Trajanoski. E-mail: [email protected]
© 2005 Hackl et al.; licensee BioMed Central Ltd.
This is an open access article distributed under the terms of the Creative Commons Attribution License (http://creativecommons.org/licenses/by/2.0), which permits unrestricted use, distribution, and reproduction in any medium, provided the original work is properly cited.
Gene-expression during fat-cell development
<p>In-depth bioinformatics analyses of expressed sequence tags found to be differentially expressed during differentiation of 3T3-L1 pre-adipocyte cells were combined with de novo functional annotation and mapping onto known pathways to generate a molecular atlas of fat-cell development.</p>
Abstract
Background: Large-scale transcription profiling of cell models and model organisms can identify
novel molecular components involved in fat cell development. Detailed characterization of the sequences of identified gene products has not been done and global mechanisms have not been investigated. We evaluated the extent to which molecular processes can be revealed by expression profiling and functional annotation of genes that are differentially expressed during fat cell development.
Results: Mouse microarrays with more than 27,000 elements were developed, and transcriptional
profiles of 3T3-L1 cells (pre-adipocyte cells) were monitored during differentiation. In total, 780 differentially expressed expressed sequence tags (ESTs) were subjected to in-depth bioinformatics analyses. The analysis of 3'-untranslated region sequences from 395 ESTs showed that 71% of the differentially expressed genes could be regulated by microRNAs. A molecular atlas of fat cell development was then constructed by de novo functional annotation on a sequence segment/ domain-wise basis of 659 protein sequences, and subsequent mapping onto known pathways, possible cellular roles, and subcellular localizations. Key enzymes in 27 out of 36 investigated metabolic pathways were regulated at the transcriptional level, typically at the rate-limiting steps in these pathways. Also, coexpressed genes rarely shared consensus transcription-factor binding sites, and were typically not clustered in adjacent chromosomal regions, but were instead widely dispersed throughout the genome.
Conclusions: Large-scale transcription profiling in conjunction with sophisticated bioinformatics analyses can provide not only a list of novel players in a particular setting but also a global view on biological processes and molecular networks.
Published: 19 December 2005
Genome Biology 2005, 6:R108 (doi:10.1186/gb-2005-6-13-r108)
Received: 21 July 2005 Revised: 23 August 2005 Accepted: 8 November 2005 The electronic version of this article is the complete one and can be
Background
Obesity, the excess deposition of adipose tissue, is among the most pressing health problems both in the Western world and in developing countries. Growth of adipose tissue is the result of the development of new fat cells from precursor cells. This process of fat cell development, known as adipogenesis, leads to the accumulation of lipids and an increase in the number and size of fat cells. Adipogenesis has been extensively
stud-ied in vitro for more than 30 years using the 3T3-L1
preadi-pocyte cell line as a model. This cell line was derived from disaggregated mouse embryos and selected based on the pro-pensity of these cells to differentiate into adipocytes in culture [1]. When exposed to the appropriate adipogenic cocktail con-taining dexamethasone, isobutylmethylxanthine, insulin, and fetal bovine serum, 3T3-L1 preadipocytes differentiate into adipocytes [2].
Experimental studies on adipogenesis have revealed many important molecular mechanisms. For example, two of the CCAAT/enhancer binding proteins (C/EBPs; specifically C/ EBPβ and C/EBPδ) are induced in the early phase of differen-tiation. These factors mediate transcriptional activity of C/
EBPα and peroxisome proliferator-activated receptor
(PPAR)-gamma (PPARγ) [3,4]. Another factor, the basic
helix-loop-helix (bHLH) transcription factor adipocyte deter-mination and differentiation dependent factor 1/sterol regu-latory element binding protein 1 (ADD1/SREBP1c), could potentially be involved in a mechanism that links lipogenesis and adipogenesis. ADD1/SREBP1c can activate a broad pro-gram of genes that are involved in fatty acid and triglyceride metabolism in both fat and liver, and can also accelerate adi-pogenesis [5]. Activation of the adiadi-pogenesis process by ADD1/SREBP1c could be effected via direct activation of PPARγ [6] or through generation of endogenous ligands for PPARγ [7].
Knowledge of the transcriptional network is far from com-plete. In order to identify new components involved in fat cell development, several studies using microarrays have been initiated. These studies have used early Affymetrix technol-ogy [8-14] or filters [15], and might have missed many genes that are important to the development of a fat cell. The prob-lem of achieving broad coverage of the developmental tran-scriptome became evident in a mouse embryo expressed sequence tag (EST) project, which revealed that a significant fraction of the genes are not represented in the collections of genes previously available [16]. Moreover, earlier studies on adipogenesis [8-14] focused on gene discovery for further functional analyses and did not address global mechanisms.
We conducted the present study to evaluate the extent to which molecular processes underlying fat cell development can be revealed by expression profiling. To this end, we used a recently developed cDNA microarray with 27,648 ESTs [17], of which 15,000 are developmental ESTs representing 78% novel and 22% known genes [18]. We then assayed expression
profiles from 3T3-L1 cells during differentiation using biolog-ical and technbiolog-ical replicates. Finally, we performed
compre-hensive bioinformatics analyses, including de novo
functional annotation and curation of the generated data within the context of biological pathways. Using these meth-ods we were able to develop a molecular atlas of fat cell devel-opment. We demonstrate the power of the atlas by highlighting selected genes and molecular processes. With this comprehensive approach, we show that key loci of tran-scriptional regulation are often enzymes that control the rate-limiting steps of metabolic pathways, and that coexpressed genes often do not share consensus promoter sequences or adjacent locations on the chromosome.
Results
Expression profiles during adipocyte differentiation The 3T3-L1 cell line treated with a differentiation cocktail was used as a model to study gene expression profiles during adi-pogenesis. Three independent time series differentiation experiments were performed. RNA was isolated at the pre-confluent stage (reference) and at eight time points after con-fluence (0, 6, 12, 24, 48 and 72 hours, and 7 and 14 days). Gene expression levels relative to the preconfluent state were determined using custom-designed microarrays with spotted polymerase chain reaction (PCR) products. The microarray developed here contains 27,648 spots with mouse cDNA clones representing 16,016 different genes (UniGene clus-ters). These include 15,000 developmental clones (the NIA cDNA clone set from the US National Institute of Aging of the National Institutes of Health NIH), 11,000 clones from differ-ent brain regions in the mouse (Brain Molecular Anatomy Project [BMAP]), and 627 clones for genes which were selected using the TIGR Mouse Gene Index, Build 5.0 [19].
comm
en
t
re
v
ie
w
s
re
ports
refer
e
e
d
re
sear
ch
de
p
o
si
te
d r
e
se
a
rch
interacti
o
ns
inf
o
[image:3.612.55.555.85.705.2]rmation
Figure 1 (see legend on next page)
1
2
3
4
5
6
7
8
9
10
11
12
Cluster 2 (64 ESTs) Cluster 1 (18 ESTs)
Cluster 5 (66 ESTs)
Cluster 6 (46 ESTs) Cluster 3 (30 ESTs)
Cluster 4 (26 ESTs)
-3.0 1:1 3.0
0h 6h 12h 24h 48h 72h 7d 14d
Cluster 8 (151 ESTs) Cluster 7 (26 ESTs)
Cluster 11 (26 ESTs)
Cluster 12 (91 ESTs) Cluster 10 (103 ESTs) Cluster 9 (132 ESTs)
+3
+2
+1
-1
-2
-3 0
0h 6h 12h 24h
+3
+2
+1
-1
-2
-3 0
0h 6h 12h 24h 2d 3d 7d 14d +3
+2
+1
-1
-2
-3 0
0h 6h 12h 24h 2d 3d 7d 14d +3
+2
+1
-1
-2
-3 0
0h 6h 12h 24h 2d 3d 7d 14d +3
+2
+1
-1
-2
-3 0
0h 6h 12h 24h 2d 3d 7d 14d +3
+2
+1
-1
-2
-3 0
0h 6h 12h 24h 2d 3d 7d 14d +5
+4
+3
+2
+1
0
-1
0h 6h 12h 24h 2d 3d 7d 14d
+3
+2
+1
-1
-2
-3 0
0h 6h 12h 24h 2d 3d +3
+2
+1
-1
-2
-3 0
0h 6h 12h 24h 2d 3d 7d 14d
+3
+2
+1
-1
-2
-3 0
0h 6h 12h 24h 2d 3d 7d 14d +3
+2
+1
-1
-2
-3 0
0h 6h 12h 24h 2d 3d 7d 14d
+3
+2
+1
-1
-2
-3 0
described in the following text were conducted in the set of 780 ESTs.
Validation of expression data
Four lines of evidence support the quality of our data and its consistency with existing knowledge of fat cell biology. First, our array data are consistent with reverse transcriptase (RT)-PCR analysis. We compared the microarray data with quanti-tative RT-PCR for six different genes (Pparg [number 592, cluster 6], Lpl [number 14, cluster 6], Myc [number 224, clus-ter 11], Dcn [number 137, cluster 7], Ccna2 [number 26, clus-ter 5/8], and Klf9 [number 6, cluster 9]) at different time points (Additional data file 9 and on our website [20]). A high degree of correlation was found (r2 = 0.87), confirming the validity of the microarray data.
Second, statistical analyses of the independent experiments showed that the reproducibility of the generated data is very high. The Pearson correlation coefficient between the repli-cates was between 0.73 and 0.97 at different time points. The mean coefficient of variation across all genes at each time point was between 0.11 and 0.27. The row data and the details of the statistical analyses can be found in Additional data file 10 and on our website [20].
Third, comparison between our data and the Gene Atlas V2 mouse data for adipose tissue [21] shows that the consistency of the two data sets increases with differentiation state (Addi-tional data files 11 and 12, and our on website [20]). There-fore, this analysis supports the relevance of the chosen cell model to in vivo adipogenesis. Among the 382 transcription-ally modulated genes common in both data sets, 67% are reg-ulated in the same direction at time point zero (confluent pre-adipocyte cell culture). At the final stage of differentiation, the correlation increases up to 72%. If the Gene Atlas expression data are restricted to strongly regulated genes (at least two-fold and fourtwo-fold change respectively), then the consistency in mature adipocytes rises to 82% (135 genes) and 93% (42 genes), respectively. Out of all 60 tissues in the Gene Atlas V2 mouse, the adipose tissue describes the differentiated state of the 3T3-L1 cells best. Brown fat tissue is the second best match to the differentiated adipocytes (69% of the 382 genes), followed by adrenal gland (66%), kidney (65%), and heart (64%). At each time point in which cell cycle genes were not repressed (12 hours and 24 hours), all tissues had similar correlation to the data set (44-55% for 382 genes).
The fourth line of evidence supporting the quality of our data is that there is clear correspondence between our data and a
previously published data set [8]. For a group of 153 genes shared among the two studies, the same upregulation or downregulation was found for 72-89% (depending on time point) of all genes (see Additional data file 13 and our website [20]). The highest identity (89%) was found for the stage ter-minally differentiated 3T3-L1 cells, for which the profile is less dependent on the precise extraction time. If the compar-ison is restricted to expression values that are strongly regu-lated in both experiments (at least twofold change at day 14, 96 ESTs), then the coincidence at every time point is greater than 90%. Comparisons with this [8] and two additional data sets [9,12], and the data pre-processing steps are given in Additional data files 13, 14, 15 and on our website [20]. Note that, because of the differences in the used microarray plat-forms, availability of the data, normalization methods, and annotations, only 96 genes are shared between all four stud-ies. Of the 780 ESTs monitored in our work, 326 were not detected in the previous studies [8,9,12]: 106 RefSeqs (with prefix NM), 43 automatically generated RefSeqs (with prefix XM), and 173 ESTs (Additional data file 16).
Correspondence between transcriptional coexpression and gene function
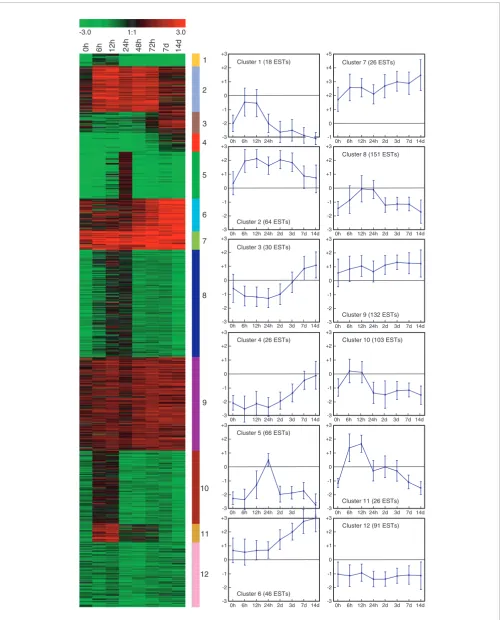
To examine the relationships between coexpression and gene functions, we first clustered 780 ESTs that were twofold dif-ferentially expressed into 12 temporally distinct patterns, containing between 23 and 143 ESTs (Figure 1). ESTs in four of the clusters are mostly upregulated during adipogenesis, whereas genes in the other eight clusters are mostly downregulated.
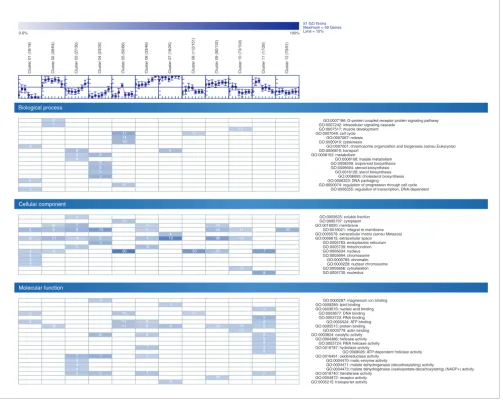
We then categorized ESTs with available RefSeq annotation and Gene Ontology (GO) term (486 out of 780) for molecular function, cellular component, and biological process (Figure 2). Genes in clusters 5 and 8 are downregulated through the whole differentiation process and upregulated at 12/24 hours. Many of the proteins encoded by these genes are involved in cell cycle processes and were residing in the nucleus (Figure 2). Re-entry into the cell cycle of growth arrested pre-adipocytes is known as the clonal expansion phase and considered to be a prerequisite for terminal differ-entiation in 3T3-L1 adipocytes [22]. Genes grouped in cluster 2 are highly expressed from 6 hours (onset of clonal expan-sion) to 3 days (start of the appearance of adipocyte morphol-ogy) but are only modestly expressed at the terminal adipocyte differentiation stage. These include a number of genes that encode signaling molecules. Genes increasingly expressed toward the terminal differentiation stage are in clusters 4, 6, and 7, although from different starting values. Clustering of ESTs found to be differentially expressed during fat cell differentiation
Figure 1 (see previous page)
Clustering of ESTs found to be differentially expressed during fat cell differentiation. Shown is k-means clustering of 780 ESTs found to be more than twofold upregulated or downregulated at a minimum of four time points during fat cell differentiation. ESTs were grouped into 12 clusters with distinct expression profiles. Relative expression levels (log2 ratios) for EST gene at different time points are shown and color coded according to the legend at the
comm
en
t
re
v
ie
w
s
re
ports
refer
e
e
d
re
sear
ch
de
p
o
si
te
d r
e
se
a
rch
interacti
o
ns
inf
o
rmation
Some genes in cluster 6 are known players in lipid metabo-lism and mitochondrial fatty acid metabometabo-lism, whereas some genes can be associated with cholesterol biosynthesis and related to extracellular space or matrix in clusters 4 and 7, respectively.
Correspondence between coexpression and targeting by microRNAs
Previous studies suggest that protein production for 10% or more of all human and mouse genes are regulated by microR-NAs (miRmicroR-NAs) [23,24]. miRmicroR-NAs are short, noncoding, single-strand RNA species that are found in a wide variety of organ-isms. miRNAs cause the translational repression or cleavage of target messages [25]. Some miRNAs may behave like small interfering RNAs. It appears that the extent of base pairing
between the small RNA and the mRNA determines the bal-ance between cleavage and degradation [26]. Rules for matches between miRNA and target messages have been deduced from a range of experiments [24] and applied to the prediction and discovery of mammalian miRNA targets [23,27]. Moreover, it was shown that human miRNA-143 is involved in adipocyte differentiation [28].
[image:5.612.55.558.90.493.2]Here we conducted an analysis to determine which of the 780 ESTs differentially expressed during adipocyte differentia-tion were potential targets of miRNAs and whether there is an over-representation of miRNA targets of coexpressed ESTs clustered in 12 distinct expression patterns. From the 780 ESTs, the 3'-untranslated region (UTR) could be derived for 539. Of these, 518 had at least one exact antisense match for Distribution of GO terms for genes/ESTs in each cluster
Figure 2
Distribution of GO terms for genes/ESTs in each cluster. The GO terms listed here are those present in at least 15% of the genes within the cluster. In brackets are the number of genes/ESTs with associated GO terms and the number of genes/ESTs within the cluster. EST, expressed sequence tag; GO, Gene Ontology.
Biological process
Molecular function Cellular component
Cluster 01 (18/18) Cluster 02 (39/64) Cluster 03 (27/30) Cluster 04 (23/26) Cluster 05 (50/66) Cluster 06 (33/46) Cluster 07 (18/26) Cluster 08 (112/151) Cluster 09 (92/132) Cluster 10 (73/103) Cluster 11 (17/26) Cluster 12 (70/91)
0.0% 100%
51 GO Terms Maximum = 50 Genes Limit = 15%
GO:0007186: G-protein coupled receptor protein signaling pathway GO:0007242: intracellular signaling cascade
GO:0007517: muscle development GO:0007049: cell cycle GO:0007067: mitosis GO:0000910: cytokinesis
GO:0007001: chromosome organization and biogenesis (sensu Eukaryota) GO:0006810: transport
GO:0008152: metabolism
GO:0006108: malate metabolism GO:0008299: isoprenoid biosynthesis GO:0006694: steroid biosynthesis GO:0016126: sterol biosynthesis GO:0006695: cholesterol biosynthesis GO:0006323: DNA packaging
GO:0000074: regulation of progression through cell cycle GO:0006355: regulation of transcription, DNA-dependent
GO:0005625: soluble fraction GO:0005737: cytoplasm GO:0016020: membrane GO:0016021: integral to membrane GO:0005578: extracellular matrix (sensu Metazoa) GO:0005615: extracellular space GO:0005783: endoplasmic reticulum GO:0005739: mitochondrion GO:0005634: nucleus GO:0005694: chromosome GO:0000785: chromatin GO:0000228: nuclear chromosome GO:0005856: cytoskeleton GO:0005730: nucleolus
GO:0000287: magnesium ion binding GO:0008289: lipid binding GO:0003676: nucleic acid binding GO:0003677: DNA binding GO:0003723: RNA binding GO:0005524: ATP binding GO:0005515: protein binding GO:0003779: actin binding GO:0003824: catalytic activity GO:0004386: helicase activity GO:0003724: RNA helicase activity GO:0016787: hydrolase activity
GO:0008026: ATP-dependent helicase activity GO:0016491: oxidoreductase activity
GO:0004470: malic enzyme activity
GO:0004471: malate dehydrogenase (decarboxylating) activity
GO:0004473: malate dehydrogenase (oxaloacetate-decarboxylating) (NADP+) activity GO:0016740: transferase activity
GO:0004872: receptor activity GO:0005215: transporter activity 11
17
4 14
17
13
10
10
30
10
11 11 6
6 5
5 7
10
5 7
4
6
7
5 6
7
3
3 3
6 4 4
4
7 8
4
5
7 4
4 4
5 6 3
3 3 3 3 3 3
5 69
11
6
5 5
7
8 4 10
50 16 24
36
20
13 11
13
7
6 22
3
5 3 3
3 3 3 3 3 14 12 15
15 3
17 3
4
the seven-nucleotide miRNA seed (base 2-8 at the 5' end) from the 234 miRNA sequences (18-24 base pairs [bp]; Additional data file 14). From 395 ESTs with a unique 3'-UTR, 282 (71%) had at least one match over-represented compared with the whole 3'-UTR sequence set (21,396; P < 0.05, by one-sided Fisher's exact test). The distribution of statistically over-represented miRNA motifs in 3'-UTRs across the clus-ters was variable, with genes grouped in cluster 9 (including many transcriptional regulators) having the most statistically over-represented miRNA motifs and genes in cluster 5 having no detectable motifs (Additional data file 18). The results of the analysis of cluster 9 are given in Figure 3. One of the genes with the most significantly over-represented miRNA motifs in the 3'-UTR is related to the ras family (Figure 3). It was pre-viously shown that human oncogene RAS is regulated by
let-7 miRNA [29]. Further potential miRNA target genes from all clusters are given in Additional data files 9, 18, 19, 20, 21, 22, 23, 24, 25, 26, 27, 28, 29, 30.
Molecular atlas of fat cell development derived by de
novo functional annotation of differentially expressed
ESTs
In order to functionally characterize the molecular compo-nents underlying adipogenesis in detail, comprehensive bio-informatics analyses of 780 differentially expressed ESTs were performed. A total of 659 protein sequences could be derived, and these were subjected to in-depth sequence ana-lytic procedures. The protein sequences have been annotated
de novo using 40 academic prediction tools integrated in the
[image:6.612.62.484.86.513.2]ANNOTATOR sequence analysis system. The structure and Genes in cluster 9 and significantly over-represented miRNA motifs (blue squares)
Figure 3
Genes in cluster 9 and significantly over-represented miRNA motifs (blue squares). miRNA, microRNA.
NM_178935 CXORF15 (4932441K18)
NM_011058 platelet derived growth factor receptor, alpha polypeptide (Pdgfra) NM_010763 mannosidase 1, beta (Man1b)
NM_173781 RAB6B, member RAS oncogene family (Rab6b)
NM_172537 sema domain, transmembrane domain (TM), and cytoplasmic domain, (semaphorin) 6D (Sema6d) NM_010284 growth hormone receptor (Ghr)
NM_173371 hexose-6-phosphate dehydrogenase (glucose 1-dehydrogenase) (H6pd) NM_020591 RIKEN cDNA A030009H04 gene (A030009H04Rik)
NM_148938 solute carrier family 1 (glial high affinity glutamate transporter), member 3 (Slc1a3) NM_080454 gap junction membrane channel protein alpha 12 (Gja12)
NM_013758 adducin 3 (gamma) (Add3) NM_008047 follistatin-like 1 (Fstl1)
NM_023719 thioredoxin interacting protein (Txnip) NM_019814 hypoxia induced gene 1 (Hig1)
NM_001001881 RIKEN cDNA 2510009E07 gene (2510009E07Rik) NM_010638 basic transcription element binding protein 1 (Bteb1) NM_011204 protein tyrosine phosphatase, non-receptor type 13 (Ptpn13) NM_010160 CUG triplet repeat,RNA binding protein 2 (Cugbp2) NM_080555 phosphatidic acid phosphatase type 2B (Ppap2b)
XM_181333 PREDICTED: RIKEN cDNA 1300001I01 gene (1300001I01Rik) NM_013587 low density lipoprotein receptor-related protein associated protein 1 (Lrpap1) NM_133792 lysophospholipase 3 (Lypla3)
NM_173440 nuclear receptor interacting protein 1 (Nrip1) NM_009572 zinc fingers and homeoboxes protein 1 (Zhx1) NM_010884 N-myc downstream regulated gene 1 (Ndrg1) NM_011055 phosphodiesterase 3B, cGMP-inhibited (Pde3b) NM_009949 carnitine palmitoyltransferase 2 (Cpt2) NM_019739 forkhead box O1 (Foxo1)
NM_153537 pleckstrin homology-like domain, family B, member 1 (Phldb1) NM_010097 SPARC-like 1 (mast9, hevin) (Sparcl1)
NM_011594 tissue inhibitor of metalloproteinase 2 (Timp2) XM_358343 PREDICTED: sulfatase 2 (Sulf2)
NM_022415 prostaglandin E synthase (Ptges) NM_054071 fibroblast growth factor receptor-like 1 (Fgfrl1)
NM_177870 solute carrier family 5 (sodium-dependent vitamin transporter), member 6 (Slc5a6) NM_144938 complement component 1, s subcomponent (C1s)
NM_011658 twist gene homolog 1 (Drosophila) (Twist1) NM_013842 X-box binding protein 1 (Xbp1)
NM_021524 pre-B-cell colony-enhancing factor 1 (Pbef1) NM_016895 adenylate kinase 2 (Ak2)
NM_019831 zinc finger protein 261 (Zfp261)
NM_026728 DNA segment, Chr 4, ERATO Doi 765, expressed (D4Ertd765e) NM_007569 B-cell translocation gene 1, anti-proliferative (Btg1) NM_007680 Eph receptor B6 (Ephb6)
NM_009930 procollagen, type III, alpha 1 (Col3a1)
NM_013760 DnaJ (Hsp40) homolog, subfamily B, member 9 (Dnajb9) NM_026159 RIKEN cDNA 0610039N19 gene (0610039N19Rik) NM_008010 fibroblast growth factor receptor 3 (Fgfr3) NM_146007 procollagen, type VI, alpha 2 (Col6a2) NM_009242 secreted acidic cysteine rich glycoprotein (Sparc)
NM_007515 solute carrier family 7 (cationic amino acid transporter, y+ system), member 3 (Slc7a3) NM_144942 cysteine sulfinic acid decarboxylase (Csad)
NM_023587 protein tyrosine phosphatase-like (proline instead of catalytic arginine), member b (Ptplb) NM_007533 branched chain ketoacid dehydrogenase E1, alpha polypeptide (Bckdha)
NM_025972 N-acylsphingosine amidohydrolase (acid ceramidase)-like (Asahl) NM_178929 Kazal-type serine protease inhibitor domain 1 (Kazald1) NM_028865 RIKEN cDNA 1110005A03 gene (1110005A03Rik)
NM_080635 eukaryotic translation initiation factor 3, subunit 3 (gamma) (Eif3s3)
mm
u-miR-222
mm
u-miR-221
mm
u-miR-201
mm
u-miR-196a
mm
u-miR-196b
mm
u-miR-30d
mm
u-miR-30e
mm
u-miR-30c
mm
u-miR-30a-5p
mm
u-miR-30b
mm
u-miR-370
mm
u-miR-199a*
mm
u-miR-195
mm
u-miR-15a
mm
u-miR-16
mm
u-miR-424
mm
u-miR-15b
mm
u-miR-182
mm
u-miR-151
mm
u-miR-344
mm
u-miR-469
mm
u-miR-200a
mm
u-miR-149
mm
u-miR-141
mm
u-miR-218
mm
u-miR-150
mm
comm
en
t
re
v
ie
w
s
re
ports
refer
e
e
d
re
sear
ch
de
p
o
si
te
d r
e
se
a
rch
interacti
o
ns
inf
o
rmation
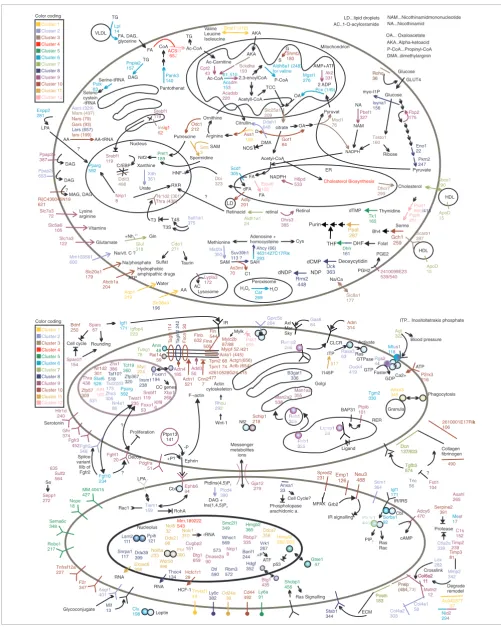
function was annotated on a sequence segment/domain-wise basis. After extensive literature search and curation using the sequence architecture, 345 gene products were mapped onto known pathways, possible cellular roles, and subcellular localizations (Figure 4) using the PathwayExplorer web serv-ice [30] as well as manual literature and domain-based assignment. The results of the sequence analyses and addi-tional information is available in the supplementary material available on our website [20] and Additional data files 6, 7, 8.
This molecular atlas of fat cell development provides the first global view of the underlying biomolecular networks and rep-resents a unique resource for deriving testable hypotheses for future studies on individual genes. Below we demonstrate the usefulness of the atlas by highlighting the following: estab-lished regulators of fat cell development, recently discovered fat cell gene products, and candidate transcription factors expressed during adipogenesis. The numbering of the genes is given according to the de novo functional annotation (Addi-tional data file 7).
Established regulators of fat cell development
Key transcription factors SREBF1 (Srebf1 [number 119, clus-ter 9]) and PPARγ (Pparg [number 592, cluster 6]) were highly expressed during the late phase of differentiation. PPARγ [31] (Pparg [number 592, cluster 6]) is increasing up to about 15-fold. Srebf1 processing is inhibited by insulin-induced gene 1 (Insig1 [number 62, cluster 3/4]) through binding of the SREBP cleavage-activation protein [32,33].
Insig1 is regulated by Srebf1 and Pparg at the transcriptional
level [34] and the expression of known marker genes of the differentiated adipocyte was increased in parallel with these factors. These include genes from clusters 3, 6, and 9 that are targets of either of these factors: lipoprotein lipase (Lpl [number 14, cluster 6]), c-Cbl-associated protein (Sorbs1
[number 92, cluster 6]), stearoyl-CoA desaturase 1 (Scd1
[number 305, cluster 6]), carnitine palmitoyltransferase II
(Cpt2 [number 43, cluster 9]), and acyl-CoA dehydrogenase
(Acadm [number 153, clusters 6 and 9]).
Recently discovered fat cell gene products
During the preparation of the manuscript, a number of fac-tors shown to be important to adipocyte function were identi-fied in vivo. All of these factors, which have a possible role in the pathogenesis of obesity and insulin resistance, were highly expressed in the present study. Adipose triglyceride lipase (Pnpla2 [number 157, cluster 6]), a patatin domain-containing triglyceride lipase that catalyzes the initial step in triglyceride hydrolysis [35], was more than 20-fold upregu-lated at the terminal differentiation phase. Another example
is Visfatin, which is identical to the pre-B cell
colony-enhanc-ing factor (Pbef [number 327, cluster 9]). This 52 kDa
cytokine has enzymatic function in adipocytes, exerts insulin-mimetic effects in cultured cells, and lowers plasma glucose levels in mice by binding to the insulin receptor [36-38]. The imprinted gene mesoderm-specific transcript (Mest [number 17, cluster 6/9]), which appears to enlarge adipocytes and could be a novel marker of the size of adipocytes [12], is upregulated during the late stage of 3T3-L1 differentiation.
Members of the Krüppel-like factor (Klf) family, also known as basic transcription element binding proteins, are relevant within the context of adipocyte differentiation. Klf2 was shown to inhibit PPARγ expression and to be a negative regu-lator of adipocyte differentiation [39]; Klf5 [40], Klf6 [41], and Klf15 [42] have been demonstrated to induce adipocyte differentiation. Whereas Klf9 (Bteb1 [number 6, cluster 9]) was upregulated in the intermediate phase in the present study, Klf4 (number 100, cluster 12), which was shown to exert effects on cell proliferation opposing those of Klf5 [43], was downregulated. Another twofold upregulated player is
Forkhead box O1 (Foxo1 [number 53, cluster 9]), which
mediates effects of insulin on the cell. Activation occurs before the onset of terminal differentiation, when Foxo1 becomes dephosphorylated and localizes to the nucleus [44,45]. The glucocorticoid-induced leucine zipper
(Tsc22d3/Gilz [number 173, cluster 2]) functions as a
tran-scriptional repressor of PPARγ and can antagonize glucocor-ticoid-induced adipogenesis [46,47]. This is consistent with our observation that Gilz is highly upregulated during the first two days, when dexamethasone is present in the medium, and downregulated at the end of differentiation,
when PPARγ is highly induced. C/EBP homologous protein
10 (Ddit3 [number 498, cluster 3]), another type of
transcrip-tional repressor that forms nonfunctranscrip-tional heterodimers with members of the C/EBP family, was early induced and then downregulated. This might be sufficient to restore the tran-scriptional activity of C/EBPβ and C/EBPδ [42]. The
tran-scription factor insulinoma-associated 1 (Insm1 [number
238, cluster 8]) is associated with differentiation into insulin-positive cells and is expressed during embryo development, where it can bind the PPARγ target Cbl-associated protein
(Sorbs1 [number 92, cluster 6]; upregulated after induction)
[48,49].
Candidate transcription factors expressed during adipogenesis Because knowledge of the transcriptional network during adi-pogenesis is far from complete, expression profiles have been generated and screened for candidate transcription factors [8,9,12]. Here, we identified a number of transcription factors
Cellular localization of gene products
Figure 4 (see following page)
Figure 4 (see legend on previous page) Ins 6 ig1 2 citrate Acetyl-CoA NADPH dFA retinal Taldo1 160 Glucose Rohq 36 Rohq 36 Glucose GLUT4 Retinacid RXR Dhcr7 299 HDL Cholesterol HDL ApoD 15 ApoD 15 Cdo1 271 Sulfat Taurin C/EBP Ddit3 498 Nucleus Mitochondrion +Nh42+ Glul 318 Gln Dbi 323 HNF-4 ? Scarb1 397 Nr1d2 (301) Slc25a1 209 Abca1 290 Cholesterol Biosynthesis Lysine arginine Slc7a3 72 Vitamins Slc5a6 105 Slc1a3 122 Glutamate Mm103581 600
Na/vit. C ?
Na/phosphate Slc20a1 179 ATP Hydrophobic amphipathic drugs Abcb1a 204 Water Aqp1 319 Slc38a4 196 AA Slc8a1 177 Nars (79) Gars (93) AA Iars (199) AA-tRNA Ribose Fbp2 175 Eno1 22 Pyruvate Pkm2 247 OA... Oxaloacetate Pyruvat OA Mod1 76 OA Pcx (149) AMP+ATP 2 ADP D Got1 84 Citrullin Ornithine Putrescine Odc1 212 Ass1 128 Pmf1 189 Nrf2 Ac-CoA Ac-Carnitine Ac-CoA 2,3-enoylCoA Acetyll-CoA TCC Valine Leucine Isoleucine AKA..Alpha-ketoacid AKA AKA P-CoA...Propinyl-CoA P-CoA Aldh6a1 (248) for valine Cpt2 43 Aca 15 dm 3 Acadsb 220 Bcat1 (412) Pantothenat Pank3 140 CoA NA...Nicothinamid NAM...Nicothinamidmononucleotide NA NAM Pbef1 327 Methionine SAM SAH Adenosine + homocysteine C1 Cys Mat2a 350 Ahcy (66) Suv39h1 113 ? As3mt 70 Isyna1 156 myo-I1P Mars (497) Aars (329) Sult1a1 375 T4S T3 T3S DMA Ddah1 648 NOS DMA..dimethylarginin VLDL TG FA, DAG, glycerine FA TG Lpl 14 61, Peroxisome H O22 H O2
Cat 269 Mgst1 276 Scd1 305 ER Enpp2 281 LPA Pparg 592 Aldh1a1 24 Retinol Dhrs3 385 G S Shmt2 180 LD LD...lipid droplets Ri|C430045N19 621 MAG, DAG ? SAM Spermidine Nrip1 8 Srebf1 119 Srebf1 119 Lysosome Lypla3 172 AC..1-O-acylceramide AC Ppap2b 387 DAG Thra (438) Serine /418 Psph 261 Arginine 510 4631427C17Rik 293 NADPH FA TG DAG FA Elovl6 162 ? Gch1 259 Bh4 Ppat 287 Purin DHF THF Dhfr 161 Folat NDP dNDP Deoxycytidin dCMP Dck 363 Rrm2 448 Thymidine dTMP Tk1 165 Xanthine Urate Cluster 9 Cluster 6 Cluster 10 Cluster 8 Cluster 1 Cluster 11 Cluster 7 Cluster 5 Cluster 2 Cluster 3 Cluster 4 Color coding Cluster 12 Xdh 361 H6pd 533 Adfp 201 Pnpla2 157 Srm 3 Ak2 331 Na/Ca Bck 19 dha 3 Serine-tRNA Seleno cystein -tRNA Pstk 83 Ppap2c 653 DAG Psat1 660 2410099E23 539/540 PGE2 PGH2 Lars (657) l3 2 Nucleolus Snrpa1 117 Ddx39399
Nol5 32 Ddx21 98 RNA Nolc1 310 rRNA Wdr50 496 p53 RNA Mm.189222 543 HCF-1 Gja12 279 Messenger metabolites ions Cluster 9 Ephb6 94 Cbl Ephrin Ptpn13 141 Pdgfra 51 +P? -P F--actin Fgfrl1 20 Proliferation Fgf10 234 ? Twist1 235 ? Htr1d 240 Serotonin Decoy Cluster 6 Adm 314 CLCR Cluster 10 RER Golgi Ligand Cluster 8 Ghr 374 Cluster 1 Emp1 126 Neu3 488 Grb2 IR signalling Tm4sf1 49 Ly6c382
Cd24a 38 Cluster 11 Acta1 (445) IR T agln2 242 T agln 1 14 Fscn 13 0 Flna 506 Cnn2 7 Actn1 521 Rai14
59 Tpm2 68 Mylpf 52 Prelp (484, Prelp (484, Col6a2 11 Col6a2 11 Postn 183 Postn 183 ECM ATP P2rx3 216 Ca2+ 2610001E17Rik 106 k Agt 322 Blood pressure Tgfb3 574 Tgfb3 574 Dcn 137/623 Dcn 137/623 Collagen fibrinogen Cluster 77
Cluster 5 Cluster 2 Cluster 3 Cluster 4 Matn2 12 Lox 282 Crosslink Sparc 67
Cell cycle Rounding Igf1 171 Fstl1 104 ? Sparcl1 154 Au040377 37 B3gat1 336 Ppih 121 Lsm2 111 Nol5a 233 Fbl 300 Cd44 492 F2r 347 Tnfrsf12a 227 Robo1 217 Sema6c 348 Serpine2 391 Protease Hmga2 262 Granula Anxa3 345 Phagocytosis Nope 18 Gtse1 47 Anln 48 Ly6a 91 Tcf19 360 Hmgb2 365 MM.40415 427 Shcbp1 456 Ras Signalling Anxa1 33 Phospholopase arachidonic a. Cell Cycle? Foxm1 194 CC genes Insm1 238 Banf1 244 Vrk1 267 ATF +P Zfp367 320 Stab1 344 Hdgf 352 Taf10? 518 Rg 4 s2 4 GTP GDP Faster Col4a1 58 Activate ITP Rasa3 63 Ras GTPase
comm
en
t
re
v
ie
w
s
re
ports
refer
e
e
d
re
sear
ch
de
p
o
si
te
d r
e
se
a
rch
interacti
o
ns
inf
o
rmation
the exhibit distinct kinetic profiles during adipocyte differentiation that were previously not functionally associ-ated with adipogenesis. Two transcription factors were unique to the present study (Zhx3 and Zfp367), and three more were confirmed (Zhx1, Twist1 and Tcf19) and annotated in the pathway context.
We found evidence for a role of the zinc finger and homeobox protein 3 (Zhx3 [number 306, cluster 2]). Zhx3 as well as Zinc finger and homeobox protein 1 (Zhx1 [number 386, cluster 9]) might attach to nuclear factor Y, which in turn binds many CCAAT and Y-box elements [50]. We also provide data regarding the expression of zinc finger protein 367 (Zfp367 [number 320, cluster 8]) during adipogenesis. The molecular function of Zfp367 is as yet uncharacterized.
Additionally, we provide further experimental evidence and pathway context for candidate transcription factors previ-ously identified in microarray screens [9,12], namely Twist1 and Tcf19. The Twist gene homolog 1 (Twist1 [number 235, cluster 9]) was about two- to threefold upregulated at 0 hours, 72 hours, 7 days, and 14 days. Twist1 is a reversible inhibitor of muscle differentiation [51]. Heterozygous double mutants
(Twist1-/+, Twist2-/+) exhibit loss of subcutaneous adipose
tissue and severe fat deficiency in internal organs [52]. Twist1 is a downstream target of nuclear factor-κB and can repress transcription of tumor necrosis factor-α, which is a potent repressor of adipogenesis [52,53]. The differential expression during adipogenesis of Tcf19 was also confirmed in the present study. Tcf19 is a transcription regulator that is involved in cell cycle processes at later stages in cell cycle pro-gression [54]. Expression of other regulators that are involved in the same process support this observation. Forkhead box
M1 (Foxm1 [number 194, cluster 8]) stimulates the
expres-sion of cell cycle genes (for instance the genes encoding cyclin B1 and cyclin B2, and Cdc25B and Cdk1). In addition, TAF10 RNA polymerase II, also known as TATA box binding protein-associated factor (Taf10 [number 518, cluster 8]), is involved in G1/S progression and cyclin E expression [55].
Correspondence between phenotypic changes and gene expression
In addition to the metabolic networks, the molecular atlas also provides a bird's eye view of other molecular processes, including signaling, the cell cycle, remodeling of the extracel-lular matrix, and cytoskeletal changes. Changes that occur during adipogenesis (phenotypically seen as rounding of densely packed cells) have aspects in common with other tis-sue differentiation processes such as endothelial angiogenesis (protease, collagen, and noncollagen molecule secretion) [56] and specific features. Here we show that phenotypic changes that occur in maturing adipocytes are paralleled by expres-sion of the respective genes.
Extracellular matrix remodeling
Matrix metalloproteinase-2 (MMP-2 [number 342, cluster
2]) was strongly upregulated during the entire process of adi-pocyte differentiation. Matrix metalloproteinase-2 can cleave various collagen structures and its inhibition can block adipo-genesis [57]. Tissue inhibitor of metalloproteinase-2 (Timp2 [number 239, cluster 9]), a known partner of matrix metallo-proteinase-2, which balances the activity of the proprotease/ protease [58], was mainly upregulated. Decreased levels of tissue inhibitor of metalloproteinase-3 (number 81, cluster 10; upregulated at 6 hours and repressed after 12 hours) are associated with obese mice [59]. New collagen structures of
overexpressed Col6a2 (number 11, cluster 9), Col4a1
(number 58, cluster 2) and Col4a2 (number 303, cluster 2) [60] are cross-linked by the lysyl oxidase (Lox [number 282, cluster 2]; upregulated during adipogenesis, which is con-trary to findings reported by Dimaculangan and coworkers [61]). Strongly upregulated decorin (Dcn [number 137/623, cluster 7]) and osteoblast specific factor 2 (Postn/Osf-2 [number 183, cluster 7]), as well as proline arginine-rich end
leucine-rich repeats (Prelp [number 73/484, cluster 3];
upregulated in the final stages of adipogenesis), attach the matrix to the cell. Matrillin-2 (Matn2 [number 12, cluster 9]; upregulated during adipogenesis) functions as adaptor for
noncollagen structures [62], as does nidogen 2 (Nid2
[number 294, clusters 6 and 9]; increasingly upregulated). Secreted protein acidic and rich in cysteine/osteonectin
(SPARC [number 67, cluster 9]; mainly upregulated) and
SPARC-like 1 (Sparcl1 [number 154, cluster 9]; upregulated at 0 hours, 72 hours, 7days, and 14 days) can organize extra-cellular matrix remodeling, inhibit cell cycle progression, and induce cell rounding in cultured cells [63,64].
Reorganization of the cytoskeleton
Most cytoskeletal proteins are coexpressed in cluster 10 (not repressed from 6 to 12 hours) and might have a common reg-ulatory mechanism. Transcription of actin α (Acta1 [number 445, cluster 10]) and actin γ (Actg1 [number 656, cluster 10]), tubulin α (Tuba4 [number 377, cluster 8]), and tubulin β
(Tubb5 [number 110, cluster 8]) were found to diminish
dur-ing differentiation, which is in agreement with other reports [65]. Myosin light chain 2 (Mylc2b/Mylpf [number 87/88/ 52/421, cluster 10]), and tropomyosin 1 and 2 (Tpm1/Tpm2 [number 74/68, cluster 10]) are members of the mainly repressed cluster 10. The downregulated transgelin 1 and 2
(Tagln/Tagln2 [number 114/242, cluster 10/8]) as well as
fascin homolog 1 (Fscn1 [number 30, cluster 10]) are known actin-bundling proteins [66,67]. Apparently, their absence decreases the cross-linking of microfilaments in compact par-allel bundles. Calponin 2 (Cnn2 [number 7, cluster 10]), a reg-ulator of cytokinesis, is downregulated [68]. The insulin receptor and actin binding proteins filamin α and β (Flna/
Flnb [number 506/632, cluster 10]) can selectively inhibit the
cross-linking protein actinin 1 (Actn1 [number 521, cluster 10]) share the mainly repressed expression profile. Tubulin γ 1
(Tubg1 [number 78, cluster 7]; upregulated during
adipogenesis, about 42-fold at 6 hours) is not a component of the microtubules like Tuba/Tubb, but it plays a role in organ-izing their assembly and in establishing cell polarity [70].
Actinin 4 (Actn4 [number 185, cluster 9]; upregulated
[image:10.612.66.555.113.625.2]throughout adipogenesis) differs from Actn1 in its localiza-tion. Its expression leads to higher cell motility, and it can be translocated into the nucleus upon phosphatidylinositol 3-kinase inhibition [71]. Adducin 3γ (Add3 [number 50, cluster 9]; permanently upregulated) has different actin-associated cytoskeletal roles.
Table 1
Activated metabolic pathways during adipocyte differentiation and their key enzymes (rate limiting steps)
Pathway Enzyme/Protein name Accession number Number Cluster
Urea cycle and arginine-citrulline cycles Arginine succinate synthase NP_031520 128 1/10
Phosphatidylinositol Phosphatidylinositol 3-kinase, regulatory subunit, polypeptide 1
XP_127550 446 7
Myoinositol 1-phosphate synthase A1 NP_076116 156 8 Cholesterol biosynthesis/keto-body synthesis 3-hydroxy-3-methylglutaryl-CoA synthase 1 NP_666054 178 4
3-hydroxy-3-methylglutaryl-CoA reductase XP_127496 619 12
Triglyceride hydrolysis (fatty acid assimilation) Lipoprotein lipase (LPL) NP_032535 14 6
β-Oxidation Acetyl-CoA dehydrogenase (Acad) NP_780533 61 6
Acetyl-CoA dehydrogenase, medium chain (Acadm)
NP_031408 153 6/9
Isovaleryl-CoA dehydrogenase (Acad) Mm.6635 510 6 Acyl-CoA dehydrogenase, short/branched chain
(Acadsb)
NP_080102 220 9
Triglyceride metabolism Adipose triglyceride lipase (Pnpla2/Atgl) NP_080078 157 6
CoA biosynthesis Pantothenate kinase 3 NP_666074 140 6
Anaplerotic processes Pyruvate carboxylase NP_032823 149 6
Branched chain amino acid metabolism (AKA metabolism)
Branched chain ketoacid dehydrogenase E1, α polypeptide
NP_031559 193 3/9
Methylation S-adenosylhomocysteine hydrolase NP_057870 66 8
Methionine adenosyltransferase II, α NP_663544 350 2
Unsaturated fatty acid biosynthesis Stearoyl-CoA desaturase 1 NP_033153 305 6
Nucleotide metabolism Xanthine dehydrogenase NP_035853 361 2
Taurin biosynthesis Cysteine dioxygenase NP_149026 271 7
NH4+ metabolism/glutamate Glutamate-ammonia ligase (glutamine synthase) NP_032157 318 7
Glycolysis Pyruvate kinase 3 NP_035229 247 8
Substrate cycle (glycolysis/gluconeogenesis) Fructose bisphosphatase 2 NP_032020 175 9
Nucleotide biosynthesis Deoxycytidine kinase NP_031858 363 8
Ribonucleotide reductase M2 NP_033130 448 8 Pentose phophate shunt Hexose-6-phosphate dehydrogenase (AI785303) XP_181411 533 9
NAD(P) biosynthesis Pre-B-cell colony-enhancing factor NP_067499 327 9
Polyamine biosynthesis Ornithine decarboxylase, structural NP_038642 212 10 Tetrahydrobiopterin biosynthesis GTP cyclohydrolase 1 NP_032128 259 10
Purin biosynthesis Phosphoribosyl pyrophosphate amidotransferase NP_742158 287 11
Asparagine biosynthesis Asparagine synthetase NP_036185 109 12
Long chain fatty acids ELOVL family member 6, elongation of long chain fatty acids
NP_569717 162 12
Serine biosynthesis Phosphoserine phosphatase NP_598661 261 12
Gluconeogenesis PEPCK 2 (Riken 9130022B02) NP_083270 393 12
Prostaglandin E biosynthesis Prostaglandin E synthase (ri|2410099E23; ri|9230102G02)
ri|2410099E23 ri|9230102G02
539 540
9
comm
en
t
re
v
ie
w
s
re
ports
refer
e
e
d
re
sear
ch
de
p
o
si
te
d r
e
se
a
rch
interacti
o
ns
inf
o
rmation
T-lymphoma invasion and metastasis 1 (Tiam1 [number 159, cluster 2]) is a guanine nucleotide exchange factor of the small GTPase Rac1, which regulates actin cytoskeleton, mor-phology and adhesion, and antagonizes RhoA signaling [72,73]. Additionally, the putative constitutive active Rho GTPase ras homolog gene family, member U/Wnt1 respon-sive Cdc42 homolog (Rhou/Wrch-1 [number 292, clusters 2 and 7]), which has no detectable intrinsic GTPase activity and very high nucleotide exchange capacity, leads to an pheno-type of mature adipocyte [74,75]. Interplay between Rhou
and Tiam1, which might reverse Rhou activity through Rac1
signaling [74], could be a mechanism for regulating cell mor-phology in adipogenesis.
In summary, the evidence presented above suggests that reduced replenishment of the cytoskeleton with building blocks and the strong transcriptional upregulation of modu-lating proteins, together with the extracellular remodeling, are responsible for the morphological changes that occur dur-ing differentiation of 3T3-L1 cells.
Regulation of metabolic networks at the transcriptional level via key points of pathways
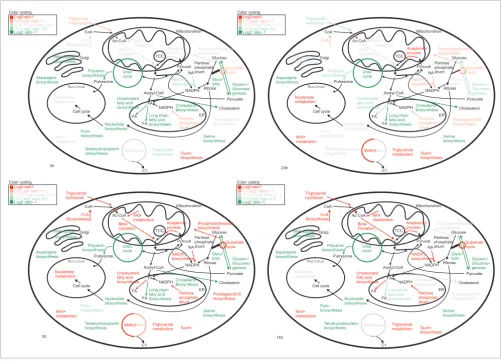
We next used the molecular atlas to derive novel biological insights from the global view of molecular processes. We ana-lyzed transcriptionally regulated genes that are members of 36 different metabolic pathways. Within each pathway, we considered whether these transcriptionally regulated genes occupy key positions, such as a position at the pathway start, which is the typical rate-limiting step where the amount of enzyme is critical [76], or at some other point of regulation. We found that such key positions are occupied by transcrip-tionally regulated targets in 27 pathways (an overview is pro-vided in Table 1). Those pathways that are strongly transcriptionally regulated at key points are illustrated in Fig-ure 5 at the time points 0, 24 and 48 hours, and 14 days. For additional time points and images with more detailed information from all investigated pathways, see our website [20] and Additional data files Additional data file 31 and Additional data file 32.
In the following discussion we present the evidence for tran-scriptional regulation at key points for five selected metabolic pathways. Further information on other pathways can be found in Additional data files 31, 32, 33, 34, 35, 36, 37, 38 and on our website [20].
Biosynthesis of the important lipogenic cofactors CoA and NAD(P)+ are transcriptionally regulated at their key enzymes
Coenzyme A (CoA) is the carrier of the fatty acid precursor
acetate/malonate [77,78]. Panthotenate kinase 3 (Pank3
[number 140, cluster 6]; about eightfold upregulated) is responsible for the first and rate-limiting step in converting panthotenate to CoA [79]. Nicotinamide adenine dinucleotide phosphate (reduced form; NADPH) is necessary in reductive reactions for fatty acid synthesis. Pre-B-cell
col-ony-enhancing factor (Visfatin/Pbef1 [number 327, cluster 9]; strongest upregulated in the last three points of the time course in parallel with the emergence of fat droplets) is the rate-limiting enzyme in NAD(P)+ biosynthesis [38,80]. For reduction of NADP+ to NADPH, two major mechanisms are responsible: the pentose phosphate shunt and the
tricarboxy-late transport system. Hexose-6P dehydrogenase (H6pd
[number 533, cluster 9]; upregulated throughout adipogene-sis) is the rate limiting enzyme of the pentose phosphate shunt in the endoplasmic reticulum and provides NADPH to its lumen [81]. In the cytosolic pendant in the pentose
phosphate shunt, the transaldolase (Taldo1 [number 160,
cluster 3]) is repressed at early stages and is about threefold upregulated at the end of 3T3-L1 differentiation. This expres-sion change appears to switch the shunt between ribose-5-phosphate (for nucleic acid synthesis) and NADPH (for fatty acid production) synthesis at early and late time points, respectively. A similar expression profile is observed for the
cytosolic NADP-dependent malic enzyme (Mod1 [number 76,
cluster 3]) and the citrate transporter (Slc25a1/Ctp1 [number 209, cluster 3]). Both are part of the tricarboxylate transport system through the mitochondrial membrane. Transcription of the anaplerotic pyruvate carboxylase (Pcx [number 149, cluster 6]; activated by acetyl-CoA) is increasingly upregu-lated up to 16-fold toward the final two time points.
Fatty acid modification and assimilation is transcriptionally regulated at the rate-limiting steps
The transcriptional expression of stearoyl-CoA desaturase 1
(Scd1 [number 305, cluster 6]), which catalyzes the
rate-lim-iting reaction of monounsaturated fatty acid synthesis and which is an important marker gene of adipogenesis [82,83], is downregulated at induction but increases up to 60-fold with advancing adipogenesis. In contrast to previous reports [82], we found that the gene for elongation of long-chain fatty acid
(Elovl6 [number 162, cluster 12]) protein, which may be the
rate-limiting enzyme of long chain elongation to stearate [84], is not overexpressed in differentiated 3T3-L1 cells as in adipose tissue. Elovl6 appears repressed during the entire process of adipogenesis in 3T3-L1 cells. Expression of lipo-protein lipase (Lpl [number 14, cluster 6]), the rate-limiting enzyme of extracellular triglyceride-rich lipoprotein hydro-lyzation and triglyceride assimilation [85-87], increases with time up to 21-fold in differentiated adipocytes.
Transcriptional regulation of triglyceride and fatty acid degradation is performed at key points
Adipose triglyceride lipase (Pnpla2/Atgl [number 157, cluster 6]) executes the initial step in triglyceride metabolism [35]. Its expression increases strongly with differentiation
progres-sion. Acyl-CoA dehydrogenases (Acadm/Acadsb [number
exhibits some upregulation at the final two time points. This difference in expression might shift the enrichment from short and medium to long chain fatty acids during
adipogen-sis. Branched chain ketoacid dehydrogenase E1 (Bckdha
[number 193, clusters 3 and 9]) is the rate-limiting enzyme of leucine, valine, and isoleucine catabolism and is known to be inhibited by phosphorylation [89]. Its gene shares a similar expression profile with the Acad genes. The elevated degrada-tion of amino acids allows conversion to fatty acids through acetyl-CoA.
Several important nucleotide biosynthetic pathway enzymes follow a cell cycle specific expression profile (strongly repressed except between 12 and 24 hours)
Phosphoribosylpyrophosphate amidotransferse (Ppat
[number 287, cluster 11]) [90] is rate-limiting for purin pro-duction. Deoxycytidine kinase (Dck [number 363, cluster 8]) is the rate-limiting enzyme of deoxycytidine (dC), deoxyguanosine (dG) and deoxyadenosine (dA)
phosphoryla-tion [91-93]. Ribonucleotide reductase M2 (Rrm2 [number
448, cluster 8]) converts ribonucleotides to desoxyribonucle-otides [94,95]. Additionally, thymidine kinase 1 (Tk1 [number 165, cluster 5]) and dihydrofolate reductase (Dhfr [number 161, cluster 5/8]) play important roles in dT and purin biosyn-thesis during the cell cycle. In contrast, purin degradation is about sixfold upregulated between 6 and 72 hours by the rate-limiting xanthine dehydrogenase (Xdh [number 361, cluster 2]) [96,97]. These findings are in concordance with those of a previous study [22], which showed that mitotic clonal expan-sion is a prerequisite for differentiation of 3T3-L1 preadi-pocytes into adipreadi-pocytes. After induction of differentiation, the growth-arrested cells synchronously re-enter the cell cycle and undergo mitotic clonal expansion, as monitored by changes in cellular DNA content [22]. In accord with this experimental evidence, we observed changes in cell cycle genes, most of which were in clusters 5 and 8 (see our website [20] and Additional data file 37).
[image:12.612.57.558.87.447.2]Temporal activation of metabolic pathways
Figure 5
Temporal activation of metabolic pathways. Summarized is the activation of metabolic pathways at different time points (0 hours, 24 hours, 3 days, and 14 days) during fat cell differentiation. Color codes are selected according to expression levels of key enzymes in these pathways at distinct time points (red = upregulated; green = downregulated).
0h 24h 3d 14d Acetyl-CoA NADPH FA Glucose Cholesterol Nucleus Mitochondrion Ribose Pyruvat Putrescine CoA Polyamin biosynthesis Cholesterol Biosynthesis CoA Biosynthesis Beta-Oxidation Urea cycle Anaplerotic process TCC Phosphatitylinosidol biosynthesis AKA metabolism Methyl Nucleotide metabolism Taurin biosynthesis Nh4+ metabolism Glyco-lysis HNK-Epitop biosynthesis Nucleotide biosynthesis NAD(P) biosynthesis Tetrahydrobiopterin biosynthesis Purin biosynthesis Asparagine biosynthesis Serine biosynthesis Ac-CoA Substrate cycle Glycero-/ Gluconeo-genesis C1 ation Golgi ER Cell cycle NA Triglyceride hydrolysis Triglyceride metabolism NADPH Pentose phosphate shunt FA FA Long chain fatty acid biosynthesis Unsaturated fatty acid biosynthesis Pentose phosphate shunt Pyruvate Log2ratio1
Log2 ratio -1
0.5 Log2ratio < 1
-0. 5 <Log2 ratio < 0.5
-1< Log2 ratio -0.5
Color coding Prostaglandin E biosynthesis Acetyl-CoA NADPH FA Glucose Cholesterol Nucleus Mitochondrion Ribose Pyruvat Putrescine CoA Polyamin biosynthesis Cholesterol Biosynthesis CoA Biosynthesis Beta-Oxidation Urea cycle Anaplerotic process TCC Phosphatitylinosidol biosynthesis AKA metabolism Methyl Nucleotide metabolism Taurin Nh4+ metabolism Glyco-lysis HNK-Epitop biosynthesis Nucleotide biosynthesis NAD(P) biosynthesis Tetrahydrobiopterin biosynthesis Purin biosynthesis Asparagine biosynthesis Serine biosynthesis Ac-CoA Substrate cycle Glycero-/ Gluconeo-genesis C1 ation Golgi ER Cell cycle NA Triglyceride hydrolysis Triglyceride metabolism NADPH Pentose phosphate shunt FA FA Long chain fatty acid biosynthesis Unsaturated fatty acid biosynthesis Pentose phosphate shunt Pyruvate Prostaglandin E biosynthesis Acetyl-CoA NADPH FA Glucose Cholesterol Nucleus Mitochondrion Ribose Pyruvat Putrescine CoA Polyamin biosynthesis Cholesterol Biosynthesis CoA Beta-Oxidation Urea cycle Anaplerotic process TCC Phosphatitylinosidol biosynthesis AKA metabolism Methyl Nucleotide metabolism Taurin biosynthesis Nh4+ metabolism Glyco-lysis HNK-Epitop biosynthesis Nucleotide biosynthesis NAD(P) biosynthesis Tetrahydrobiopterin biosynthesis Purin biosynthesis Asparagine biosynthesis Serine biosynthesis Ac-CoA Substrate cycle Glycero-/ Gluconeo-genesis C1 ation Golgi ER Cell cycle NA Triglyceride hydrolysis Triglyceride metabolism NADPH Pentose phosphate shunt FA FA Long chain fatty acid biosynthesis Unsaturated fatty acid biosynthesis Pentose phosphate shunt Pyruvate Prostaglandin E biosynthesis Acetyl-CoA NADPH FA Glucose Cholesterol Nucleus Mitochondrion Ribose Pyruvat Putrescine CoA Polyamin biosynthesis Cholesterol Biosynthesis CoA Biosynthesis Beta-Oxidation Urea cycle Anaplerotic process TCC Phosphatitylinosidol biosynthesis AKA metabolism Methyl Nucleotide metabolism Taurin biosynthesis Nh4+ metabolism Glyco-lysis HNK-Epitop biosynthesis Nucleotide biosynthesis NAD(P) biosynthesis Tetrahydrobiopterin biosynthesis Purin biosynthesis Asparagine biosynthesis Serine biosynthesis Ac-CoA Substrate cycle Glycero-/ Gluconeo-genesis C1 ation Golgi ER Cell cycle NA Triglyceride hydrolysis Triglyceride metabolism NADPH Pentose phosphate shunt FA FA Long chain fatty acid biosynthesis Unsaturated fatty acid biosynthesis Pentose phosphate shunt Pyruvate Prostaglandin E biosynthesis Log2ratio1
Log2 ratio -1
0.5 Log2ratio < 1
-0. 5 <Log2 ratio < 0.5
-1< Log2 ratio -0.5
Color coding
Log2ratio1
Log2 ratio -1
0.5 Log2ratio < 1
-0. 5 <Log2 ratio < 0.5
-1< Log2 ratio -0.5
Color coding
Log2ratio1
Log2 ratio -1
0.5 Log2ratio < 1
-0. 5 <Log2 ratio < 0.5
-1< Log2 ratio -0.5
comm
en
t
re
v
ie
w
s
re
ports
refer
e
e
d
re
sear
ch
de
p
o
si
te
d r
e
se
a
rch
interacti
o
ns
inf
o
rmation
Cholesterol biosynthesis is regulated by expression of key steps and whole pathway segments
The synthesis of the early precursor molecule 3-hydroxy-3-methylglutaryl (HMG)-CoA, which might be also used in other metabolic pathways, is transcriptionally controlled at
the key enzymes HMG-CoA synthase (Hmgcs1 [number 178,
cluster 4]; repressed except in terminal stages) and
HMG-CoA reductase (Hmgcr [number 619, cluster 12]; always
repressed), which is the rate-limiting enzyme of the choles-terol and mevalonate pathway [98,99]. After the step of iso-pentenylpyrophosphate synthesis, cholesterol biosynthesis genes are coexpressed in cluster 4.
Correspondence between coexpression and coregulation
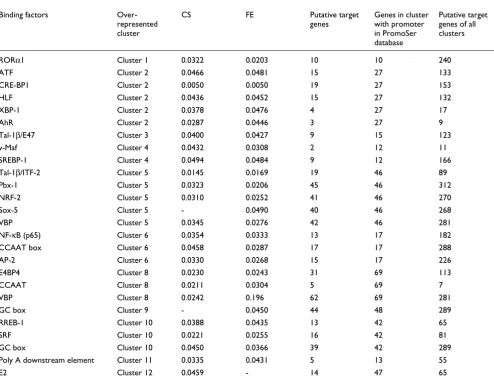
[image:13.612.56.550.117.497.2]To determine whether coexpressed genes are also coregu-lated, we analyzed the available promoter sequences of the 780 ESTs. Promoter sequences could be retrieved for 357 genes. Most ESTs are sequenced from the 3' end, and hence it is easier to retrieve the 3'-UTR. Retrieval of promoters is more difficult than retrieval of the 3'-UTR because of experi-mental problems in extracting full-length cDNAs (and hence transcription start sites) and insufficient computational methods for identifying beginning of the 5'-UTR. We ana-lyzed the occurrences of the binding sites of all transcription factors in vertebrates from the TRANSFAC database. Based on statistical analyses, among transcription factors with bind-ing site motifs described in TRANSFAC [100] those listed in
Table 2
Transcription factors that could regulate co-expressed genes in each cluster
Binding factors Over-represented cluster
CS FE Putative target
genes
Genes in cluster with promoter in PromoSer database
Putative target genes of all clusters
RORα1 Cluster 1 0.0322 0.0203 10 10 240
ATF Cluster 2 0.0466 0.0481 15 27 133
CRE-BP1 Cluster 2 0.0050 0.0050 19 27 153
HLF Cluster 2 0.0436 0.0452 15 27 132
XBP-1 Cluster 2 0.0378 0.0476 4 27 17
AhR Cluster 2 0.0287 0.0446 3 27 9
Tal-1β/E47 Cluster 3 0.0400 0.0427 9 15 123
v-Maf Cluster 4 0.0432 0.0308 2 12 11
SREBP-1 Cluster 4 0.0494 0.0484 9 12 166
Tal-1β/ITF-2 Cluster 5 0.0145 0.0169 19 46 89
Pbx-1 Cluster 5 0.0323 0.0206 45 46 312
NRF-2 Cluster 5 0.0310 0.0252 41 46 270
Sox-5 Cluster 5 - 0.0490 40 46 268
VBP Cluster 5 0.0345 0.0276 42 46 281
NF-κB (p65) Cluster 6 0.0354 0.0333 13 17 182
CCAAT box Cluster 6 0.0458 0.0287 17 17 288
AP-2 Cluster 6 0.0330 0.0268 15 17 226
E4BP4 Cluster 8 0.0230 0.0243 31 69 113
CCAAT Cluster 8 0.0211 0.0304 5 69 7
VBP Cluster 8 0.0242 0.196 62 69 281
GC box Cluster 9 - 0.0450 44 48 289
RREB-1 Cluster 10 0.0388 0.0435 13 42 65
SRF Cluster 10 0.0221 0.0255 16 42 81
GC box Cluster 10 0.0450 0.0366 39 42 289
Poly A downstream element Cluster 11 0.0335 0.0431 5 13 55
E2 Cluster 12 0.0459 - 14 47 65
Table 2 are the most promising candidates for further func-tional studies on transcripfunc-tional regulation.
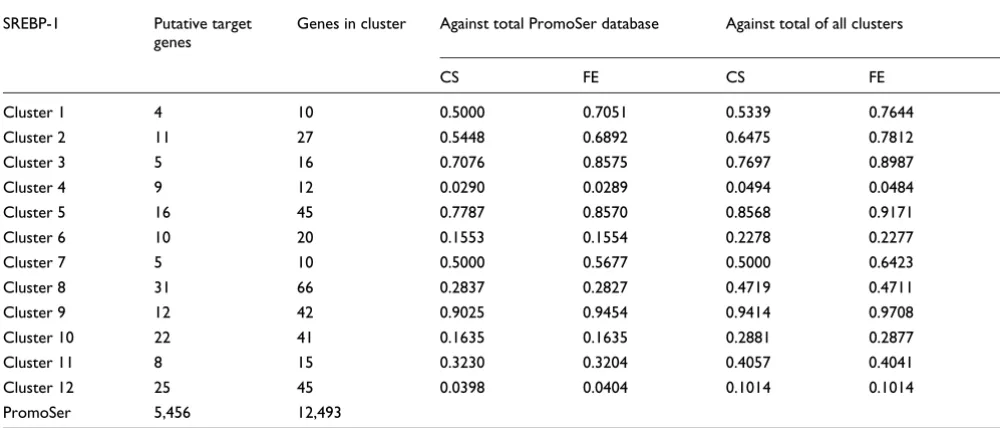
One example of a functional transcription factor binding site is SREBP-1 in cluster 4. A comparison among clusters showed that cluster 4 has significantly more genes with a SREBP-1 (SRE and E-box motifs [101]) binding site than all other clus-ters (P = 0.0484, Fisher's exact test; Table 3). Similarly, a putative SREBP-1 regulatory region is significantly more fre-quent in the promoters of the genes in cluster 4 compared with all unique sequences in the PromoSer database (P < 0.0289; PromoSer contains 22,549 promoters of 12,493 unique sequences). For a subset of the genes in cluster 4 with predicted SREBP-1 binding site (most genes of the cholesterol biosynthesis pathway), transcriptional regulation with SREBP-1 has been experimentally proven [102].
Surprisingly, binding sites for the key regulators of adipogen-esis, namely PPAR and C/EBP, are not significantly over-rep-resented in any of the promoters of the coexpressed genes. We generated a novel matrix for PPAR using 22 experimen-tally verified binding sites from the literature and analyzed the promoters of the coexpressed genes and all PromoSer promoters. Again, using this matrix the PPAR binding sites were not significantly over-represented.
Genomic position of coexpressed genes
Finally, we considered whether coexpressed genes also colo-calize on the chromosomes. In a broad genomic interval (5 megabases [Mb]) on each mouse chromosome we mapped the ESTs from each cluster. Unexpectedly, our data do not support the observation of the highly significant correlation in the expression and genomic positioning of the genes. A typ-ical example of mapped ESTs to chromosome 10 is illustrated in Figure 6, showing that expression levels of colocalized ESTs are divergent because only two mapped ESTs are mem-bers of the same cluster.
Additionally, we analyzed the genomic position of 5,205 ESTs that exhibited significant differentially expression between time points (P < 0.05; one-way ANOVA). These ESTs were grouped in 12 clusters, and we then searched for regions with three or more members in a genomic interval of 500 kilobases (kb). On average, 7 ± 5% of the ESTs from one cluster were colocalized. Comprehensive results of this analysis are acces-sible within the supplementary website [20] and Additional data files 42, 43, 44, 45.
[image:14.612.56.556.120.334.2]In summary, these data do not provide evidence that colocal-ized genes in the genomic sequence are subject to the same transcriptional regulation (coexpression), as indicated by examples for different processes in other studies [103].
Table 3
Significance of occurrence of predicted SREBP-1 binding sites in the promoters of co-expressed genes identified by clustering
SREBP-1 Putative target genes
Genes in cluster Against total PromoSer database Against total of all clusters
CS FE CS FE
Cluster 1 4 10 0.5000 0.7051 0.5339 0.7644
Cluster 2 11 27 0.5448 0.6892 0.6475 0.7812
Cluster 3 5 16 0.7076 0.8575 0.7697 0.8987
Cluster 4 9 12 0.0290 0.0289 0.0494 0.0484
Cluster 5 16 45 0.7787 0.8570 0.8568 0.9171
Cluster 6 10 20 0.1553 0.1554 0.2278 0.2277
Cluster 7 5 10 0.5000 0.5677 0.5000 0.6423
Cluster 8 31 66 0.2837 0.2827 0.4719 0.4711
Cluster 9 12 42 0.9025 0.9454 0.9414 0.9708
Cluster 10 22 41 0.1635 0.1635 0.2881 0.2877
Cluster 11 8 15 0.3230 0.3204 0.4057 0.4041
Cluster 12 25 45 0.0398 0.0404 0.1014 0.1014
PromoSer 5,456 12,493
Probabilities for over-representation (<0.05) of genes having a predicted SREBP-1 site relative to all unique regulated genes of PromoSer and to the total of all clusters. Cluster 4 is the only one with significantly increased occurrence of predicted SREBP-1 binding sites. CS, one-sided χ2 test; FE,
comm
en
t
re
v
ie
w
s
re
ports
refer
e
e
d
re
sear
ch
de
p
o
si
te
d r
e
se
a
rch
interacti
o
ns
inf
o
rmation
Discussion
The data presented here and the functional annotation con-siderably extend upon previous microarray analyses of gene expression in fat cells [8-14] and demonstrate the extent to which molecular processes can be revealed by global expres-sion profiling in mammalian cells. Our strategy resulted in a molecular atlas of fat cell development and provided the first global view of the underlying biomolecular networks. The
molecular atlas and the dissection of molecular processes suggest several important biological conclusions.
First, the data support the notion that there are hundreds of mouse genes involved in adipogenesis that were not previ-ously linked to this process. Out of the 780 selected genes, 326 were not shared with previous studies [8,9,12], suggest-ing that our view of this process is far from complete. Ussuggest-ing microarrays enriched with developmental ESTs, we were able Chromosomal localization analysis for ESTs found to be differentially expressed during fat cell differentiation
Figure 6
Chromosomal localization analysis for ESTs found to be differentially expressed during fat cell differentiation. Chromosomal localization analysis for chromosome 10 from 780 ESTs shown to be more than two times upregulated or downregulated in a minimum of four time points during adipocyte differentiation. (a) Mapped ESTs to chromosome 10. (b) ESTs from cluster 10 mapped to chromosome 10. (c) Relative gene expression levels (log2 ratios)
at different time points for seven ESTs mapped within a genomic interval of 5 Mb from chromosome 10. EST, expressed sequence tag.
NM_025995.1 NM_008252.2
NM_007659.2
NM_013508.1 NM_007725.1
AW536416.1
AW536905.1 XM_288324.1
NM_178606.2 XM_290068.1
AI848411.1 XM_125789.2
AW550700.1 NM_010512.2 NM_010798.1
NM_146007.1 NM_011605.1
NM_146006.1 AI848908.1
NM_015781.2 NM_007837.2
NM_009284.1 AW548319.11
NM_029364.1
NM_028230.2 NM_001003913.1 NM_010441.1
AW552829.2
79.42 Mb 75.73 Mb
NM_011595.1
NM_028230.2
NM_007725.1 AI837099.1
NM_007833.1 AI846778.1 AW538545.1 NM_011595.1
NM_007569.1 AI837099.1
NM_019553.1 NM_007494.2
AU020525.1 NM_009846.1
Chr Cluster Accession Name
1 10 8 NM_010798 Macrophage migration inhibitory factor 2 10 4 NM_146006 Lanosterol synthase
3 10 9 XM_290068 Collagen alpha 2 (VI) chain 4 10 9 NM_146007 Procollagen type Vi, alpha 2 5 10 2 XM_288324 Similar to olfactory receptor 6 10 10 AI837099 Phosphatidic acid phosphatase 2c 7 10 10 NM_007725 Calponin 2
Chromosome 10
Chromosome 10 Chromosome 10
2.5 3.0
2.0
1.5
1.0
0.5
0.0
-0.5
-1.0
-1.5
-2.0 -2.5
-3.0
75,000,000 76,500,000 78,000,000 79,500,000 81000000
Chromosomal localization
log2 r
atio
0h
6h
12h
24h
2d
3d
7d 14d 1
2 3,4
5
6 7