Elicitation of expert knowledge to inform
objectbased audio rendering to different
systems
Woodcock, JS, Davies, WJ, Melchior, F and Cox, TJ
10.17743/jaes.2018.0001
Title
Elicitation of expert knowledge to inform objectbased audio rendering to
different systems
Authors
Woodcock, JS, Davies, WJ, Melchior, F and Cox, TJ
Type
Article
URL
This version is available at: http://usir.salford.ac.uk/id/eprint/44895/
Published Date
2018
USIR is a digital collection of the research output of the University of Salford. Where copyright
permits, full text material held in the repository is made freely available online and can be read,
downloaded and copied for noncommercial private study or research purposes. Please check the
manuscript for any further copyright restrictions.
Elicitation of expert knowledge to inform object-based audio
rendering to different systems
James Woodcock1, William J. Davies1, Frank Melchior2, and Trevor J. Cox1
1Acoustics Research Centre, University of Salford, Salford, M5 4WT, United Kingdom 2BBC R&D, Dock House, MediaCityUK, Salford, M50 2LH, United Kingdom
January 4, 2018
Abstract
Object-based audio presents the opportunity to optimise audio reproduction for different listening scenarios. Vector base amplitude panning (VBAP) is typically used to render object-based scenes. Optimizing this process object-based on knowledge of the perception and practices of experts could result in significant improvements to the end user’s listening experience. An experiment was conducted to investigate how content creators perceive changes in the perceptual attributes of the same content rendered to systems with different numbers of channels, and to determine what they would do differently to standard VBAP and matrix based downmixes to minimize these changes. Text mining and clustering of the content creators’ responses revealed 6 general mix processes: the spatial spread of individual objects, EQ and processing, reverberation, position, bass, and level. Logistic regression models show the relationships between the mix processes, perceived changes in perceptual attributes, and the rendering method/speaker layout. The relative frequency of use for the different mix processes was found to differ between categories of audio object suggesting that any downmix rules should be object category specific. These results give insight into how object-based audio can be used to improve listener experience and provide the first template for doing this across different reproduction systems.
1
Introduction
whether the object is positioned on or off screen. This is in contrast to traditional channel based audio, where pre-rendered content for a fixed reproduction system is broadcast. One of the main benefits of OBA is that the content can be rendered optimally for the given reproduction setup, environment, or listening context. For example, the same audio content could be rendered over loudspeakers, mobile devices, or binaurally over headphones for a VR. However, there are many open questions regarding how to render OBA content optimally for different reproduction systems. Panning in object-based systems is generally done using vector base amplitude panning (VBAP) [9]. As object-based rendering algorithms have knowledge of the target reproduction setup, there is an opportunity to further optimise the reproduction via metadata adaptation. For example, the panning trajectories of objects in the scene could be modified depending on the limitations of the target loudspeaker layout. This could lead to a significant improvements in listener experience over traditional VBAP rendering, particularly to systems with few channels, such as two channel stereo, where VBAP configurations are not applicable. Optimization of object-based rendering could be based on objective soundfield parameters of the scene (e.g. aiming for an equal distribution of energy from all directions), perceptual parameters of the scene (e.g. by trying to maximise listener envelopment), or could aim to simulate what an expert would do when mixing object-based content for different speaker layouts (e.g. rules describing level adjustments for individual objects). This paper is concerned with the latter, and aims develop a framework to build expert knowledge into object-based rendering. The presented results provide the first evidence of what expert mixers would do when mixing object-based audio for different systems, and improves confidence that OBA can deliver on promises of format agnosticism and improved listener experience.
1.1 Intelligent systems in audio production
There have been a number of investigations into intelligent systems for audio production. These systems include automatic microphone mixing [10, 11], automatic panning algorithms [12], gain normalisation algorithms for feedback prevention [13], algorithms designed to reduce masking [14], automatic equalization [15], and automatic music mixing [16, 17]. Generally, these systems operate on low level signal and psychoacoustic features.
this paper therefore provide data that will be useful in bringing together object-based audio and intelligent systems in audio production.
1.2 Perception of spatial audio
There have been numerous studies that have aimed to elicit perceptual attributes for reproduced sound [20–29]. Generally, the outcome of these studies is a non-orthogonal set of attributes that can be used to rate perceptual differences between different reproduction conditions (loudspeaker layouts, rendering methods, etc). Generally, these attribute sets describe various timbral (such as clarity and colouration) and spatial (such as envelopment and horizontal width) perceptual attributes. An overview of these studies is given by Francombe et al. [30].
Recently, Francombe et al. [31, 32] conducted a study to determine which perceptual attributes contribute to the listener preference of reproduced audio. Their study included state of the art reproduction methods including systems with height such as 4+5+0 and 9+10+3 speaker layouts1.
An elicitation experiment was conducted with a group of expert and non-expert listeners which resulted in two sets of attributes (one for each of the listener groups) coving a range of timbral and spatial attributes. This attribute set is utilised in the present study (see section 2.3).
The studies above provide useful tools to assess the perception of reproduced sound. However, little is known about how perceptual attributes are degraded when the same object-based content is rendered to systems with different numbers of channels and how professional mix engineers would alter the downmix to compensate for these changes.
1.3 Conceptual model
Conceptually, the work presented in this paper assumes the following model of perception. It is assumed that when object-based audio is rendered to a different loudspeaker layout, changes in the physical sound field will cause a change in the auditory scene perceived by the listener. According to Coombs [34], differences between pairs of stimuli represent a distance in a latent high dimensional psychological space, which can be described by a finite number of perceptual dimensions. In the perception of complex sound stimuli, these dimensions are assumed to relate to some combination of perceptual attributes [35]. Therefore, if a sound designer is tasked to remix content to a different loudspeaker layout with the aim of preserving the intent of the original content, their judgements of similarity between the original and the re-rendered content will be based on differences in the positions of the stimuli in this perceptual space. When a change in these perceptual attributes is detected by the sound designer, they will make changes to the mix of the re-rendered content to attempt to compensate for the change in the perceptual attribute. It is this relationship between perceptual attributes and general mix processes that is of interest in this paper.
1
1.4 Aims and objectives
At present, there has been no systematic investigation of how professionals mix object-based content for different reproduction systems. This paper reports on an experiment that was conducted to investigate:
1. which perceptual attributes change when the same object-based content is rendered to systems with different numbers of channels, and;
2. what professional content creators would do differently to a standard VBAP renderer when content is rendered to systems with different numbers of channels.
The main objective of this exploratory study is to identify a small number of the most common mix processes used by professionals when remixing object-based content for systems with different numbers of channels. A second objective is to explore how the perceptual attributes of the rendered soundfield change between VBAP renderings of the same content to different speaker layouts. The identified mix processes can be used by designers of OBA systems and by researchers in OBA, intelligent audio systems and spatial audio generally. The processes will also inform future research, the aim of which will be to determine quantitative rules that can be used when rendering OBA for different loudspeaker layouts.
1.5 Structure of study
The work presented in this paper consists of 3 main phases. Firstly, experiments were conducted with professional audio content producers in which they were asked to compare a 9+10+5 channel rendering of an object-based audio drama scene to a rendering of the same content to a system with fewer channels. The content producers were asked what they would do differently if they had control over mix for the system with fewer channels and indicate what perceptual attributes changed between the reference and the lower channel render. As this is an exploratory study, aiming to elicit the common mix processes a content producer might employ when remixing object-based content for loudspeaker systems with different numbers of channels, the test participants were asked openly about their intentions rather than asking them to directly operate on the mix. A follow-up experiment will give the content producers direct control over a small number of the most commonly suggested processes to determine quantitative downmix rules for those processes.
2
Materials and methods
2.1 Ethics
The experiment described in this paper was approved by the University of Salford ethics committee. Participants took part in the experiments voluntarily, and written consent was taken prior to the test session. Participants were free to withdraw from the experiment at any time, without needing to give a reason to the researcher.
2.2 Stimuli
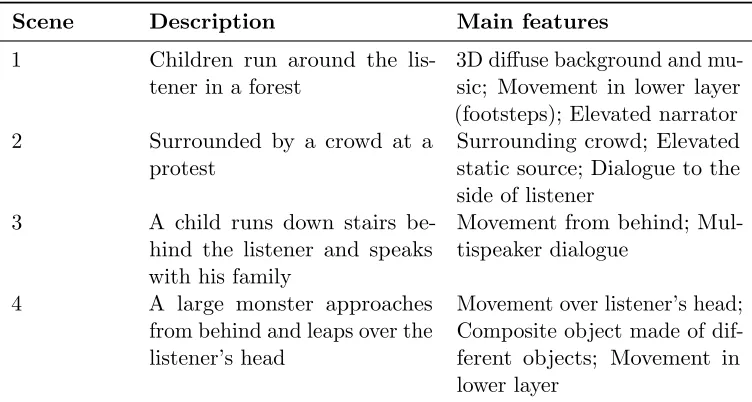
Stimuli for the experiment were generated using professionally produced object-based audio drama content, produced as part of the S3A project [36]. The clips were originally mixed for a 9+10+5 channel setup (9+10+3 as specified in Recommendation ITU-R BS.2051 [33] with 2 additional speakers in the lower layer at±135o); subwoofer signals in the listening room during the mix were generated by an IOSONO Core bass management system. Four clips, each with a duration of around 20 seconds, were selected from this material to be used in the test. The clips were selected to demonstrate a wide range of features of advanced 3D audio systems and to include a range of different object types [37, 38]. Descriptions of the four clips are provided in Table 1.
Scene Description Main features
1 Children run around the lis-tener in a forest
3D diffuse background and mu-sic; Movement in lower layer (footsteps); Elevated narrator 2 Surrounded by a crowd at a
protest
Surrounding crowd; Elevated static source; Dialogue to the side of listener
3 A child runs down stairs be-hind the listener and speaks with his family
Movement from behind; Mul-tispeaker dialogue
4 A large monster approaches from behind and leaps over the listener’s head
[image:6.612.118.494.368.569.2]Movement over listener’s head; Composite object made of dif-ferent objects; Movement in lower layer
Table 1: Description of stimuli used in the listening experiment. The scenes are available from
http://dx.doi.org/10.17866/rd.salford.3120112.
layout, a virtual speaker was positioned at 180◦ in the 0+2+0 layout. As with the original mix, subwoofer signals for the 4+9+0 and 0+5+0 systems were generated using the IOSONO Core bass management system in the listening room.
The VBAP renderings were generated using the algorithms described by Pulkki [9] implemented in a realtime C++ software rendering framework developed in the S3A project. The software takes as an input a loudspeaker configuration, the audio signals for each object, and the metadata for each object via a UDP JSON stream and outputs signals for the given loudspeaker configuration. The loudspeaker configuration is meshed into a set of triplets and a gain matrix for each triplet is inverted and multiplied by the object positions described in the metadata to calculate panning gains for each object in the scene. The calculated gains are applied to the each object’s audio signal to generate the output loudspeaker signals. The metadata model and the software rendering framework are described in more detail in [39].
Alongside VBAP, matrix downmixes from an object-based 9+10+3 render to 0+5+0 and 0+2+0 were also included to understand how the object-based renderings perform compared to standardized matrix downmix methods. The coefficients for the matrix downmixes were taken from [40]. All of the clips used in the experiment were loudness normalised using a multichannel extension to ITU-R 1770-2 [41].
2.3 Listening experiment
Eight professional content producers took part in the listening experiment. Each of the participants identified that audio production was their full time profession. The participants’ professional experience ranged from theatre sound designer, studio manager, sound supervisor, sound editor, sound designer, sound mixer, composer, and sonic artist. The participants had experience mixing for surround systems ranging from 5.1 mixes for sport, entertainment, and theatricals to multichannel museum installations. The average age of participants was 43.5 (SD = 9.1) and they were paid an honorarium for their time.
The experiment was conduced in the listening room at BBC R&D. This listening room complies with ITU BS.1116 [42] and is equipped with 32 Genelec 8030B loudspeakers and 2 Genelec 7040 subwoofers. Further details of this listening room are given in [43].
Participants were presented with the stimuli described in Section 2.2 in pairs, the reference stimulus and a version of the same content rendered for a speaker system with a lower number of channels.
For each comparison the participant was asked:
1. what they would have done differently if they had control of the version with the lower number of loudspeakers if they were mixing the clip with the aim of preserving the intent of the reference clip, and;
The order of the stimuli and attribute list was randomized for each participant and participants were not informed about the layout of the target reproduction systems. Participants were able to switch freely between the reference stimulus and the downmix stimulus.
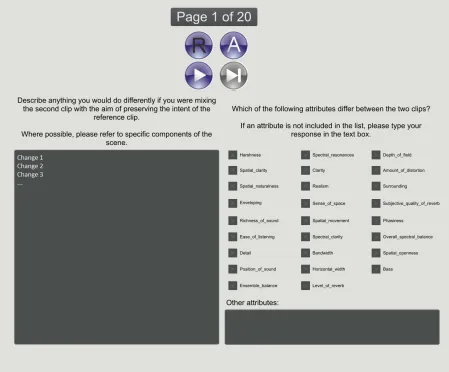
The interface for the test is shown in Figure 1. Responses to 1. were collected using open text data; the participants were asked to type each change they would make on a new line of the text box. Responses to 2. were collected using check boxes; the attributes on the right hand side of the figure are harshness, spatial clarity, spatial naturalness, enveloping, richness of sound, ease of listening, detail, position of sound, ensemble balance, spectral resonances, clarity, realism, sense of space, spatial movement, spectral clarity, bandwidth, horizontal width, level of reverb, depth of field, amount
of distortion, surrounding, subjective quality of reverb, phasiness, overall spectral balance, spatial
openness,and bass. The list of attributes was taken from the findings of an elicitation experiment by Francombe et al. [31, 32]. The definitions of the attributes given in [31] were provided to the participants. Participants were also allowed to add any other attributes they perceived as having changed in an open textbox; however, none of the participants used this option suggesting that the attributes in [31] covered all of the perceptual differences in the test stimuli.
2.4 Statistical methods
2.4.1 Cluster analysis
Two methods of cluster analysis are used in this study, k-means and hierarchical agglomerative clustering. The aim of both of these methods is to divide a set of data into interpretable groups.
K-means clustering is a flat clustering algorithm that aims to minimize the average squared Euclidean distance of objects from the centroid of the object’s cluster [44]. In k-means clustering, the number of clusters k returned by the algorithm is specified in advance.
Hierarchical agglomerative clustering is a method of clustering whereby all of the objects begin as individual clusters. In an iterative process, the two closest clusters are merged. The final top level of the hierarchy consists of a single cluster containing all objects. Using this method, the number of clusters does not need to be specified in advance; different numbers of clusters can be obtained by slicing the hierarchical solution at different levels [45].
2.4.2 Regression modelling
Categorical response variables with more than 2 categories can be modelled using multinomial logistic regression [46]. In the present study, the changes suggested by the sound designers for each reproduction system (see Section 3.1.1) can be represented in this way. Consider a multinomial categorical response variable Yi that can take one of J values. The probabilityπi,j that the i-th
response falls into the j-th category can be denoted as such:
πi,j =P(Yi=j) (1)
Figure 1: Test interface used in the listening tests.
the log-odds for all the other categories relative to this baseline are modelled. The odds that the
i-th response falls into categoryj as opposed to the baseline is πi,j/πi,Baseline.
The multinomial logistic model assumes that the log-odds of each response category over the baseline follows a linear model:
ln(πi,j/πi,Baseline) =αj+xTi βj (2)
where αj is the model intercept for the j-th category, βj is a vector of regression coefficients, xi
is a vector of observations, and T indicates a matrix transpose. αj and βj can be estimated via
maximum likelihood.
Considering equation 2, as the the log-odds are being modelled, taking the exponential of the βj
regression coefficients directly leads to an odds-ratio against the baseline category for a unit increase in the corresponding independent variable. For example, if aβj coefficient of 0.70 were found for a
in thej-th category over the baseline category being twice as high when the predictor variable takes on a value of 1 (ase0.70≈2).
Binary logistic regression, which is used in Section 3.4.2, can be considered as a special case of multinomial logistic regression when the number of response categories J = 2.
3
Analysis and results
3.1 Open text data
3.1.1 Text mining
The open text data collected using the methods described in Section 2.3 were initially analysed using unsupervised text mining techniques. The aim of this exercise was to begin to look for general categories of changes that the sound designers indicated they would make to the content rendered to systems with a lower number of loudspeakers than the reference system. Text mining allows the investigation of latent structures in a collection of documents (in this case a document refers to a single phrase2 elicited in the experiment) [47]. Text mining has an advantage over simply examining word frequencies, as it can reveal clusters of phrases that relate to similar concepts; for example, in the present study the word “position” is used frequently in phrases relating to both static and dynamic positions of objects.
The text data were cleaned by converting every letter to lower case and by removing numerical and punctuation characters. Following this, a list of stopwords was constructed. Stopwords are words that are disregarded in the text mining process, because they offer little predictive power; this may be because they are common words within the language (e.g. a, the, and) or because they are common within the domain that is being investigated (in the present study, this included words such asspeaker, stereo, downmix).
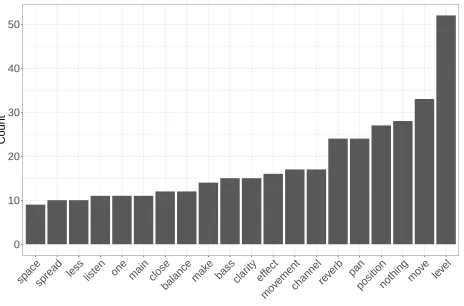
A list of common English words from the SMART information retrieval project [48] was used as a base for the stopword list. This list was manually examined to ensure any words that had potential predictive power were retained. Following this, any word that only occurred once in the corpus was considered a stopword [47]. As the main aim of the exercise was to investigate mix processes, the resulting dictionary was manually examined to remove hedonic phrases (e.g. good, better, excellent) and modifiers (e.g. little, increase, decrease). The decision was made to include all audio objects identified in the phrases as stopwords to prevent the algorithm from creating clusters of objects. A list of the stopwords used is included as an appendix to this paper. Figure 2 shows the 20 most frequently used words within the corpus after removal of stopwords.
The text data were quantitatively represented by generating a phrase-term matrix, whereby each phrase is represented as a feature vector representing which terms in the dictionary exist in that phrase (in this context, a dictionary is a list of all words that appear in the corpus). K-means clustering (see Section 2.4.1) was used to analyse the phrase-term matrix. As the number of clusters
2
0 10 20 30 40 50
spacespread less listen one main closebalancemak e
bass clarityeffect mo
vementchannelreverb panpositionnothingmo ve
level
[image:11.612.78.542.71.377.2]Count
Figure 2: Frequency of use of words within the corpus after stemming and removal of stopwords.
k is a variable that needs to be determined, a scree plot was generated to examine the within cluster sum of squares as a function of k. The scree plot showed no obvious elbow, but a shallowing of the gradient of the curve suggested a 20 cluster solution was an appropriate staring point. Examination of the 20 cluster solution revealed that the largest returned cluster contained a number of clear sub-clusters. Therefore, the k-means algorithm was run a second time on this top level cluster to obtain an additional 10 cluster solution making the total number of clusters 29.
Each of the clusters returned by the algorithm was automatically labelled by calculating a metric comparing mean word use for the phrases within a cluster (win) to the mean word use for the
phrases not in that cluster (wout). The metric was calculated as follows:
win =
Nw
Nc
forw∈c (3)
wout=
Nw
N −Nc
forw /∈c (4)
wdif f =wout−win (5)
the number of words in the corpus. The cluster was then automatically labelled by rank ordering wdif f and taking the top term.
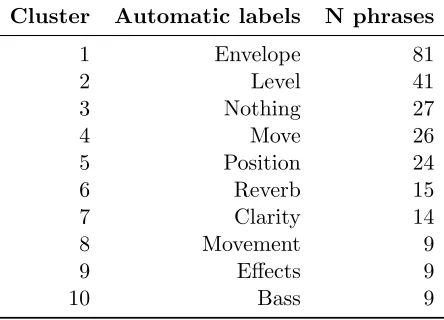
Table 2 shows the automatic labels for the first 10 phrase clusters revealed in the text mining analysis. This table also shows the number of phrases in each cluster. It can be seen that generally the automatic label describes a mix process or perceptual attribute, except the cluster labelled
Nothing which consists of the responses where the participants indicated they would make no
[image:12.612.195.417.250.410.2]changes. From Table 2 it is apparent that a number of the clusters could be describing the same concept (for example, the clusters labelledmove andposition). To explore this, one-to-one follow up interviews were conducted with the test participants.
Table 2: Automatic labels for the first 10 clusters revealed in the text mining analysis.
Cluster Automatic labels N phrases
1 Envelope 81
2 Level 41
3 Nothing 27
4 Move 26
5 Position 24
6 Reverb 15
7 Clarity 14
8 Movement 9
9 Effects 9
10 Bass 9
3.1.2 Follow-up interviews
The automatic labels for the clusters revealed in the text mining analysis were used in follow-up interviews with the listening test participants. In these discussions the participants were presented with the phrases in each cluster describing the suggested changes, along with the automatic key words shown in Table 2. For each cluster, they were asked to consider the following:
1. Does the cluster describe a unique category of mix process?
2. If not, can the cluster be merged with another of the clusters?
3. Do all of the phrases belong in that cluster, or do they need to be reallocated to a different cluster?
This process was conducted iteratively, until all of the phrases in the corpus were allocated to a category.
1. Spread: A change in the spread or width of individual objects.
2. EQ and processing: Changes to frequency content and effects such as distortion.
3. Reverb: Changes to the level or time of reverb applied to individual objects.
4. Position: A change in the position or movement of individual objects.
5. Bass: A change to the level of the LFE channel.
6. Level: Changes to the level of individual objects.
7. No change: No suggested change.
The full clustering solution can be found at http://dx.doi.org/10.17866/rd.salford.3120112.
3.2 General mix processes
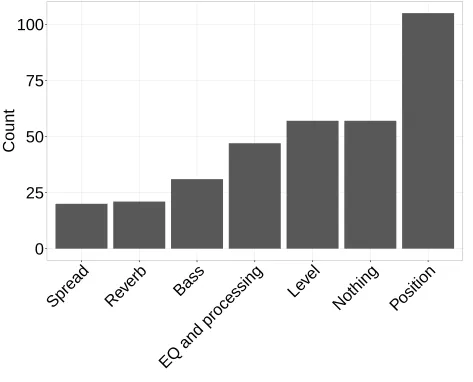
Based on the clustering solution, each of the phrases in the corpus was coded according to one of the 7 categories identified in Section 3.1.2. Figure 3 shows the frequency of the general mix processes across all systems and programme items. It can be seen from this figure that the most frequently suggested mix process was a change in position followed by no change, level, EQ and processing, bass, reverb, and spread.
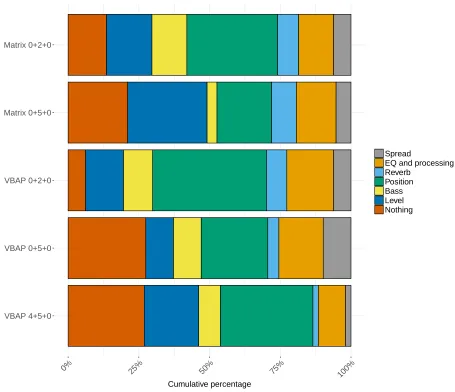
[image:13.612.197.417.551.641.2]Table 3 shows the total number of suggested changes over all participants and programme items. It can be seen from the table that the greatest number of suggested changes were for the VBAP and matrix 0+2+0 systems (91 and 70 changes respectively). The distribution of these data are shown in Figure 4, which shows the cumulative frequency of process use broken down by target reproduction system. Changes in position are the most commonly suggested mix process for the VBAP 4+5+0, VBAP 0+5+0 system, VBAP 0+2+0, and matrix 0+2+0 systems. Changes in level were the most commonly suggested mix process for the matrix 0+5+0 system.
Table 3: Total number of suggested changes over all participants and programme items, broken down by system.
System Total suggested changes
VBAP 4+5+0 38
VBAP 0+5+0 36
Matrix 0+5+0 45
VBAP 0+2+0 91
Matrix 0+2+0 70
0
25
50
75
100
Spread
Re
verb
Bass
EQ and processing
Le
vel
Nothing
Position
[image:14.612.74.547.183.565.2]Count
VBAP 4+5+0 VBAP 0+5+0 VBAP 0+2+0 Matrix 0+5+0 Matrix 0+2+0
0% 25% 50% 75%
100% Cumulative percentage
Spread
EQ and processing Reverb
[image:15.612.80.535.187.579.2]Position Bass Level Nothing
Action and movement Continuous background Transient background Clear speech Non diegetic music Prescence of people Prominent transients No specific object mentioned
0% 25% 50% 75%
100%
Cumulative percentage
Spread
EQ and processing Reverb
[image:16.612.92.538.73.385.2]Position Bass Level
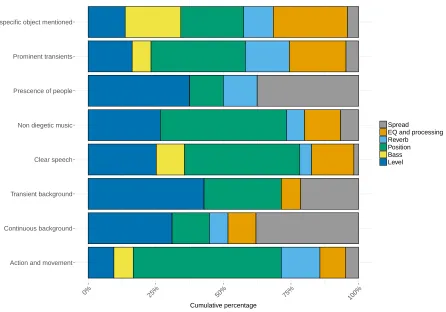
Figure 5: Cumulative percentage of process use, broken down by object type.
commonly suggested process was a change in position. For transient background sounds and sounds that indicate the presence of people, the most commonly suggested process was level. When no specific object was mentioned (i.e. processes on the overall scene), the most commonly suggested process was EQ and processing. For continuous background sounds and sounds indicating the presence of people, changes in the spread of the object were also commonly suggested.
3.3 Attributes
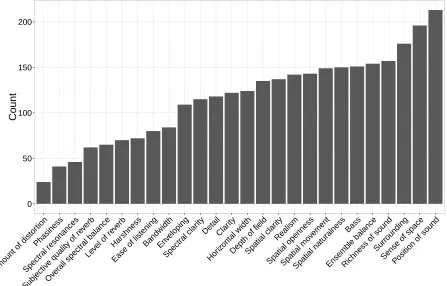
In the listening experiment described in Section 2.3, the participants were asked to indicate which perceptual attributes from a list had changed between the reference clip and the re-rendered or downmixed clip. Figure 6 shows the frequency of attribute use across all systems and programme items. It can be seen from this figure that the top three most frequently selected attributes relate to spatial aspects; this gives support to the finding in Section 3.1.1 that the most commonly suggested change was positional. The open text box to enter other attributes was not used by any of the participants.
0 50 100 150 200
Amount of distor tion
Phasiness
Spectr
al resonances
Subjectiv
e quality of re verb
Over all spectr
al balance Level of re
verb
Harshness
Ease of listening BandwidthEnveloping
Spectr al clar
ity DetailClar
ity
Hor
izontal widthDepth of fieldSpatial clar ity
Realism
Spatial opennessSpatial mo vement
Spatial natur alnessBass
Ensemb le balance
Richness of sound Surrounding
Sense of spacePosition of sound
[image:17.612.89.536.233.519.2]Count
Harshness
Level_of_reverb
Phasiness
Subjective_quality_of_reverb
Amount_of_distortion
Spectral_resonances
Bandwidth
Overall_spectral_balance
Ease_of_listening
Richness_of_sound
Bass
Realism
Spectral_clarity
Clarity
Detail
Position_of_sound
Sense_of_space
Surrounding
Spatial_openness
Spatial_naturalness
Spatial_clarity
Horizontal_width
Spatial_movement
Ensemble_balance
Enveloping
[image:18.612.98.501.108.667.2]Depth_of_field
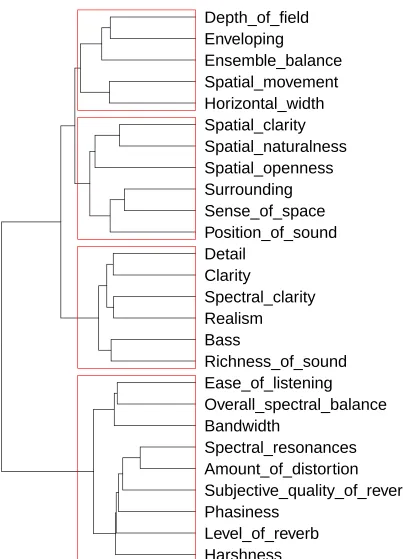
dendrogram showing the results of this analysis is shown in Figure 7. From top to bottom, the first two clusters appear to relate to spatial attributes, the third cluster appears to relate to clarity and realism, and the fourth cluster appears to relate to artefacts. These categories of perceptual attributes will be used in the regression model described in the following section.
3.4 Regression models
3.4.1 Relationship between perceptual attributes and mix processes
This section describes the development of a regression model to explore the relationship between the changes to perceptual attributes identified by the test participants and the changes to the mix that they suggested.
Initially, each of the perceptual attributes were included separately and individually as indepen-dent variables in a multinomial logistic regression model with the mix processes iindepen-dentified in Section 3.1.1 (Process) as a dependent variable with a baseline ofNo change (i.e. the model expresses the log-odds of a given mix process being suggested compared to no changes being suggested). The choice of independent and dependent variables was based on the to the conceptual model detailed in Section 1.3, which posits that changes in attributes detected by the mix engineers cause a suggestion of a mix process. The purpose of this was to identify any attributes that were not significant predictors of the changes proposed by the sound designers. The significance of each model was assessed via a likelihood ratio test against the null model. Any attribute that resulted in a likelihood ratio test with a p-value greater than 0.05 (i.e. no significant improvement in model fit over the null model) was discounted from further analysis. Of the attributes investigated,horizontal width, spectral balance, spatial openness, bandwidth, phasiness, reverb level, and spectral resonances were found not to be significant predictors ofProcess.
The remaining variables were added blockwise to a multinominal logistic regression model. A model containing only a variable identifying which clip was being assessed was specified as a baseline model to control for the effect of the different types of programme material used in the listening experiment. The variable blocks were specified according to the results of the hierarchical cluster analysis of attribute ratings described in Section 3.3. The variable blocks were added to the model in the following order: 1) Clip (baseline model), 2) Spatial attributes a, 3) Spatial attributes b, 4) Clarity attributes, and 5) Artefact attributes.
The change in overall χ2 of the model fit was used to test the utility of each successive block of
variables. The results of the multinomial logistic regression are summarised in Table 4. The table shows a clear improvement in the fit of the model as successive blocks of variables are entered into the model. The first two columns show the overall χ2 of the model and the change inχ2 (∆χ2)
over the previous model. For each block, the change in χ2 over the previous model represents a significant improvement in the model fit (p <0.05).
model. As such pseudo R2 cannot be interpreted as a proportion of variance accounted for as in ordinary linear regression; according to [50], values between 0.2 - 0.4 represent an “excellent fit”.
Table 4: Summary of the results of the multinomial logistic regression.
Block χ2 ∆χ2 p R2 ∆R2
Baseline 30.4 – 0.03 0.03 – Spatial 1 102.25 71.85 <0.0001 0.08 0.05 Spatial 2 157.85 55.6 <0.0001 0.13 0.05 Timbral 214.19 56.34 <0.0001 0.18 0.05 Artefacts 269.49 55.3 <0.0001 0.22 0.04
The results of the full model are given in Table 6 of Appendix II.
3.4.2 Relationship between rendering system and perceptual attributes
To investigate the effect of the different system types on changes to perceptual attributes, binomial logistic regression models were calculated for each of the attributes with system type as the independent variable. The models are shown in Table 5. These models are all against a baseline of the VBAP 4+5+0 render3, therefore the models describe the log-odds of a change of attribute being detected over the highest channel system in the test that was not the reference system. It can be seen that the only significant results at thep <0.05 level for the 0+5+0 systems was forenvelopment
in the VBAP rendering, suggesting the two 0+5+0 rendering methods performed similarly to the baseline VBAP 4+5+0 system; this result is in line with recent findings from Francombeet al. [32] where little difference was found between preference ratings of 5- channel and 9- channel systems. The two 0+2+0 systems result in significant changes in the the majority of the tested attributes.
Table 5: Results of multinomial regression model for Process by attributes.
Dependent variable vs VBAP 4+5+0
VBAP 0+5+0 Matrix 0+5+0 VBAP 0+2+0 Matrix 0+2+0
Envelopment 2.1462** 3.573*** 2.9957***
Depth 1.6704*** 1.1727**
Ensemble balance 1.1227** 1.1856**
Spatial movement 1.6144*** 0.9345*
Spatial clarity 1.3683*** 1.5247***
Spatial naturalness 2.0562*** 2.1289***
Surrounding 1.01881** 1.0033**
3Due to the paired comparison method used, participants were not able to suggest changes to the reference system,
[image:20.612.77.536.519.695.2]Sense of space 1.44036*** 1.26929***
Position 1.4404*** 1.6358***
Detail 0.8633* 1.6084***
Spectral clarity 0.9708* 1.3319** 1.1618**
Clarity 1.08059**
Realism 1.76359*** 0.88504*
Bass -0.9884* 1.3077*** 1.0301**
Richness 1.0759** 1.501***
Ease of listening 1.088* 1.381**
Distortion 1.3809*
Quality of reverb 1.8438***
Harshness 1.64*** 1.39879**
∗p<0.05;∗∗p<0.01;∗∗∗p<0.001
4
Discussion
The primary aim of the work presented in this paper was to determine a small number of common mix processes that professional content producers would employ when downmixing object-based content to different speaker layouts. Text mining of the open response data collected in the listening tests described in Section 2.3, combined with follow up interviews and cluster analysis, identified six general categories of mix processes. The results suggest that changes in level and position are the most commonly suggested mix processes. These results provide a framework of common processes that could be built into an object-based renderer. The next steps in this work will focus on determining quantitative rules that describe how professional mix engineers would vary these processes for different categories of audio object.
The results presented in Figure 5 suggest that these general processes apply differently to different categories of audio object. These findings provide evidence that any downmix operations included in an object-based audio renderer should consider the category of object to which the process is being applied. The most commonly suggested changes across all categories of objects were changes in level and position. The mix process spread was suggested more commonly for continuous and transient background objects and sounds indicating the presence of people than other object categories. Operations of the position of individual objects were commonly suggested for objects that indicate actions and movement compared to the other identified mix processes. The process
Figure 8 provides a summary of the regression models derived in Sections 3.4.1 and 3.4.2; lines are drawn where significant relationships were found (p <0.05) and the thickness of each line is proportional to the effect size. In this case the odds ratio has been taken as an indication of the effect size. Chen et al. [51] provide an empirical relationship between odd-ratios and Cohen’s d. These relationships have been used to indicate the effect size in the Figure 8; red arrows indicate a large effect size (d >0.8), yellow is a medium effect size (0.4 6d<0.8), green is a small effect size (0.2 6d <0.4), and grey is a very small effect size (d60.2).
The largest effect size for the relationships between the reproduction systems and the perceptual attributes is for theenvelopment attribute, with odds ratios of 35.6 and 19.9 for the VBAP and Matrix 0+2+0 systems respectively. This means that if the same content is rendered to 0+2+0 using VBAP, a change in envelopment is 35.6 more likely than if the content were rendered to a 5+4+0 system. Smaller effect sizes can be seen between the 0+2+0 systems and the majority of the other attributes.
Overall, the largest effect sizes were with the attribute harshness followed by envelopment
andensemble balance. Recent research has shown that envelopment is one of the most important
attributes in determining preference between spatial audio systems [32]. This is supported by other studies which have found that spatial attributes contribute to overall listener preference [26, 27, 52]. This suggests that OBA systems could deliver improvements to listener experience if they employed optimised rendering rules for spatial attributes such as envelopment; recent research has shown that it is possible to adapt object-based mixes to result in different levels of envelopment [53]. Relationships with large and medium effect sizes can be observed betweenenvelopment and all of the processes apart fromspread. This suggests that the test participants were able to suggest changes to ameliorate the degradation of envelopment. Other attributes exhibiting large and medium effect sizes includeensemble balance,spatial movement,spatial naturalness, clarity, bass, richness,and
harshness.
5
Conclusion
This paper has presented the results of an experiment designed to identify a small number of the most common mix processes used by sound designers when mixing object-based content to loudspeaker systems with different numbers of channels. Six general mix processes were identified from open text data gathered in the listening experiment. These processes were related to the spatial spread of individual objects, EQ and processing, reverb, position, bass, and level. Over all programme items and systems tested, the most commonly suggested process was a change in the position of individual objects.
Envelopment
Depth
Ensemble balance
Spatial movement
Spatial clarity
Spatial naturalness
Surrounding
Sense of space
Position
Detail
Spectral clarity
Clarity
Realism
Bass
Richness
Ease of listening
Distortion
Quality of reverb
Harshness
Object 5.1
Object 2.0
Matrix 5.1
Matrix 2.0
Spread
Processing
Reverb
Position
Bass
Level
[image:23.612.77.530.142.587.2]System
Attribute
Mix process
was between the VBAP 0+2+0 system and envelopment. Significant relationships were also found between changes in perceptual attributes and the suggested mix processes. The largest effect sizes were with the attribute harshness followed byenvelopment and ensemble balance. Although it was ensured that the programme material used in the test covered a wide range of audio object types, it should be noted that the study was limited to audio drama programme material; other processes and relationships may be found for different types of programme material.
Taken together, these results show that when professional content producers detect changes in perceptual attributes when rendering the same content to systems with different numbers of channels, they are able to suggest changes to the mix which can be categorised into a small number of common processes. The relative frequency that the content creators suggested different mix processes was found to differ between categories of audio objects; this finding suggests any downmix operations included in an object-based audio renderer should consider the category of object to which the process is being applied. In the study, test participants were asked about their intentions rather than asking them to directly operate on the mix. The next step of this work will be to allow content producers to directly manipulate the identified mix processes in a method of adjustment task in order to determine quantitative rules that could be built into an intelligent object-based renderer.
6
Acknowledgements
This work was supported by the EPSRC Programme Grant S3A: Future Spatial Audio for an Immersive Listener Experience at Home (EP/L000539/1) and the BBC as part of the BBC Audio Research Partnership. The authors would like to thank Chris Pike from BBC R&D for his help generating the the material for the tests and Jon Francombe from the University of Surrey for his input and comments on the design of the experiment. Finally, the authors would like to thank the participants of the experiment for their time.
The experimental data underlying the findings are fully available without restriction, details are available fromhttp://dx.doi.org/10.17866/rd.salford.3120112.
References
[1] SA Silva. M Armstrong, M Brooks, A Churnside, F Melchior, and M Shotton. “Object-based broadcasting - Curation, responsiveness and user experience” InInternational Broadcasting
Convention, IBC2014. IBC, 2014.
[2] S3A - Future spatial audio for an immersive listener experience. http://www.
s3a-spatialaudio.org/wordpress/. Accessed: 2017-08-06.
[4] 2-Immerse. https://2immerse.eu/. Accessed: 2017-08-06.
[5] J Herre, J Hilpert, A Kuntz, and J Plogsties. “MPEG-H 3D audio–The new standard for coding of immersive spatial audio,” IEEE J. Sel. Topics Signal Process., vol. 9 no. 5 pp. 770–779 (May 2015), https://dx.doi.org/10.1109/jstsp.2015.2411578.
[6] S F¨ug, D Marston, and S Norcross. “The audio definition model—a flexible standardized representation for next generation audio content in broadcasting and beyond,” presented at
141th Convention of the Audio Engineering Society(Sep 2016), convention paper 9626.
[7] S Mehta, T Onders, and J Riedmiller. “Recipes for creating and delivering next-generation broadcast audio.” SMPTE Motion Imaging Journal, vol. 125 no. 9 pp. 25–32 (Nov-Dec 2015), https://dx.doi.org/10.5594/JMI.2016.2619304.
[8] JM Jot, B Smith, and J Thompson. “Dialog control and enhancement in object-based audio systems,” presented at139th Convention of the Audio Engineering Society(Oct 2015), convention paper 9356.
[9] V Pulkki. “Virtual sound source positioning using vector base amplitude panning,” J. Audio Eng. Soc., vol. 45 no. 6 pp. 456–466 (Jun 1997).
[10] D Dugan. “Automatic microphone mixing,” J. Audio Eng. Soc., vol. 23 no. 6 pp. 442–449 (Aug 1975).
[11] MJ Terrell and JD Reiss. “Automatic monitor mixing for live musical performance,” J. Audio Eng. Soc., vol. 57 no. 11 pp. 927–936 (Nov 2009).
[12] E Perez-Gonzalez and JD Reiss. “Automatic mixing: Live downmixing stereo panner,” In
Proc. 10th Int. Conf. Digital Audio Effects (DAFx-07), Bordeaux, France (Sep 2007).
[13] JD Reiss and E Perez-Gonzalez. “An automatic maximum gain normalization technique with applications to audio mixing,” presented at124th Convention of the Audio Engineering Society
(May 2008), convention paper 7411.
[14] E Perez-Gonzalez and JD Reiss. “Improved control for selective minimization of masking using inter-channel dependancy effects,” InProc. 11th Int. Conf. Digital Audio Effects (DAFx-08), Espoo, Finland (Sep 2008).
[15] S Hafezi and JD Reiss. “Autonomous multitrack equalization based on masking reduction,” J. Audio Eng. Soc., vol. 63 no. 5 pp. 312–323 (May 2015).
[17] S Mansbridge, S Finn, and JD Reiss. “Implementation and evaluation of autonomous multi-track fader control,” presented at132nd Convention of the Audio Engineering Society (Apr 2012), convention paper 8588.
[18] G Ren, G Bocko, J Lundberg, D Headlam, and MF Bocko. “Automatic music production system employing probabilistic expert systems,” presented at129th Convention of the Audio Engineering Society(Nov 2010), convention paper 8255.
[19] P Pestana and JD Reiss. “Intelligent audio production strategies informed by best practices,” presented at theAES 53rd International Conference: Semantic Audio (Jan 2014), conference paper S2-2.
[20] T Letowski. “Sound quality assessment: concepts and criteria,” presented at87th Convention of the Audio Engineering Society (Oct 1989), convention paper 2825.
[21] F Rumsey, S Zieli´nski, R Kassier, and S Bech. “On the relative importance of spatial and timbral fidelities in judgments of degraded multichannel audio quality,” J. of the Acoust. Soc. of Am., vol. 118 no. 2 pp. 968–976 (Aug 2005) https://dx.doi.org/10.1121/1.1945368.
[22] N Zacharov and K Koivuniemi. “Unravelling the perception of spatial sound reproduction: Anal-ysis & external preference mapping,” presented at111th Convention of the Audio Engineering Society(Nov 2001), convention paper 5423.
[23] N Zacharov and K Koivuniemi. “Unravelling the perception of spatial sound reproduction: Language development, verbal protocol analysis and listener training,” presented at 111th Convention of the Audio Engineering Society(Nov 2001), convention paper 5424.
[24] N Zacharov and K Koivuniemi. “Unravelling the perception of spatial sound reproduction: Techniques and experimental design,” presented at the AES 19th International Conference:
Surround Sound-Techniques, Technology, and Perception(Jun 2001), conference paper 1929.
[25] C Guastavino and BFG Katz. “Perceptual evaluation of multi-dimensional spatial audio reproduction,” J. of the Acoust. Soc. of Am., vol. 116 no. 2 pp. 1105–1115 (Aug 2004) https://dx.doi.org/10.1121/1.1763973.
[26] S Choisel and F Wickelmaier. “Extraction of auditory features and elicitation of attributes for the assessment of multichannel reproduced sound,” J. Audio Eng. Soc., vol. 54 no. 9 pp. 815–826 (Sep 2006).
[27] S Choisel and F Wickelmaier. “Evaluation of multichannel reproduced sound: Scaling auditory attributes underlying listener preference,” J. of the Acoust. Soc. of Am., vol. 121 no. 1 pp. 388–400 (Jan 2007) https://dx.doi.org/10.1121/1.2385043.
[29] N Zacharov, T Pedersen and C Pike. “A common lexicon for spatial sound quality assessment -latest developments,” InProc. 8th Int. Conf. on Quality of Multimedia Experience (QoMEX),
Lisbon, Portugal (Jun 2016) https://dx.doi.org/10.1109/QoMEX.2016.7498967.
[30] J Francombe, T Brookes, and R Mason. Perceptual evaluation of spatial audio: Where next? InProc. 22nd Int. Congress on Sound and Vibration (ICSV) Florence, Italy (Jul 2015).
[31] J Francombe, T Brookes, and R Mason. “Evaluation of spatial audio reproduction methods (Part 1): Elicitation of perceptual differences,” J. Audio Eng. Soc., vol. 65 no. 3 pp. 198–211 (Mar 2017).
[32] J Francombe, T Brookes, R Mason, and J Woodcock. “Evaluation of spatial audio reproduction methods (Part 2): analysis of listener preference,”J. Audio Eng. Soc., vol. 65 no. 3 pp. 212–225, (Mar 2017).
[33] ITU-R. “Recommendation BS.2051, Advanced sound system for programme production,” International Telecommunications Union (ITU), (2017).
[34] CH Coombs. A theory of data. Wiley, (1964).
[35] J Blauert and U Jekosch. “A layer model of sound quality,” J. Audio Eng. Soc., vol. 60 no. 1/2 pp. 4–12, (Jan 2012).
[36] J Woodcock, C Pike, F Melchior, P Coleman, A. Franck, and A. Hilton. “Presenting the S3A object-based audio drama dataset,” presented at140th Convention of the Audio Engineering Society(Jun 2016), eBrief 255.
[37] J Woodcock, WJ Davies, TJ Cox, and F Melchior. “Categorization of broadcast audio objects in complex auditory scenes,” J. Audio Eng. Soc., vol. 64 no. 6 pp. 380–394 (Jun 2016).
[38] J Woodcock, WJ Davies, and TJ Cox. “A cognitive framework for the categorisation of auditory objects in urban soundscapes,” Appl. Acoust., vol. 121 pp. 56–64 (Jun 2017) https://dx.doi.org/10.1016/j.apacoust.2017.01.027.
[39] P Coleman, A Franck, J Francombe, Q Liu, T Campos, RJ Hughes, D Menzies, MFS G´alvez, Y Tang, J Woodcock, PJB Jackson, F Melchior, C Pike, FM Fazi, TJ Cox, and A Hilton. “An audio-visual system for object-based audio: From recording to listening,” IEEE Tran. Mult., (In Press, 2018).
[40] T Komori, S Oode, K Ono, K Irie, Y Sasaki, T Hasegawa, and I Sawaya. “Subjective loudness of 22.2 multichannel programs,” presented at 138th Convention of the Audio Engineering Society(May 2015), convention paper 9219 255.
[42] ITU-R. “Recommendation BS.1116, Methods for the subjective assessment of small impairments in audio systems including multichannel sound systems,” International Telecommunications Union, (1997).
[43] T Nixon, A Bonny, and F Melchior. “A reference listening room for 3D audio research,” In
Proc. 3rd Int. Conf. on Spatial Audio (ICSA), Graz, Austria, (Sep 2015).
[44] CD Manning, P Raghavan, and H Sch¨utze. Introduction to information retrieval, Volume 1.
Cambridge University Press, (2008).
[45] R Xu and D Wunch Clustering. John Wiley & Sons, pp. 31–61 (2008).
[46] JS Long and J Freese. Regression models for categorical dependent variables using Stata. Stata press, (2006).
[47] SM Weiss, N Indurkhya, T Zhang, and F Damerau. Text mining: predictive methods for analyzing unstructured information. Springer Science & Business Media, (2010).
[48] C Buckley. “Implementation of the smart information retrieval system,” Technical report, Cornell University, (1985).
[49] JH Ward. “Hierarchical grouping to optimize an objective function,” J. Am. Stat. Assoc., vol. 58 no. 301 pp. 236–244 (Mar 1963).
[50] D McFadden. “Quantitative methods for analyzing travel behavior of individuals: Some recent developments,” InBehavioural Travel Modelling, Croom Helm, pp. 279–318 (1978).
[51] H Chen, P Cohen, and S Chen. “How big is a big odds ratio? Interpreting the magnitudes of odds ratios in epidemiological studies,” Communications in Statistics–Simulation and Computation, vol. 39 no. 4 pp. 860–864 (Apr 2010) https://dx.doi.org/10.1080/03610911003650383.
[52] N Zacharov and K Koivuniemi. “Audio descriptive analysis & mapping of spatial sound displays,” InProc. 2001 Int. Conf. on Auditory Display, Espoo, Finland (Jul 2001).
[53] J Francombe, T Brookes, and R Mason. “Determination and validation of mix parameters for modifying envelopment in object-based audio mixes,” J. Audio Eng. Soc., (In press).
Appendix I
Below is a list of the stopwords used in the text mining analysis:
doesnt, sound, sounds, bit, think, also, downmix, good, better, slightly, seems, there, needs,
little, get, like, feels, mix, clips, clip, lack, increase, decrease, lower, raise, slight, better, thinner,
child, Children, vo, dialogue, loudhailer, lady, kid, Voice, crowd, dog, bark, violins, music, chord,
narrator, narrators, woodpecker, megaphone, dad, humming, chartacters, speach, monster, son, girls, tom, shouting, boy, ducks, synth, dinosaur, dialogues, barking, footsteps, male, vocal, girl, speach,
megafono, thump, goose, character, background speakers, speaker, far, match, original, wider, centre,
trebly, first, half, opening, back, harsh, mid, high, field, shifted, atmos, stereo, lost, voice, well
Appendix II
[image:29.612.73.560.335.704.2]Table 6 shows the results of the model described in Section 3.4.1. The un-bracketed values show the model coefficients and the bracketed values show the standard errors. In this model, a large coefficient means a greater chance that a mix process would be used if a change in the attribute was detected.
Table 6: Results of multinomial regression model for Process by Clip and attributes.
Dependent variable vs No change
Spread Processing Reverb Position Bass Level
Clip2:Clip1 3.522∗∗ 2.043∗∗ 1.877 1.698∗∗ 2.376∗∗ 0.343 (1.532) (0.831) (1.212) (0.752) (1.052) (0.798)
Clip3:Clip1 2.588∗ 0.537 −0.450 1.327∗∗ 2.214∗∗ 0.222 (1.396) (0.724) (1.283) (0.628) (0.947) (0.641)
Clip4:Clip1 2.540∗ −0.308 0.332 0.500 1.256 0.110
(1.500) (0.761) (1.179) (0.651) (0.997) (0.618)
Envelopment 1.286 1.962∗∗ 2.302∗∗ 2.124∗∗∗ 2.285∗∗∗ 1.340∗ (0.936) (0.787) (1.010) (0.709) (0.869) (0.756)
Depth −0.269 −1.106 0.193 −0.243 −0.419 0.256
(0.826) (0.687) (0.899) (0.556) (0.754) (0.600)
Ensemble balance 1.562∗∗ 1.344∗∗ 2.446∗∗∗ 1.308∗∗∗ 0.489 1.504∗∗∗ (0.772) (0.594) (0.864) (0.503) (0.673) (0.529)
Spatial clarity 0.348 0.216 −0.142 −0.223 −0.329 −0.601 (0.936) (0.692) (0.914) (0.591) (0.801) (0.645)
Spatial naturalness 2.156∗∗ 1.435∗∗ 0.787 0.577 0.233 0.792 (0.940) (0.688) (0.878) (0.573) (0.781) (0.618)
Surrounding 1.711∗ −0.452 0.459 0.509 −0.203 0.235
(1.023) (0.663) (0.948) (0.589) (0.750) (0.622)
Sense of space −1.845∗ −0.628 −1.223 −0.359 −0.894 −0.683 (1.079) (0.689) (1.023) (0.619) (0.761) (0.656)
Position −1.915∗∗ −1.573∗∗ −2.058∗∗ −0.756 −1.050 −1.471∗∗ (0.873) (0.675) (0.915) (0.567) (0.714) (0.589)
Detail −0.231 −0.929 −1.650 −0.396 −1.858∗∗ −0.487 (0.959) (0.790) (1.097) (0.669) (0.943) (0.738)
Spectral clarity 0.076 0.611 −0.669 0.701 0.107 0.353 (0.825) (0.693) (0.991) (0.590) (0.843) (0.633)
Clarity −0.884 1.942∗∗∗ 1.409 0.321 2.043∗∗ 1.464∗∗ (1.056) (0.737) (0.946) (0.666) (0.833) (0.667)
Realism 1.311 1.168 0.059 0.825 0.195 0.262
(0.882) (0.739) (0.992) (0.642) (0.847) (0.696)
Bass 0.803 0.712 0.884 1.115∗∗ 1.743∗∗ 0.900
(0.814) (0.648) (0.885) (0.549) (0.779) (0.617)
Richness −0.458 0.237 0.962 0.066 1.278∗ 0.242
(0.806) (0.666) (0.842) (0.580) (0.729) (0.629)
Ease of listening −0.324 −1.012 −0.642 0.368 −1.115 −0.001 (1.123) (0.868) (1.285) (0.749) (1.032) (0.783)
Quality of reverb −0.054 −2.800∗∗∗ −1.816∗ −2.355∗∗∗ −2.416∗∗∗ −1.848∗∗ (0.908) (0.842) (0.957) (0.724) (0.917) (0.752)
Harshness 1.723 3.484∗∗∗ 3.548∗∗∗ 2.214∗∗ 3.647∗∗∗ 1.934∗ (1.222) (1.018) (1.136) (0.984) (1.068) (1.018)
Constant −5.186∗∗∗ −1.994∗∗∗ −3.632∗∗∗ −2.207∗∗∗ −2.970∗∗∗ −1.121∗∗ (1.469) (0.601) (0.992) (0.553) (0.847) (0.466)
∗p<0.1; ∗∗p<0.05;∗∗∗p<0.01
List of Figures
1 Test interface used in the listening tests. . . 8
2 Frequency of use of words within the corpus after stemming and removal of stopwords. 10 3 Frequency of process use across all systems and programme items (out of a total of 338 phrases). . . 13
4 Cumulative percentage of process use, broken down by system. . . 14
5 Cumulative percentage of process use, broken down by object type. . . 15
6 Frequency of attribute use across all systems and programme items. . . 16
7 Dendrogram showing hierarchical agglomerative clustering of attribute use across all systems and programme items. . . 17
8 Summary of the relationships revealed in models described in Sections 3.4.1 and 3.4.2. The red arrows indicate a large effect size, yellow is a medium effect size, green is a small effect size, and grey is a very small effect size. . . 22
Biographies
James Woodcock
William J Davies
Bill Davies is professor of acoustics and perception at the University of Salford. He researches human response to complex sound fields in areas such as room acoustics, spatial audio and urban soundscapes. He led the Positive Soundscape Project, an interdisciplinary effort to develop new ways of evaluating the urban sound environment. Bill also leads work on perception of complex auditory scenes on the S3A project. He edited a special edition of Applied Acoustics on soundscapes, and sits on ISO TC43/SC1/WG54 producing standards on soundscape assessment. He is also an Associate Dean in the School of Computing, Science and Engineering at Salford, and a recent Vice-President of the Institute of Acoustics (the UK professional body). Bill holds a BSc in Electroacoustics and a PhD in auditorium acoustics, both from Salford. He is the author of 80 academic publications in journals, conference proceedings and books.
Frank Melchior
Frank Melchior received the Dipl.-Ing. degree in media technology from the Ilmenau University of Technology, Germany in 2003 and the Dr ing. degree from Delft University of Technology, The Netherlands, in 2011. From 2012 to 2017 he led the audio research group and the BBC Audio Research Partnership at BBC Research and Development. From 2009 to 2012 he was the Chief Technical Officer and Director Research and Development at IOSONO GmbH, Germany. From 2003 to 2009 he worked as a researcher at the Fraunhofer Institute Digital Media Technology, Germany. He holds several patents and has authored and co-authored a number of papers in international journals and conference proceedings.
Trevor J Cox