International Journal of Emerging Technology and Advanced Engineering
Website: www.ijetae.com (ISSN 2250-2459, ISO 9001:2008 Certified Journal, Volume 7, Issue 7, July 2017)
80
GPR Based Detection System to Diagnose Problems of
Underground Distribution Systems
P. Kiran Kumar Reddy
Department of CSE, MRIET - JNTUH, Hyderabad, INDIA
Abstract
-
Laboratory experiments were used to investigate the potential of using ground penetrating radar (GPR) to detect problems in the underground distribution system. Surface geophysical methods are noninvasive, trenchless tools used to characterize the physical properties of the subsurface material. This characterization is then used to interpret the geologic and hydro geologic conditions of the subsurface. Many geophysical techniques have been suggested among them Ground penetrating radar (GPR) is one of the common sensor systems for underground inspection. GPR is areflection technique which uses high frequency
electromagnetic waves to acquire subsurface information. GPR responds to changes in electrical properties, which are a function of soil and rock material and moisture content. It emits electromagnetic signals which can pass through objects are recorded, digitized and then, the B-scan images are formed. Depending upon the properties of scanning object, GPR creates different intensity values on the object regions. Thus, these changes in signal represent the properties of scanning object. This paper proposes a three step method to detect and discriminate buried pipes : N-row average-subtraction (NRAS), Min-max normalization and image scaling. Proposed method has been tested using three common algorithms from the literature. Results shows increased object detection ratio and positive object discrimination (POD) significantly.
Keywords - GPR, B-scan images, N-row average subtraction, Min-max normalization.
I. INTRODUCTION
Ground-penetrating radar (GPR) uses radar pulses to image the subsurface and can be used in a variety of media, including rock, soil, ice, fresh water, pavements etc,. This method uses electromagnetic signals UHF/VHF frequencies range of the radio spectrum to detect the reflected signals from subsurface structures. It can detect objects, changes in material, and voids cracks. Many methods1 are there for detecting buried objects. Among them, detection using GPR has attracted many researchers attention due to its various advantages. Mine detection using GPR data and signal processing techniques has a long history5, 10. Sezgin and Kurugollu8 state that GPR offers better detection possibilities.
The signals gathered from sensing devices are processed using different signal and image processing techniques. Some methods applied for mine detection are background removal11, hidden Markov models (HMMs)12,13 using frequency domain features3, Fuzzy K-nearest neighbours4, edge histogram descriptors14, and adaptive approaches for anomaly detection15,22, etc. Due to the real-time requirements many researchers developed two staged algorithms: pre-screening and feature-processing stages.
In this paper, a three step method is proposed to locate and discriminate buried pipe lines: Processing B-scan images according N-row average subtraction, Using Min-max normalization for the intensity values and Scaling images. Then, the paper tests/analyses proposed method using three common algorithms from the literature.
II. METHODOLOGY
A.Data set used
The data has been collected using soft soil and 1 GHz GPR signals for two types of objects i.e concrete and plastic of 10 cm - 25 cm diameter for different object depths i.e 3 cm, 10 cm, 20 cm, 30 cm and 40 cm. Finally for different antenna heights: 5 cm, 10 cm, 15 cm, and 20 cm. A-scan signals are captured23,24 as shown in Fig 1, there is high fluctuation in the first few rows in depth direction where the signal passes from air to the ground which is called ground bounce. It is also important to note that the average intensity is very high represented by dashed line.
International Journal of Emerging Technology and Advanced Engineering
Website: www.ijetae.com (ISSN 2250-2459, ISO 9001:2008 Certified Journal, Volume 7, Issue 7, July 2017)
81
To have better signal to noise ratio (SNR), every point is scanned several times usually 4 or 8. Later, the signal is digitized and averaged by using equation-116. For better detection, the signals have been digitized using 2-byte intensity resolution (from 0 to 65535).aA(x,y,z) = (1/R)∑ a (x,y,z) ….(1)
Where R is the number of A-scan signals taken and aA (x , y , z) is the averaged A-scan signal over R scans. Finally, A-scan signals are combined together to form B-scan images. Figure 2 shows two B-scan images where image (b) contains dashed rectangle to highlight the object region from the image (a). Thus, 10 B-scan images have been collected for every object depth and antenna height then the images have been classified into three categories. True positive (TP) images: images which contain query object whose type and position are known, True negative (TN) images: images which do not contain any query object, and Images which contain a query object but whose position are not recorded.
FIGURE 2: B-SCAN IMAGE CAPTURED FOR A CONCRETE OBJECT WHICH IS BURIED UNDER 3 CM
The objects are usually buried less than 10 inches deep7,12,19. But in this study, there are some objects which are buried 30 cm and 40 cm deep. When an object goes beyond the sensing limits of GPR sensors, the object cannot be captured in the image. Images in which the object depths are 20 cm - 30 cm and antenna heights are10 cm, 15 cm, and 20 cm is as shown in Figure 3. It is clear that for the same object depth (rows), when the height of antenna changes (columns), the object is detected in deeper positions in the image. In the figure, although the object used in all scans is the same object, it is captured in deeper positions in the images. After a point the object disappears from the visible scene of the image. Thus, the images which are out of the detection limits of GPR have been used as TN images and we have the following number of images in tests: 310 TP images (250 concrete pipes and 60 Plastic pipes) and 180 TN images.
B.N-Row Average Subtraction (NRAS)
Row mean subtraction (RMS)20,21 provides lower results compared to N-row average subtraction (NRAS) for many algorithms tested. When GPR signals pass through a medium with the same properties, they are reflected back with same signal levels produce same signals like beam bands for the entire row which can be seen in Figure 4 on the rows from 140 to 200. When beams pass through a different medium, they are returned with different peaks or holes in the signal. These peaks and holes serve as a signature of the object being captured.
FIGURE 3: GPR SIGNAL TAKEN FROM DIFFERENT DEPTHS AND ANTENNA HEIGHTS
Using these parallel bands, the images can be normalized16. As an example, for processing according to 3-row average, the average of the current, preceding and the next rows is subtracted from every pixel intensities of the current row. Then, the real object information i.e peaks & holes are left and extra information is removed from the signal. (where µr is the average of rth row and cra. is the average of current, preceding and the next row averages. Later, cra is subtracted from every element of the current row).
cra = µ (µr - 1, µr, µr +1) a (x, zr) = a (x, zr) – cra ….(2)
International Journal of Emerging Technology and Advanced Engineering
Website: www.ijetae.com (ISSN 2250-2459, ISO 9001:2008 Certified Journal, Volume 7, Issue 7, July 2017)
82
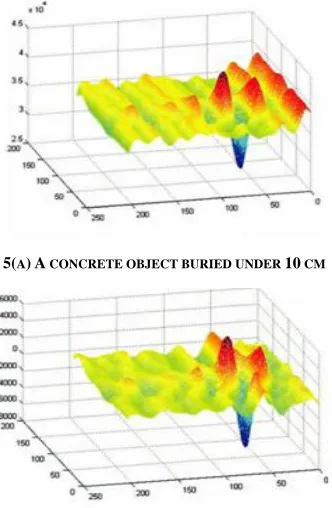
Figure 5 shows images (a, b, and c) before and after processing. 3-row average subtraction method preserves most of signal properties while removing extra information. Furthermore, the signatures are preserved even after significant image scaling17.5(A) A CONCRETE OBJECT BURIED UNDER 10 CM
5(B) AFTER PROCESSING ACCORDING TO 3-ROW AVERAGE
[image:3.612.86.252.200.454.2]5(C) AFTER RE-SIZING IMAGE TO 50 PER CENT FIGURE 5. IMAGES BEFORE AND AFTER PROCESSING
C.Runtime Complexity
N-row average subtraction calculates the average of every row. Then, N-row average is subtracted from row of every element. Therefore, it uses 2 hw operations where h
and w are the dimensions of 2D B-scan image. After NRAS, data is Min-max normalized 2hw operations.
As a result, the runtime complexity of the proposed uses 4 hw operations. Thus, the runtime complexity is O (hw ). As a result, the method shows reasonably better runtime performance. By the use of image scaling, the method is promising for online detection.
III. IMPLEMENTATION AND RESULTS
The effects of NRAS have been analyzed using three common algorithms: ANN, SVM, and K-Means. For comparison of the results, algorithms have been tested using four test settings:
1.No Normalization (NN): Raw images without operations.
2. Min-max Normalization (MM): The image intensity is normalized to the range from 0 to 1 and these images crops are taken for testing.
3.NRAS: (where n is an odd number between 1 and 7). Entire image is processed according to NRAS. Then, the image crops are taken.
[image:3.612.343.570.431.577.2]4.3-row average+ Min-max normalization (3RM): Entire image is first processed according to 3-row average subtraction. Then, the image is Min-max normalized to the range from 0 to 1 and the image crops are taken.
TABLE I
OBJECT CLASSIFICATION FOR K - MEANS
There are 180 negative (TN) B-scan images, 250 B-scan images which contain a concrete pipeline object, and 60 B- scan images which contain a plastic pipeline object. Every B- scan image is 256-by-180 pixel image where the 256 rows represent the depth. Objects usually create a 60-by-90 signature in the image. Because dataset is small, 60-by-90 image crops have been taken from the existing negative images. Hence entire image is negative, any part of the image can be cropped as a new negative image. Thus, 6 image crops have been taken from random coordinates of each TN image.
Actual object
Object Detected
Concrete Plastic Nothing
Concrete 1156 789 555
Plastic 91 85 424
[image:3.612.78.261.476.600.2]International Journal of Emerging Technology and Advanced Engineering
Website: www.ijetae.com (ISSN 2250-2459, ISO 9001:2008 Certified Journal, Volume 7, Issue 7, July 2017)
83
As a result, a set of (180 × 6) =1080 TN images have been produced. However, TP images cannot be reproduced with the way negative images have been reproduced. To produce more test sets, the program was run 10 times. In every run, the orders of images have been shuffled randomly to construct different test and data sets: as a total of (10 × (1080 + 250 +60)) = 13900 test images.A.Performance Measurement and Formulas
One of the best algorithms in data mining23 is K-Means, which is an unsupervised clustering algorithm. As there are only 60 plastic test objects, the cluster with the most number of items cannot be the cluster for plastic objects. Later, the objects assigned to the cluster have been verified if they are assigned correctly or not.
By this way, the clusters of K Means have been used like a classifier. Table 1 has been produced with the following conditions: K Means with K=3; three classes: concrete objects, plastic objects and None exists, for 1080 TN and 310 TP (250 concrete and 60 plastic objects),60-by-90 image crops have been scaled to 25 per cent, program was run 10 times, using MM (test setting 2).
K-Means has identified 1156 metal objects correctly as concrete ; 789 concrete objects have been misclassified as plastic and 555 concrete objects have been misclassified as Nothing. Thus,(1156 + 85 + 6669 )= 7910 images out of 13900 have been identified correctly. That is 56.9 per cent of all objects have been classified correctly. Table 2 shows the truth table for the confusion matrix When an object is identified correctly as in the dataset, it is count as TP or TN. If a positive image classified as negative, then it is false negative (FN). When a concrete object is classified as plastic object, it cannot be said to be FN or TP. Thus, in the results, they are assumed to be false classification (FC).
TABLE II
TRUTH TABLE FOR THE CONFUSION MATRIX
Object Detected
Actual object
Concrete Plastic Nothing
Concrete TP FC FN
Plastic FC TP FN
Nothing FP FP TN
Object detection ratio (ODR) is the ratio of objects detected as in the dataset (TP+TN) to the total number of objects.
ODR=(TP+TN)/All objects = 7910/13900 = 56.9 % ….(3) Positive object discrimination (POD) is the ratio of TPs to the number of all positive objects. (1156 + 85 )=1241 of the positive images have been classified correctly. And, there are totally (10 × 310 )= 3100 positive objects used in 10 runs. This gives 40 per cent positive object discrimination accuracy.
POD=TP/All positives = (1165+85)/3100 = 40% …(4) False alarm rate (FAR) is the ratio of negative objects identified as positive (FP) to the total number of negatives. FAR=FP/All negatives =(1850+2281)/10800=38.3% ...(5) Then, the overall performance can be defined as follows: OP=(POD+ODR-FAR) / 2 …….(6)
A.Implementation using K-Means
The implementation details described above have been used for three different image scales. Table 3 shows the results for K Means for the test settings given. It can be seen from the table that there is high FAR ratio, except NRAS test settings. Secondly, usage of MM improves POD result. However, it also increases FAR and thus decreases ODR.
TABLE III THE RESULTS FOR K-MEANS
OP(%) POD(%) ODR(%) FAR(%)
NN 25.2 66.5 21.7 35.0
MM 35.5 59.3 33.9 30.5
1 R 25.9 83.5 0.0 54.7
3 R 25.9 83.5 0.0 54.7
5 R 26.7 83.7 0.0 55.2
7 R 25.9 83.5 0.0 54.7
International Journal of Emerging Technology and Advanced Engineering
Website: www.ijetae.com (ISSN 2250-2459, ISO 9001:2008 Certified Journal, Volume 7, Issue 7, July 2017)
84
5-row average subtraction (5R) has provided the best overall performance (OP) with 55.2 %. Because the POD results for NRAS are very low, 3RM can also be noted for its good result. At this test setting, POD increases from25.2 %to 63.2 % and a relative increase in ODR is provided. The results for 1R, 3R and 7R are the same. But, 5-row average subtraction (5R) gives relatively better result than the others. Despite the results are low, applications of NRAS and 3RM increases the OP notably. The low results are mostly because K-Means is an unsupervised clustering algorithm.B.Using Support Vector Machines
Support vector machines (SVM)18 is one of the well-known algorithms in Machine learning9 which provides linear and non-linear classification algorithms for binary/multi-class representations. When a new testing item is projected, the class is defined according to the position on the hyper-plane. This method has been tested using Rapidminer toolbox, using four test settings with the following conditions.
In the tests there are 310 positive and 1080 negative image crops, Image crops have been resized to 20 %, 25% and 33 % , 5-Fold cross validation has been used, and Lib SVM from Rapid miner with the following parameters has been used ( Kernel type: linear, C=0 an Epsilon=2,Where C is the cost and Epsilon is the tolerance of the termination criteria ).
Table 4 shows the average results from 3 scales. Firstly, the results are better than the results using K-Means. The decrease in FAR is notable. Furthermore, the increase in POD and ODR did not increase FAR and decreased to 0.22 %. Similar to K Means, usage of MM has provided some improvement on the results. And, application of NRAS has provided better results than MM. However, the best results have been achieved using 3RM. While the OP for NN is 61.7 % it increases to 81.6 % with the application of3R. 1R has produced better results than 3R and 5R. However, the best OP is provided by 3RM which reaches to 87.7 %.
TABLE IV THE RESULTS FOR SVM
OP(%) POD(%) ODR(%) FAR(%)
NN 37.85 85.92 0.28 61.7
MM 54.73 89.78 0.15 72.2
1 R 74.09 94.15 0.09 84.1
3 R 70.11 93.21 0.15 81.6
5 R 69.25 93.05 0.12 81.1
7 R 68.71 92.95 0.09 80.08
3 RM 80.22 95.42 0.22 87.7
D. Using Artificial Neural Networks
Artificial Neural networks (ANN)2,6 is another very common Machine Learning algorithm. The tool uses Sigmoid activation function by default. Then, the following properties have been selected for the tests:
Number of training cycles: 5,
Learning rate: 0.7,
Momentum: 0.7,
Error epsilon: 0.02,
2 hidden layers with 20 Nodes.
The results, presented in Table 5, are better than the results for SVM.
TABLE IV ANN RESULTS
OP(%) POD(%) ODR(%) FAR(%)
NN 77.42 94.82 0.19 86.0
MM 78.17 94.94 0.25 86.4
1 R 76.99 94.82 0.06 85.9
3 R 78.82 93.24 2.62 84.7
5 R 79.25 95.37 0.00 87.3
7 R 78.06 95.11 0.00 86.6
International Journal of Emerging Technology and Advanced Engineering
Website: www.ijetae.com (ISSN 2250-2459, ISO 9001:2008 Certified Journal, Volume 7, Issue 7, July 2017)
85
Similar to K-Means application of 5R has provided slightly better POD and ODR accuracies than NN. The application of 3RM has increased both POD and ODR results while providing a slender increase in FAR. ANN has provided better OP than the other two algorithms Even though, the OP for NN is high, 86.0%, it reaches to92.2 % by the application of 3RM. And, this is the best overall performance among all three algorithms.IV. CONCLUSIONS
The effectiveness of GPR as a tool for detecting problems of pipes is examined in this experiment. Pipeline detection requires fast and accurate detection performance. This paper proposes a method which provides fast processing while increasing the accuracy. The algorithm consists of three steps: NRAS, Min-max normalization and Image scaling. Application of the proposed method not only increases ODR and POD results but also provides better runtime performance.
The positive effect of NRAS is seen on all testing algorithms. For K Means algorithm, although, Min-max normalization increases POD, but due to high FAR result, the ODR decreases to 59.3 %. However, when 3RM is used, both ODR and POD results increase comparably. The high FAR rate for K Means is due to the nature of the algorithm.SVM increases POD from 37.85 %to 80.22 %. Moreover, it provides notably low FAR results compared to the other algorithms. Although, ANN has a bit higher FAR than SVM, it provides higher results than the other two testing algorithms.
REFERENCES
[ 1] G. Olhoef, “Applications of ground penetrating radar,” in Proc. 6th Int. Conf. Ground Penetrating Radar (GPR’96), Sendai, Japan, Oct. 3, 1996, pp. 1–4.
[ 2] J. D. Young and L. Peters, Jr., “A brief history of GPR fundamentals and applications,” in Proc. 6th Int. Conf. Ground Penetrating Radar (GPR’96), Sendai, Japan, Oct. 3, pp. 5–14.
[ 3] Frigui, H. & Gader, P. Detection an discrimination of land mines in ground-penetrating radar based on edge histogram descriptors and a possibilistic k-nearest neighbor classifier. IEEE Trans. Fuzzy Sys., 2009, 17(1), 185-199. doi: 10.1109/TFUZZ.2008.2005249. [ 4] Torrione, P.A.; Throckmorton, C.S. & Collins, L.M. Performance of
an adaptive feature-based processor for a wideband ground penetrating radar system. IEEE Trans. Aerospace Electron. Sys., 2006, 42(2), 644-658. doi: 10.1109/TAES.2006.1642579
[ 5] U. Spagnolini, “Permittivitty measurements of multilayered media with monostatic pulse radar,” IEEE Trans. Geosci. Remote Sensing, vol. 35, pp. 454–563, Mar. 1997.
[ 6] L. Gupta, M. R. Sayeh, and R. Tammana, “A neural network approach to robust shape classifications,” Pattern Recognit., vol. 23, pp. 563–568, 1990.
[ 7] Daniels, D.J. Surface-penetrating radar. Electron. Commun. Eng. J., 1996, 8(4), 165-182. doi: 10.1049/ecej:19960402
[ 8] Sezgin, M.; Kurugollu, F.; Tasdelen I. & Ozturk, S. Real-time detection of buried objects by using GPR. In Detection and Remediation Technologies for Mines and Minelike Targets IX, Orlando FL, 2004. doi: 10.1117/12.541128
[ 9] Wilson, J. N.; Gader, P.; Lee, W.H.; Frigui, H. & Ho, K.C. A large-scale systematic evaluation of algorithms using ground-penetrating radar for landmine detection and discrimination. IEEE Trans. Geosci. Remote Sensing, 2007, 45(8), 2560-2572. doi: 10.1109/TGRS.2007.900993
[ 10]Gader, P.D.; Mystkowski, M. & Zhao, Y. Landmine detection with ground penetrating radar using hidden Markov models. IEEE Trans. Geosci. Remote Sensing, 2001, 39(6), 1231-1244. doi: 10.1109/36.927446
[ 11]Frigui, H. & Gader, P. Detection and discrimination of land mines based on edge histogram descriptors and fuzzy k-nearest neighbors. In IEEE International Conference in Fuzzy Systems, Vancouver, BC, 2006. doi: 10.1109/fuzzy.2006.1681906
[ 12]M. Physics model-based signal processing of GPR for subsurface object detection and discrimination. Department of electrical and computer engineering, Duke University, Durham, NC, 2003. [ 13]Turk, A.S. Ultra-wideband Vivaldi antenna design for multisensor
adaptive ground-penetrating impulse radar. icrowave Opt. Technol. Let., 2006, 48(5), 834-839. doi: 10.1002/mop.21491
[ 14]Ratto, C.R.; Morton, K.D.; McMichael, I. T.; Burns, B.P.; Clark, W.W.; Collins, L.M. & Torrione, P.A. Integration of lidar with the NIITEK GPR for improved performance on rough terrain. SPIE Def., Security, Sensing, 2012, 5089, 1375-1382. doi: 10.1117/12.919119
[ 15]Iurlaro, M.; Ficz, G.; Oxley, D.; Raiber, E.-A.; Bachman, M.; Booth, M. J.; Andrews, S.; Balasubramanian, S. & Reik, W. A screen for hydroxymethylcytosine and formylcytosine binding proteins suggests functions in transcription and chromatin regulation. Genome Biology, 2013, 14(10), R119. doi: 10.1186/gb-2013-14-10-r119
[ 16]Liu, Z.; Zhou, F.; Chen, X.; Bai, X. & Sun, C. Iterative infrared ship target segmentation based on multiple features. Pattern Recognition, 2014, 47(9), 2839--2852. doi: 10.1016/j.patcog.2014.03.005 [ 17]Mesecan, I. & Bucak, I.O. Searching the effects of image scaling for
underground object detection using K Means and KNN. In UKSim-AMSS 8th European Modelling Symposium, Pisa, 2014. doi: 10.1109/ems.2014.64
[ 18]Wu, X. & Kumar, V. The top ten algorithms in Data Mining, Boca Raton, London, New York: Chapman & Hall/CRC Taylor & Francis Group, 2009.
[ 19]Vladimir, V.N. Estimation of dependences based on empirical data. New York: Springer, 2006.
[ 20]Hofmann, M. & Klinkenberg, R. RapidMiner: Data mining use cases and business analytics applications. CRC Press, 2013.
International Journal of Emerging Technology and Advanced Engineering
Website: www.ijetae.com (ISSN 2250-2459, ISO 9001:2008 Certified Journal, Volume 7, Issue 7, July 2017)
86
[ 22]Torrione, P.A.; Collins, L.M.; Clodfelter, F.; Frasier, F. & Starnes, I.Application of the LMC algorithm to anomaly detection using the Wichmann/NIITEK ground-penetrating radar. In AeroSense, Orlando, FL, 2003.doi: 10.1117/12.487241
[ 23]Sezgin, M.; Bahadirlar, Y. & Tasdelen I. Signal processing techniques to improve GPR detection performance. In Detection and Remediation Technologies for Mines and Minelike Targets X, Orlando, Florida, 2005 doi: 10.1117/12.603098