International Journal of Emerging Technology and Advanced Engineering
Website: www.ijetae.com (ISSN 2250-2459,ISO 9001:2008 Certified Journal, Volume 3, Issue 10, October 2013)
26
Pattern Classification of EEG Brainwave Signals Under the
Influence of High Frequency RF Radiation
R.M. Isa
1, M.N. Taib
2, I. Pasya
3,
H. Norhazman
4, A.H. Jahidin
5, W.R.W. Omar
6, N. Fuad
71
Faculty of Electrical Engineering, Universiti Teknologi MARA, 40450 Shah Alam, Malaysia
Abstract—The effects of mobile phone usage on human
health are now becoming the subject of recent interest and study. Analysis and observations of the electroencephalogram (EEG) signals can provide valuable insight and thus improves the understanding of the radiofrequency (RF) radiation influence towards human brain. This paper evaluates the selected classifiers for the classification of brainwave datasets due to the effects of RF radiation. The classification techniques considered here are Discriminant Function Analysis (DFA), Logistic Regression (LR), k-Nearest Neighbor (kNN) and neural network Back Propagation (BP). Beta, alpha, theta and delta brainwaves were used as inputs to the classification system with three discrete outputs: Left Exposure (LE), Right Exposure (RE) and Sham Exposure (SE) group. These classifiers are evaluated based on the classification accuracy and the number of samples correctly classified. The BP based classifier outperformed the other classifiers with 100% classification accuracy.
Keywords— EEG, brainwave, asymmetry, radiation, classification;
I. INTRODUCTION
Mobile phone has become one of the most important items in human daily lives in line with the increase in its functionality and applications. Mobile phone operates in microwave range using RF electromagnetic radiation. The emitted RF energy, which is in the form of radiation, has been under study for many years for its effects on the human body [1]. Since mobile phone is used in close proximity to the human head, concerns have been raised regarding the effects of radiation from the mobile phone on human body, especially the brain.
The RF emissions from mobile phones produce thermal and non-thermal effects. Holding the phones near to the body and extend the conversations over a long period of time caused the thermal effects. Therefore, to ensure minimal radiation effects on consumers, time exposure and environment temperature must be one of the characteristic qualities in safety standards [2]. Data communication network and other digital wireless systems also emit the same radiation.
Electromagnetic components have been shown to be directly and independently causing biological changes [3, 4]. The everyday utilized wireless communication devices, such as wireless phones and routers, have some influence on the electrical activity of the brain in the short term such as heating, headache, fuzziness, fatigue and nausea symptoms [5, 6].
Due to the proximity of the antenna of the mobile phone to the consumer’s ear and head, the brain is inevitably exposed to high frequency electromagnetic radiation with a relatively high Specific Absorption Rate (SAR) [7]. The farther the chassis and hands are from the head, the more the SAR in the head is reduced as compared to the values without hand. However, the SAR in hands increased at the same time. At 900 MHz, when the distance increases from 2 to 14.5 mm, the SARs in the head are approximately 70%–60%. Correspondingly, at 1800 MHz the SARs in the head are approximately 95%–50% [8].
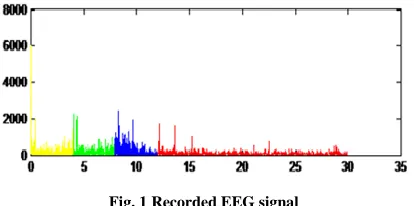
[image:1.612.342.549.565.668.2]EEG signals involve a great deal of human brain function information. A better understanding of the dynamics of human brain through EEG analysis can be obtained using deeper analysis of the EEG records. The recorded EEG provides a continuous graphic exhibition of the spatial distribution of the changing voltage fields over time. Fig. 1 shows the recorded human brainwave EEG signals under the influence of mobile phone RF radiation. The signals was filtered within four frequency bands –delta (<4 Hz), theta (4-8 Hz), alpha (8-12 Hz) and beta (12-30 Hz) [9].
International Journal of Emerging Technology and Advanced Engineering
Website: www.ijetae.com (ISSN 2250-2459,ISO 9001:2008 Certified Journal, Volume 3, Issue 10, October 2013)
27
Numerous techniques from the theory of signal analysis have been used to obtain representations and extract the features of interest for pattern recognition and classification purposes. The brain hemispheres are not exactly symmetrical, but the degree of asymmetry between the two hemispheres is insignificant [10]. Brain asymmetry means that both brain hemispheres have to work closely to ensure a smooth operating and having an overly dominant hemisphere is invariably not a good thing on human [11]. Statistical pattern recognition and intelligent classification techniques have been applied for EEG analysis. Classification is the process of finding a set of models or functions that describes and distinguishes data classes or concepts for the purpose of predicting the class of objects whose class labels are unknown [12]. Popular techniques for analysing steady state information include principal components analysis, cluster analysis, discriminant function analysis, and artificial neural networks [13-15].DFA was used to classify the brainwaves and to distinguish between the output groups using significant contribution of inputs [16]. Computationally, DFA is similar to the analysis of variance (ANOVA). Logistic regression (LR) measures the relationship between a categorical dependent and independent variables by using probability scores as the predicted values of the dependent variable [17]. K-Nearest Neighbor (kNN) is extremely simple to implement and lends itself to a wide variety of variations [12]. kNN classifier finds the k nearest neighbors based on some distance metric by finding the distance of the target data point from the training dataset, then finding the group from those nearest neighbors by some voting mechanism. Back propagation algorithm is the most commonly used algorithm and it is a simple feed forward artificial neural networks. The algorithm adjusts network weights by error propagation from the output to the input [18].
The effects of mobile phone usage and the brainwave pattern after being exposed to mobile phone RF exposure have been studied in previous work [9, 11, 19, 20]. The brain hemisphere dominance is also investigated by using Power Asymmetry Ratio (PAR) after exposed to RF at left and right side of the brain [11].
Therefore, this research will observe more detail on the PAR pattern influenced by RF emission by using classification techniques. The accuracy of the classifiers will be assessed and cross compared.
II. MATERIAL AND METHOD
A. Data Acquisition and Signal Preprocessing
The EEG data used in this study were downloaded from 5 minutes EEG recorded among 95 subjects. The signals were taken during the RF exposure source from a mobile phone. The measurements were carried out at Universiti Teknologi MARA (UiTM), Selangor, Malaysia. The subject consisted of 33 males and 62 females, age range from 18 to 26 years old. They were divided into LE, RE and SE group. Subjects in LE group were being exposed to RF radiation from left brain hemisphere, subjects in RE group were being exposed to RF radiation from right brain hemisphere and subjects in SE group were used as control group with no RF radiation. Recording were done in a control environment at the laboratory. EEG data were acquired with Ag/Agcl disc electrodes placed using 10-20 standard electrode placement system. All electrodes impedance was maintained below 5kΩ. The bipolar EEG channels selected for analysis are Fp-01 and Fp-02. All EEG records were taken during restful wakefulness state with close eye condition.
International Journal of Emerging Technology and Advanced Engineering
Website: www.ijetae.com (ISSN 2250-2459,ISO 9001:2008 Certified Journal, Volume 3, Issue 10, October 2013)
[image:3.612.73.253.135.304.2]28
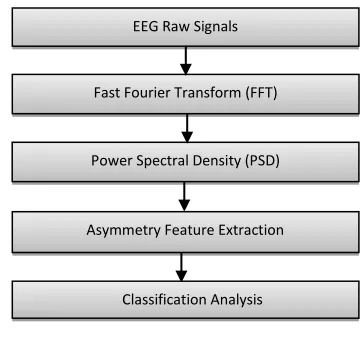
Fig. 2 Flow diagram of the methodology
B. Signal Processing and Feature Extraction
The mean and the standard deviation of PSD for all brainwave sub-bands were calculated in order to confirm that the standard deviation is smaller than the average of the data. The mean and standard deviation measure two different characteristics of the dataset. The mean measures where the data is centered, whereas the standard deviation measured how spread the data is. A large standard deviation indicates a wide range of data and the greater the range of the data, the less representative the mean become. This might effect in finding the statistical significant differences of the dataset.
The hemispheres of the human brain are functionally and structurally asymmetric. Asymmetry will indicate which brain hemisphere is more dominant under the RF radiation influence [11]. Power Asymmetry ratio (PAR) feature selection was used to observe the brain asymmetry ratio and hemispheres difference as shown in Eq. (1). The larger the ratio, the greater the difference of brainwave signals between the left and right hemispheres.
Power Asymmetry Ratio (PAR) = (1)
Where PR = right PSD PL = left PSD
C. Classification Analysis
The data from the EEG recording were further analyzed for brainwaves classification observation due to the effects of RF radiation exposure having from a mobile phone. The techniques used were Discriminant Function Analysis (DFA), Logistic Regression (LR), k Nearest Neighbour (kNN) and neural network Back Propagation (BP).
Discriminant Function Analysis (DFA) is generated from a sample of cases for which group membership is known. Forward stepwise variable selection was used to illustrate the progression of the analysis. DFA finds a set of linear combinations of the variables, where the values are as close as possible within group and as far apart as possible between groups. The linear combinations are called discriminant function as shown in Eq. (2).
=
+
+ … +
(2)Where
= canonical discriminant function score for case m in the group k
= value of discriminant variable for case m in the group k
= coefficient
Logistic regression (LR) was used as regression analysis to predict the output of a categorical dependent variable based on more predictor input variables. LR is a widely used statistical modeling technique in which the probability (P1) of output is related to a set of explanatory variables. LR calculates the changes in the logarithm of odds of the response variables, rather than the changes in the response variables itself. The logarithm of odds is linearly related to the explanatory variables, therefore the regressed relationship between the response and the explanatory variables is not linear [17]. Probability, P1 is related to a set
of explanatory variables in the form as shown in Eq. (3).
= (3)
Where = intercept
= explanatory variable coefficients
= explanatory variable
K-Nearest Neighbor (kNN) classification method is known as a nonparametric procedure for estimation of local class conditional probability density functions from sample patterns and dependent on their features [21]. The k value is a constant which is to show the most frequent of the training sample that is nearest to the data test point. Choosing an appropriate k is essential in order to obtain the highest accuracy value for testing and training percentage thus making the classification more successful. Euclidean distance is the most method that being used in kNN classifier. The formula as shown in Eq. 4 and EEG dataset was divided into 80:20 ratios for training and testing.
Power Spectral Density (PSD) EEG Raw Signals
Fast Fourier Transform (FFT)
Asymmetry Feature Extraction
International Journal of Emerging Technology and Advanced Engineering
Website: www.ijetae.com (ISSN 2250-2459,ISO 9001:2008 Certified Journal, Volume 3, Issue 10, October 2013)
29
Euclidean distance, D (4)Where
= individual value of the dataset
Backpropagation (BP) is the most frequently used training algorithms to train a neural network. BP algorithm is based on searching an error surface using gradient descent for points with minimum error and relatively easy to implement [17]. The selected EEG signals were divided into 2 set of data. 80% was used for training and 20% for testing. Based on literature review, a single hidden layer feed forward networks will be suitable for this study and the BP training algorithm will be applied for adjusting the network weights as well as the hidden layer size. The training network minimizes the error by estimating the weights. The minimization procedure can be performed using the gradient-descent method, where the learning parameters adjusted the weight vectors. The network optimized parameters were learning rate, momentum rate, error goal and number of epochs.
III. RESULTS AND DISCUSSION
A. PAR Pattern Analysis
The comparison for pattern analysis was made between 3 groups of RF exposure to extract the significant differences. Fig. 4 depicts the left and right brainwaves and the difference between both hemispheres. It shows that left and right brainwaves in LE and RE have greater difference as compared to SE. This shows that as control group with no RF radiation exposure, SE has more balance left and right brainwaves. Due to the RF radiation, brainwaves in LE and RE become unbalance between hemispheres. It is because subjects in LE were exposed to the radiation at the left side of the brain and subjects in RE were exposed at the right side of the brain. The finding suggesting that radiation exposure from mobile phone may modulate temporarily the activity of human brain [22].
[image:4.612.335.559.261.421.2]
Fig 4. Brainwave sub-bands and difference between hemispheres
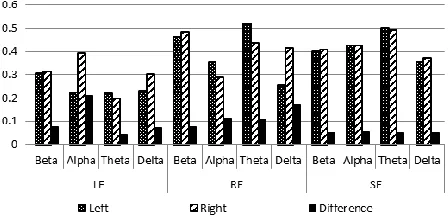
Fig. 5 shows the PAR of brainwaves under the influence of mobile phone RF radiation for beta, alpha, theta and delta sub-bands. It can be seen clearly that group SE has the smallest left and right PAR ratio. In contrast, group LE has the highest PAR for beta, alpha and theta. Hence, delta PAR is biggest in group RE. This shows that the greater difference having by samples in LE and RE group was due to the RF radiation. Thus deduced that, RF radiation exposure gives some effects to the human brainwaves signals and resulted in unbalanced brainwave signals [9].
Fig. 5 PAR of brainwave sub-bands
[image:4.612.57.281.581.690.2]International Journal of Emerging Technology and Advanced Engineering
Website: www.ijetae.com (ISSN 2250-2459,ISO 9001:2008 Certified Journal, Volume 3, Issue 10, October 2013)
30
Fig. 6 Box plot of scatter data in group LE, RE and SE
B. Classification and Performance Measure
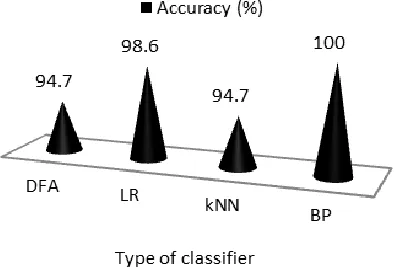
[image:5.612.335.557.159.223.2]Graph shows the performance measure using 4 types of classifiers. The comparison was done between Discriminant Function Analysis (DFA), Logistic Regression (LR), k-Nearest Neighbor (kNN) and neural network Back Propagation (BP) technique. Fig. 7 depicts that BP has the best classification accuracy (100%) followed by LR (98.6%) and the lowest are DFA and kNN (94.7%).
Fig. 7 Classification accuracy for different classifiers
Table 1 presents the summary of performance measures for all the classifiers. It is obvious from Table 1 that BP classifier is ranked first in terms of its classification accuracy. The BP correctly classified all the samples data, whereas 3 data were misclassified by LR and 5 data were misclassified by DFA and kNN as shown in the table.
TABLEI
COMPARISON OF CLASSIFIERS FOR PAREEGRF EXPOSURE
Classifier type Correctly classified Accuracy (%)
DFA 90 94.7
LR 92 98.6
kNN 90 94.7
BP 95 100
[image:5.612.356.535.365.504.2]Fig. 8 illustrates the comparison and relationships among 3 exposure groups using 4 classifiers. For all group of exposure, BP is always the highest while DFA failed to achieve 100% classification accuracy. BP gives 100% classification accuracy rate for all groups. LR and kNN only give 100% classification accuracy rate for the real exposure group (LE and RE). This implies the vector features for LE and RE dataset are more distinguishable than the control group. It is easier to classify real exposure group rather than no exposure group because of 2 classifiers give 100% accuracy for LE and RE.
Fig. 8 Group comparison for classification techniques
IV. CONCLUSION
[image:5.612.69.266.468.602.2]International Journal of Emerging Technology and Advanced Engineering
Website: www.ijetae.com (ISSN 2250-2459,ISO 9001:2008 Certified Journal, Volume 3, Issue 10, October 2013)
31
In future, the research can be extended for observation of radiation effects from few mobile phones and the influence to human brainwave signals and also to the nerve functions. The experiment in future also will include other hemisphere temporal lobes for more interesting and unique findings.Acknowledgement
The authors would like to thank staff and students from Universiti Teknologi MARA, Malaysia who have involved in this study and also to Research Management Institute UiTM and the government of Malaysia. This research is supported by the Fundamental Research Grant Scheme (FRGS), Ministry of Higher Education, Malaysia (project number 600-RMI/ST/FRGS5/3/Fst (33/2011).
REFERENCES
[1] Ahlbom A, Green A, Kheifets L et al. Epidemiology of health effects of radiofrequency exposure. Environmental Health Perspectives 2004; 112: 1741.
[2] Nikolaeva EY, Nikolaev DY, Shoshiashvili L, Zaridze R. Analysis of Thermal Effects in Human Exposed To EM Radiation (2d Case). DIPED; 2004; 2004. p. 90-3.
[3] Chiabrera A, Hinsenkamp M, Pilla A et al. Cytofluorometry of Electromagnetically Controlled Cell Dedifferentiation. Journal of Histochemistry & Cytochemistry 1979; 27: 375-81.
[4] Blackman C. Cell Phone Radiation: Evidence From ELF and RF Studies Supporting More inclusive risk identification and assessment. Pathophysiology : the official journal of the International Society for Pathophysiology / ISP 2009; 16: 205-16. [5] Wu K, Sajad A, Omar SAA, MacKay W. The effect of high
frequency radio waves on human brain activity: an EEG study. Journal of Undergraduate Life Sciences 2009; 3: 50-2.
[6] Lias K, Teen AHW, Mat DAA et al. Biological Effect of 900MHz and 1800MHz Mobile Phones in SAR Weight. International Conference on Information and Multimedia Technology; 2009; 2009. p. 422-5.
[7] Stefanics G, Thuroczy G, Kellenyi L, Hernadi I. Effects of twenty-minute 3G mobile phone irradiation on event related potential components and early gamma synchronization in auditory oddball paradigm. Neuroscience 2008; 157: 453-62.
[8] Kivekas O, Ollikainen J, Lehtiniemi T, Vainikainen P. Bandwidth, SAR, and Efficiency of Internal Mobile Phone Antennas. IEEE Transactions on Electromagnetic Compatibility 2004; 46: 71-86. [9] Isa RM, Pasya I, Taib MN. High Frequency Brainwaves Comparison
Due to Mobile Phone Radiofrequency Emission. Intelligent Systems, Modelling and Simulation (ISMS), 2012 Third International Conference on; 2012 8-10 Feb. 2012; 2012. p. 191-6.
[10] Suresh Kanna JH. Quantitative EEG Parameters for Monitoring and Biofeedback During Rehabilitation After Stroke. International Conference on Advanced Intelligent Mechatronics 2009: 1689-94. [11] Isa RM, Pasya I, Taib MN et al. Assessment of Brainwave
Asymmetry and Hemisphere Dominance Due to RF Radiation. Computer Modeling and Simulation (EMS), 2012 Sixth UKSim/AMSS European Symposium on; 2012: IEEE; 2012. p. 153-7.
[12] Khan M, Ding Q, Perrizo W. k-nearest neighbor classification on spatial data streams using P-trees: Springer Berlin Heidelberg 2002. [13] Gardner JW, Bartlett PN. A brief history of electronic noses. Sensors
and Actuators B: Chemical 1994; 18: 210-1.
[14] Di Natale C, Macagnano A, Paolesse R et al. Electronic nose and sensorial analysis: comparison of performances in selected cases. Sensors and Actuators B: Chemical 1998; 50: 246-52.
[15] Searle GE, Gardner JW, Chappell MJ et al. System Identification of Electronic Nose Data From Cyanobacteria Experiments. IEEE Sensors Journal 2002; 2: 218-29.
[16] Kaczmarczyk K, Wit A, Krawczyk M, Zaborski J. Gait classification in post-stroke patients using artificial neural networks. Gait & posture 2009; 30: 207-10.
[17] Subasi A, Erçelebi E. Classification of EEG signals using neural network and logistic regression. Computer Methods and Programs in Biomedicine 2005; 78: 87-99.
[18] Jayalakshmi T, Santhakumaran A. Statistical normalization and back propagation for classification. International Journal of Computer Theory and Engineering 2011; 3: 1793-8201.
[19] Murat ZH, Kadir RSSA, Isa RM et al. Observation of Human Brainwave Signals Due to Mobile Phone Usage. International Journal of Simulation Systems, Science & Technology 2011; 12: 22-8.
[20] Murat ZH, AbdulKadir RSS, Isa RM, Taib MN. The Effects of Mobile Phone Usage on Human Brainwave Using EEG. Computer Modelling and Simulation (UKSim), 2011 UkSim 13th International Conference on; 2011: IEEE; 2011. p. 36-41.
[21] Anbeek P, Vincken KL, van Osch MJ et al. Probabilistic segmentation of white matter lesions in MR imaging. NeuroImage 2004; 21: 1037-44.
[22] Lin JC, Relova JL, Pertega S et al. Effects of Cell-Phone Radiation on the Electroencephalographic Spectra of Epileptic Patients. IEEE Antennas and Propagation Magazine 2010; 52: 173-9.
[23] Huber R, Treyer V, Borbe AA et al. Electromagnetic Fields, Such as Those From Mobile Phones, Alter Regional Cerebral Blood Flow in Sleep and Waking EEG. Journal European Sleep Research 2002; 11: 289-95.