Q u a n tific a tio n of d y s p n o e a u si n g
d e s c ri p t o r s : d e v el o p m e n t a n d
ini ti al t e s ti n g of t h e Dy s p n o e a-1 2
York e , J, M o o s a vi, S H , S h ul d h a m , C a n d Jo n e s , P W
h t t p :// dx. d oi.o r g / 1 0 . 1 1 3 6 / t h x. 2 0 0 9 . 1 1 8 5 2 1
T i t l e Q u a n tific a ti o n of d y s p n o e a u s i n g d e s c ri p t o r s : d e v el o p m e n t a n d i ni ti al t e s ti n g of t h e Dy s p n o e a-1 2
A u t h o r s York e, J, M o o s a vi, S H , S h u l d h a m , C a n d Jo n e s , P W
Typ e Ar ticl e
U RL T hi s v e r si o n is a v ail a bl e a t :
h t t p :// u sir. s alfo r d . a c . u k /i d/ e p ri n t/ 3 0 9 8 /
P u b l i s h e d D a t e 2 0 1 0
U S IR is a d i gi t al c oll e c ti o n of t h e r e s e a r c h o u t p u t of t h e U n iv e r si ty of S alfo r d . W h e r e c o p y ri g h t p e r m i t s , f ull t e x t m a t e r i al h el d i n t h e r e p o si t o r y is m a d e f r e ely a v ail a bl e o nli n e a n d c a n b e r e a d , d o w nl o a d e d a n d c o pi e d fo r n o
n-c o m m e r n-ci al p r iv a t e s t u d y o r r e s e a r n-c h p u r p o s e s . Pl e a s e n-c h e n-c k t h e m a n u s n-c ri p t fo r a n y f u r t h e r c o p y ri g h t r e s t r i c ti o n s .
1
Online Supplement
Quantification of dyspnoea using descriptors: Development and initial testing of the Dyspnoea-12
Janelle Yorke, Shakeeb Moosavi, Caroline Shuldham, Paul Jones
Rasch analysis
Tests of individual item fit
Item fit was assessed by examining the residual and Chi-squared fit statistic for each item. The item residual is a summation of the difference between the observed score and the score expected by the model for a particular item and persons. Item residuals between ±2.5 indicate adequate fit to the model. The Chi-square (X2) compares the difference between the observed values with values expected by the model across different dyspnoea severity groups for each item. Severity groups, called Class Intervals, are defined by ordering all patients in terms of dyspnoea severity (determined by the responses to all items combined) and then splitting them into groups of approximately equivalent size across the sample (this is done automatically within RUMM2020). A non-significant item Chi-square (p>0.05) indicates good fit to the model. Item fit is also assessed graphically using the item characteristic curve (e-supplement figures 1 and 2).
Differential item functioning
E-supplement figure 1: Item Characteristic Currve for a well-fitting item (‘My breathing is exhausting’). The ‘y’ axis represents the item severity and the ‘x’ axis represents patient severity in logits. The curved line represents the expected scores for the item, and the dots represent the observed scores for the Class Intervals at the different severity levels. The fit residual (written along the top) is 0.140 and Chi-square probability is 0.672, indicating no significant deviation between the expected and observed scores for this item. This item was retained.
E-supplement figure 2: Item Characteristic Curve for the item ‘My breathing is hard work’. The fit residual for this item was a high negative value (-3.524) with a
significant chi-square (p = 0.001). This means that the item is over-discriminating - the observed scores (black dots) form a steeper curve than the expected scores (the curve). This item was removed.
E-supplement figure 3: Example of an item – ‘I am fighting for breath’ demonstrating gender associated uniform DIF. It can be seen that the female group (o line) is consistently below the male group (x line). This means that for any level of overall breathlessness severity, females had a lower (i.e. less severe) response to this particular item (p<0.05). This item was removed.
E-supplement figure 4: Example of an item - ‘My breathing is laboured’
demonstrating diagnostic related non-uniform DIF. It can be seen that there is no organised pattern to the probability of the different disease groups affirming this item for any Class Interval level (p<0.05). This item was removed.
6
E-supplement table 1: Details of the initial 81 items and reasons for exclusion (* denotes retained item and X denotes item removed for the reason indicated for that column)
Items Hierarchical Rasch analysis
>50% responded
‘none’
Age (p<0.05)
Fit statistics Differential item bias (p<0.05) Residual ±2.5 Chi-square (p<0.05) Gender Diagnosis
Uni Non-u
Uni Non-u
1. My breathing is irritating*
2. I feel as if I am drowning X
3. I feel out of breath X
4. I feel as if I am choking X 5. My breathing makes me feel
dizzy
X
6. I feel a raw sensation in my chest
X
7. My breathing makes me panic
X X X
8. I feel as if something is stuck in my airway
X
9. My chest feels tight X X
10. I have a tight throat X
11. I feel weighted down X
12. My breath does not go in all way *
13. My breathing requires more work *
14. My breathing is hard work X X
15. My breathing is rapid X 16. My breathing makes me feel
restless
X X X
17. My voice feels tight X
18. I feel like I am smothering X 19. My breathing makes me feel
lonely
X
20. I feel a hunger for more air X X X
21. My breathing is alarming X 22. My breathing makes me feel
lightheaded
X
23. I cannot get enough air * 24. My breath does not go out all the way
X
25. I have a feeling of impending death
X
26. My breathing is exhausting *
7
fearful
28. I feel I need to breathe
X
29. I have difficulty catching my breath *
30. My breathing requires more concentration
X
31. I feel my breath stops X 32. I feel that I am breathing bad
air
X
33. My breathing is tiring X
34. I cannot take a deep breath X
35. I cannot breath fast enough X 36. My breathing makes my
chest ache
X
37. I cannot breath out fast enough
X
38. My breathing is frightening X 39. My breathing is horrible X 40. My breathing makes me feel
scared
X
41. My breathing makes me feel like I have an itchy throat
X
42. I feel short of breath * 43. My breathing feels uncomfortable *
44. My breathing makes me feel puffed
X X
45. My breathing is shallow X X
46. I feel like I am suffocating X
47. My breath is heavy X
48. My breathing is cruel X
49. I have chest pain X
50. My breathing is too deep X 51. My breathing requires more
effort
X
52. My breathing makes me feel agitated *
53. My breathing is annoying X
54. My breathing makes me feel claustrophobic
X
55. My breathing makes me feel helplessness
X
56. The air does not taste right X 57. My breathing makes me feel
terrified
X
58. I cannot control my breathing X 59. My breathing makes me feel
anger
X
60. I feel like my airway has become narrower
X
8
62. I feel that I am breathing more
X X
63. My breathing makes me feel guilty
X
64. My breathing makes me feel frustrated
X X
65. I feel wheezy X X X
66. I cannot breath enough X 67. I feel winded in my chest X
68. I am gasping for breath
X
69. My breathing feels terrible X 70. My breathing is distressing *
71. My breathing is laboured X X
72. I am aware of my breathing X
73. My breathing is unbearable X 74. I feel I need to sigh X 75. I feel as if I am panting X 76. My breathing is awful X 77. My chest feels constricted X
78. I feel I am fighting for breath
X
79. My breathing makes me feel depressed *
80. My breathing makes me feel miserable *
81. I feel desperate for breath
X
Uni: Uniform differential item functioning
9
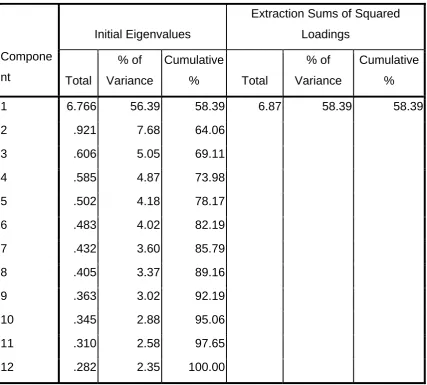
Table 2: Initial non-rotated PCA solution
Prior to performing PCA, suitability of the data to factor analysis was assessed. The Kaiser-Meyer-Oklin value was 0.95 (exceeding the recommended value of 0.6) and Bartlett’s test reached statistical significance (p<0.001), supporting the suitability of the data to a PCA.
Initial Eigenvalues
Extraction Sums of Squared
Loadings
Compone
nt Total
% of
Variance
Cumulative
% Total
% of
Variance
Cumulative
%
1 6.766 56.39 58.39 6.87 58.39 58.39
2 .921 7.68 64.06
3 .606 5.05 69.11
4 .585 4.87 73.98
5 .502 4.18 78.17
6 .483 4.02 82.19
7 .432 3.60 85.79
8 .405 3.37 89.16
9 .363 3.02 92.19
10 .345 2.88 95.06
11 .310 2.58 97.65
12 .282 2.35 100.00