6268
SOCIAL DAMAGE COST ESTIMATION MODEL FOR
MOBILE DIGITAL DIVIDE
1GYOO GUN LIM, 2JOONGHO SEOL
1 Professor, School of Business, Hanyang University, Seoul, Korea
2Graduate Student, School of Business, Hanyang University, Seoul, Korea, corresponding author
E-mail: 1 [email protected], 2[email protected]
ABSTRACT
The previous studies on the digital divide mainly consisted of comparative studies among groups according to education, age, occupation, and region. However, the digital divide is expected to vary depending on the individual situation. Therefore, this study suggests a model that calculates social damage cost of mobile divide at individual level based on individual cognitive value. According to this model, we conduct empirical verification by social damage types. For the empirical analysis of this study, 800 questionnaire data were collected. Based on the collected data, the cost of social damage caused by the individual mobile digital divide per person was estimated to be about 120,000 KRW, and the social cost of about 5.6 trillion KRW was calculated as a result of applying it to the population of South Korea. In the detailed analysis, males felt more harm than females, and people in their 40s or older felt more vulnerable than those in their 30s or less. Also, non-metropolitan area residents felt more damage than metropolitan area residents. In addition, the results of social damage analysis showed that the mobile digital divide was more significant in social participation activities, family issues and interpersonal relationships, and medical services. The results of this study are expected to contribute to the study of mobile digital divide and to the development of meaningful policies.
Keywords: Mobile Digital Divide; Digital Divide; Mobile Divide; Social Damage Cost; Cost Estimation
1. INTRODUCTION
The development of information and communication technologies (ICT) and the emergence of smartphones provide an environment where people can exchange information anytime, anywhere. As a result, both the amount and quality of information exchanged by people have improved significantly. According to a survey by Ministry of Science, ICT and Future Planning of Korea, the penetration rate of smartphones in Korea is 85% of the population aged 6 and over, and the Internet connection rate reaches 99.2%. However, despite the global ICT infrastructure, various types of digital divide are still emerging. According to National Information Agency (NIA)'s 2015 Information Divide Survey in Korea, the PC - based informatization level among the general public was 77.4% for elderly people, 83.5% for farmers and fishermen, 86.2% for disabled people, 87.7% for low-income people and 87.8% for married immigrants. In addition, the level of smart informatization is 55.2% for farmers, 56.3% for elderly people, 62.5% for disabled people, 68.5% for North Korean defectors, 73.1% for married immigrants and 74.5% for low-income people [17].
6269 the digital divide [14]. In section two, we review the concept of digital divide, mobile divide, and social damage caused by digital divide. Section three describes the research procedures and methods, Section four discusses the results of the research, and section five concludes with some remarks.
2. LITERATURE REVIEW 2.1 Concept of digital divide
The concept of the digital divide was defined through several previous studies. The digital divide was first raised by scholars who viewed the information society with skeptical viewpoints, and they predicted that the digital divide between the social classes would be widened due to informatization [1]. The digital divide at the time of the emergence of the term "digital divide", it was interpreted as it arises from the difference in adoption of information technology, depending on socioeconomic differences, personal tendencies, and communication styles, focusing on differences in information accessibility among social groups [16]. In terms of the accessibility of the digital divide, Yoo(2002) pointed out that the digital divide is generally a result of unequal opportunities for accessing to information and communication equipment [22]. This means the opportunity to access the information communication device itself, which is the most front stage in the various information activities such as information production, distribution and use, is unequal. In sum, the digital divide can be defined as the gap between the groups that can access ICT and the groups that do not.
The problem of information gaps is also becoming an important issue for developed countries and international organizations. OECD (2001) defined it as the differences between individuals, households, enterprises and regions due to different socio-economic conditions in 'Understanding the digital divide' [18]. The U.S Chamber of Commerce defined it as the gap between the groups that access technology through telephone, computer, and the Internet [2]. Korea also enacted the 'Information Dispute Resolution Act' in 2001 and defined the digital divide as the difference in the opportunities to access or use information and communication services through information and communication networks due to economic, regional, physical, or social conditions.
The digital divide has begun to expand with the development of information and communication technologies and the emergence of mobile devices
and smart devices. The recent digital divide problem has begun to be studied not only in terms of accessibility but also in terms of usability. The digital divide nowadays is a concept involving quantitative and qualitative gaps, includes the process of utilizing information gained from accessing and creating added value [20]. The research on digital divide mainly focused on the accessibility of information, and there have been various policy efforts to reduce the digital divide by solving information accessibility. Recently, in order to emphasize the qualitative aspect of information utilization, attention is paid not only to accessibility but also to utilization of information [8].
In addition, the digital divide is mainly caused by demographic factors, especially by gender, age, education level, income, race, region, etc. [6]. There is also research that the introduction of information and communication technology has intensified income and information inequality further. The income of higher educated people who are engaged in information-related industry has increased due to the informationization, while the income of low educated people who are engaged in simple labor occupation has decreased [1].
2.2 Mobile Divide
6270 excluded from the society. Groups that fail to reduce unnecessary transaction costs through mobile devices may completely lose the opportunity to rise in status [11]. This is because new information communication devices such as smart phones and tablets are used firstly for those who have already used information devices and acquire information and knowledge. Therefore, before the digital divide is overcome, new information divide can be created again [7].
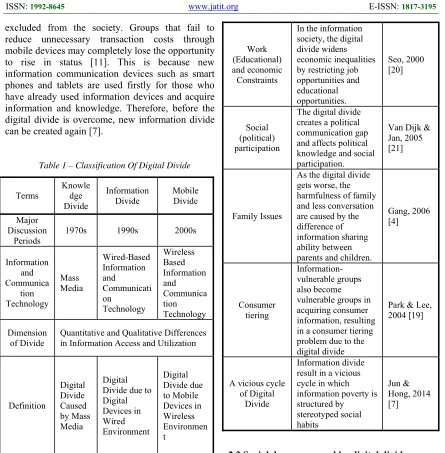
Table 1 – Classification Of Digital Divide
Terms Knowle dge Divide Information Divide Mobile Divide Major Discussion Periods
1970s 1990s 2000s
Information and Communica tion Technology Mass Media Wired-Based Information and Communicati on Technology Wireless Based Information and Communica tion Technology Dimension of Divide
Quantitative and Qualitative Differences in Information Access and Utilization
Definition Digital Divide Caused by Mass Media Digital Divide due to Digital Devices in Wired Environment Digital Divide due to Mobile Devices in Wireless Environmen t
Lee & Lee (2014) [9]
[image:3.612.86.303.242.534.2]In other words, it was expected that the spread of smart devices would alleviate the digital divide, but the digital divide became more intense in terms of information utilization and a new problem of a vicious cycle of digital divide also occurred. In terms of usability, the research on the digital divide problem will be needed not only by group comparison but also by interpersonal comparisons, so we will examine the mobile divide at the individual level.
Table 2 – Social Damage By Digital Divide
Social Damage Contents Reference
Work (Educational) and economic Constraints
In the information society, the digital divide widens economic inequalities by restricting job opportunities and educational opportunities. Seo, 2000 [20] Social (political) participation
The digital divide creates a political communication gap and affects political knowledge and social participation.
Van Dijk & Jan, 2005 [21]
Family Issues
As the digital divide gets worse, the harmfulness of family and less conversation are caused by the difference of information sharing ability between parents and children.
Gang, 2006 [4] Consumer tiering Information-vulnerable groups also become vulnerable groups in acquiring consumer information, resulting in a consumer tiering problem due to the digital divide
Park & Lee, 2004 [19]
A vicious cycle of Digital
Divide
Information divide result in a vicious cycle in which information poverty is structured by stereotyped social habits Jun & Hong, 2014 [7]
6271 between parents and children, family harmony is impeded and less conversation can occur [4]. A consumer group may become a vulnerable group and the problem of consumer stratification by the digital divide may occur [19]. In addition, there is a vicious cycle caused by the digital divide. The information divide leads to a vicious cycle in which information poverty is structured by the deepening of the poor people's life due to stereotyped social habits such as economic condition, education, and occupation [7].
[image:4.612.97.293.323.703.2]Like the results of previous studies, the digital divide causes various social problems such as social, economic, political, and family problems. Therefore, this study estimates the cost of social damage according to the digital divide by classifying the types of social damages of individuals using mobile devices.
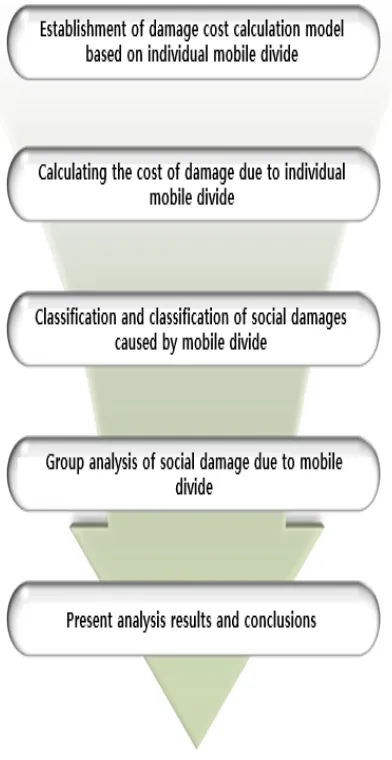
Figure 1 – Research Process
3. RESEARCH METHOD
3.1 Research procedure and social damage cost estimation model
The goal of this study can be classified into two stages: estimation of social damage cost due to mobile information gap and derivation of damage degree by social damage type due to mobile information gap. The study procedure is shown in Figure 1.
6272
Figure 2 – Social Damage Cost Estimation Equation
Next, the degree of damage according to the types of social damage due to mobile divide is derived. Based on the previous studies, the types of social damage from the mobile divide are divided into five categories: work (education) and economic activities, social participation activities (politics, economics, issues), cultural life and consumption activities, family issues and interpersonal relationships, and medical services. In order to derive the degree of damage individuals perceive for each type, an independent sample t-test is conducted by classifying the mobile divide into groups based on the damage cost calculated in the previous step to check the difference between the group experiencing digital divide and those not experiencing it.
3.2 Data collection
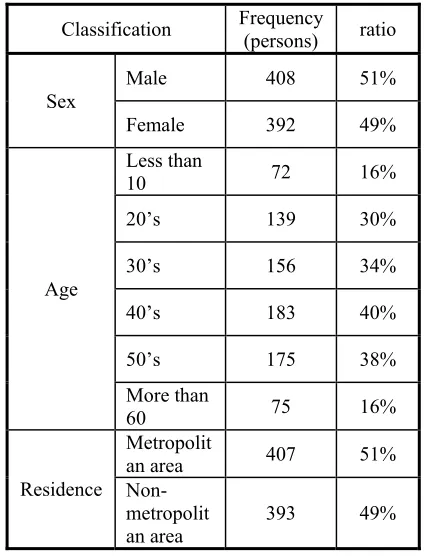
The purpose of this study is to calculate the social damage cost according to the mobile divide and the degree of damage according to the types of social damage due to the mobile divide at the individual level. For this purpose, the survey was conducted through Embrain, a specialized research company. A total of 800 data were collected. The sample of collected data was 408 (51%) male and 392 (49%) female. According to the age group, 16% was under 10, 30s was 34%, 40s was 40%, 50s was 38%, and more that 60s was 16%. By region, the metropolitan areas (Seoul, Gyeonggi, and Incheon) accounted for 51%.
[image:5.612.308.520.403.681.2]Based on the collected data, we try to figure out the degree of social damage perceived by the individuals classified by the type of social damage and calculate the social cost according to the mobile divide at the individual level. In addition, we divide this into sex, age, and region, and calculate the social cost according to the mobile divide of each group.
Table 3 – Statistics Of The Sample
Classification Frequency (persons) ratio
Sex
Male 408 51%
Female 392 49%
Age
Less than
10 72 16%
20’s 139 30%
30’s 156 34%
40’s 183 40%
50’s 175 38%
More than
60 75 16%
Residence
Metropolit
an area 407 51%
Non-metropolit
6273 4. ANALYSIS AND RESULTS
4.1 Calculating social damage costs
The collected data was reflected in the model of this study, and the cost of social damage due to the mobile divide at the individual level was calculated. According to the analysis, 398 out of 800 respondents felt the gap between mobile devices (mobile phones, tablet PCs, notebooks) and wireless communication rates.
First, the damage cost due to the mobile divide for one person was calculated like the following example equation (Formula 1).
P1 = {(1,000,000 – 700,000) x 0.8} + {(700,000 – 450,000) x 0.7} + {(2,000,000 – 1,500,000) x 0.9} + {(46,200 – 39,600) x 0.8}
Next, to calculate the average individual damage cost due to the mobile divide from all survey respondents, the costs of each respondent were summed, and then the value was divided by the total number of survey respondents, 800 (Formula 4).
Sample Cost = (870,280 + … + 58,145) / 800 (Formula 4)
As a result of calculating the average damage cost for all survey respondents, the amount of 118,550(KRW) was calculated. The social damage cost can be calculated by multiplying the average cost of damage by the total number of people in Korea except 0 ~ 9 years. Finally, the cost of social damage due to the mobile divide was derived as shown in (Formula 5).
Total Cost = 118,550 * 47,223,185 (Formula 5)
As a result, the damage cost according to the mobile information gap at the individual level of Korea was calculated as 5,598,312,005,431(KRW).
Next, we calculated the difference of the damage cost of the information gap between age, gender, and region. First, to calculate the cost of damages caused by the mobile divide according to gender, it
was classified into two groups, male and female, and the damage cost according to the mobile divide was calculated and the difference between the two groups was confirmed. As a result, the average cost of male respondents was 133,710(KRW). The total male damage cost can be calculated by multiplying the calculated cost by the total number of men in Korea as shown in (Formula 6).
Total Cost = 133,710 * 23,523,048 (Formula 6)
As a result, the damage cost due to the mobile divide of male was 3,145,272,340,569(KRW). Likely, the average cost of female individual respondents was 102,771(KRW). The calculated cost is multiplied by the total number of female users in Korea as shown in (Formula 7).
Total Cost = 102,771 * 23,700,137 (Formula 7)
As a result, the damage cost due to the female mobile divide was 2,435,689,742,144(KRW). The difference between males and females is 709,582,598,425(KRW), which means that males are more likely to suffer from the mobile divide than female.
Table 4 – Cost Of Damage Due To Sex (KRW)
Classification
Average cost of survey respondents
Total cost
Male 133,710 3,145,272,340,569
Female 102,771 2,435,689,742,144
6274 Total Cost = 132,798 * 19,623,121 (Formula 8)
As a result, the damage cost due to the mobile divide of 30 or less was 2,605,913,093,973(KRW). Next, the average cost for individual respondents in their 40s or older was 106,473(KRW). The cost was calculated by multiplying the calculated cost by the total number of the available population over 40s as shown in (Formula 9).
Total Cost = 106,473 * 27,600,064 (Formula 9)
As a result, the damage cost due to the mobile
divide of groups over 40 was
2,938,683,796,310(KRW).
The difference between the two groups was 332,770,702,337(KRW), which means that more than 40 years old people feel the mobile divide more than those in their 30s or less.
Table 5 – Cost Of Damage Due To Age (KRW)
Classification
Average cost of survey respondents
Total cost
Less than 30 132,798 2,605,913,093,973
More than 40 106,473 2,938,683,796,310
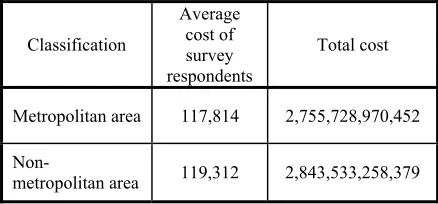
Next, we calculated the cost of damages caused by the mobile divide between the metropolitan area and the non-metropolitan area, and then confirmed the difference between the metropolitan area and the non-metropolitan area. As a result, the average cost of survey respondents in the metropolitan area was 117,814(KRW). The cost was calculated by multiplying the calculated cost by the total number of the available population in the metropolitan area as shown in (Formula 10).
Total Cost = 117,814 * 23,390,470 (Formula 10)
As a result, the damage cost due to the mobile divide in the metropolitan area was 2,755,728,970,452(KRW).
Next, the average cost of individual survey respondents in the non-metropolitan area was 119,312(KRW). The calculated cost was multiplied by the total number of the population in the non-metropolitan area, as shown in (Formula 11).
Total Cost = 119,312 * 23,832,715 (Formula 11)
As a result, the damage cost due to the mobile divide in the non-metropolitan area was 2,843,533,258,379(KRW).
[image:7.612.307.526.279.381.2]The difference between the two calculated amounts is 87,804,287,927(KRW), which means that people living in the non-metropolitan area feel more the mobile divide than people living in the metropolitan area.
Table 6 – Cost Of Damage Due To Region (KRW)
Classification
Average cost of survey respondents
Total cost
Metropolitan area 117,814 2,755,728,970,452
Non-metropolitan area 119,312 2,843,533,258,379
4.2 Degree of damage by types of social damage
The second objective of this study is to perform the independent sample t-test to check the degree of damage according to the types of social damage caused by the individual mobile divide.
First, in order to conduct the independent sample t-test, we divided the groups into two groups: those who feel that there is the mobile divide and those who do not. As a result of classification, 398 respondents felt that there was the mobile divide among a total of 800 questionnaires, and 402 persons who did not feel the mobile divide.
Table 7 – Mobile Divide Group Classification
Classification Frequency (persons) ratio
Mobile Divide(Yes) 398 50%
Mobile Divide(No) 402 50%
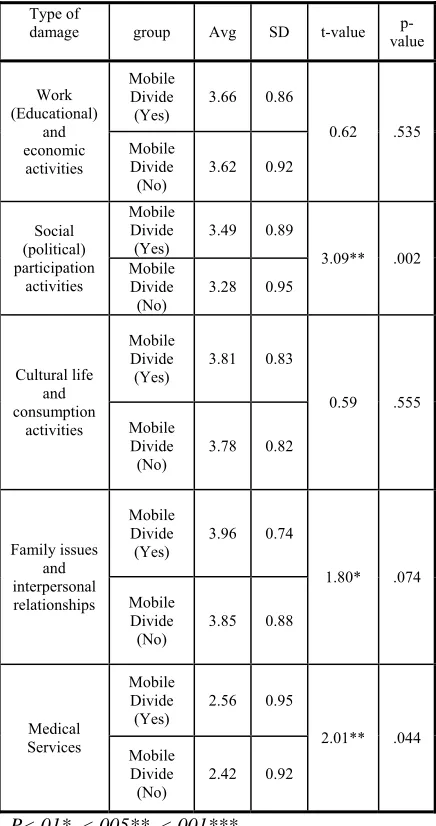
6275 participation activities, family issues and interpersonal relationships, and medical services. The t-value of the social participation activity was 3.09 (p-value is 0.002), and the t-value of the family issues and interpersonal relationship was 1.80 (p-value is 0.74). Finally, the t-(p-value of medical service was 2.01 (p-value is 0.44). In other words, the group with mobile divide felt to be more vulnerable to social participation activities, family issues and interpersonal relationships, and medical services due to the mobile divide than those who without mobile divide. However, there was no significant difference between the two groups in the work (education) and economic activities with 0.535 p-value and cultural life and consumption activities with 0.555 p-value.
Table 8 – Independent Sample T-Test Results By Type Of Social Damage
Type of
damage group Avg SD t-value value
p-Work (Educational)
and economic
activities
Mobile Divide (Yes)
3.66 0.86
0.62 .535 Mobile
Divide (No)
3.62 0.92
Social (political) participation
activities
Mobile Divide (Yes)
3.49 0.89
3.09** .002 Mobile
Divide (No)
3.28 0.95
Cultural life and consumption
activities
Mobile Divide (Yes)
3.81 0.83
0.59 .555 Mobile
Divide (No)
3.78 0.82
Family issues and interpersonal relationships
Mobile Divide (Yes)
3.96 0.74
1.80* .074 Mobile
Divide (No)
3.85 0.88
Medical Services
Mobile Divide
(Yes) 2.56 0.95
2.01** .044 Mobile
Divide
(No) 2.42 0.92
P<.01*, <.005**, <.001***
5. CONCLUDING REMARKS
This study suggested a social damage cost estimation model according to the mobile divide in the individual level and analyzed its calculation. The results of this study are summarized as follows. First, we calculated the social damage cost due to the mobile divide at the individual level. As a result of the analysis, the average value of social damage cost according to the mobile divide for a person was calculated as 118,550(KRW), and the total social damage cost for the total available population in Korea was calculated as 5,598,312,005,431(KRW). We also calculated the social cost due to the information gap between groups by gender, age, and region. As a result, the average divide value of a male was calculated as 133,710(KRW), and the total social damage cost of all males in Korea was 3,145,272,340,569(KRW). The average divide value of a female was calculated as 102,771(KRW), and the social damage cost for all females in Korea was calculated as 2,435,689,742,144(KRW). The difference between men and women was 709,582,598,425(KRW). This shows that men are more sensitive to ICT and ICT technology and need more advanced information and communication devices and more data capacity than women. Next, as a result of classification by age groups, the average divide value in their 30s or less was 132,798(KRW), and the total social damage cost
under 30 years in Korea was
6276 mobile divide than those living in the metropolitan area. This implies that the ICT infrastructure in Korea is mainly concentrated in the metropolitan area, and the mobile divide is felt to be large due to the lack of infrastructure in local small towns and rural areas.
Next, in order to analyze the degree of damage caused by mobile divide, we classified the groups according to the mobile divide types and conducted an independent sample t-test. As a result of the analysis, it was found that the people who feel the mobile divide more suffered from social participation activities, family issues and interpersonal relationships, and medical services than those who did not.
Through this study, it was possible to estimate the level of the cost to solve the social damages caused by the mobile divide, and the types of the user who is suffering from the mobile device. First, it can be understood that the cost for solving the social damage due to the mobile divide, which is perceived by the individual, is about 120,000 KRW per person in Korea. Also, it can be seen that a cost of about 5.6 trillion KRW is needed to solve the mobile divide for the whole nation. In the meantime, the direction of the government policy to solve the digital divide tended to concentrate mainly on the socially weak class, but the general people like the result of this study also felt various damage in everyday life due to the digital divide. In particular, many people feel that they seems to be alienated from the digital divide because they feel that they are suffering from social participation activities, family issues and interpersonal relationships that require communication technologies with people. In addition, since the aging society is accelerating, the interest in health and healthcare services are rapidly increasing. So appropriate government policies are needed. As a result of this study, it seems that a huge budget is needed to solve the mobile divide. Sometimes it need the time lag between the investment and its outcome [12]. Therefore, it is necessary to establish a policy considering broad supports and solutions for communication and medical services in accordance with the aging society. In the advancing smart society, it is needed to make a proper policy approach not only for the social underprivileged but also for the general public so as not to lag behind the access and utilization of information.
ACKNOWLEDGEMENT
This work is supported by Barun ICT Research Center at Yonsei University in 2016. This work was partially supported by the research fund of Hanyang University(HY-2016). The earlier versions of this study was presented in some conferences [13, 14, 15]
REFERENCES
[1] Castells, Manuel. The informational city: Information technology, economic restructuring, and the urban-regional process. Oxford: Blackwell, 1989.
[2] Choi, H.R., and I. Yu, "Digital divide research trend analysis and future research direction," Internet e-Commerce Research, Vol. 8, No. 1, 2008, pp. 255-278.
[3] Choi, Y.J., H.J. Yun, and J.J. Lee, " Developing Indices for Smartphone Usage: Smartphone Technology Quotient," Entrue Journal of Information Technology, Vol. 12, No. 3, 2013, pp. 87-104.
[4] Gang, H.R., "Strategic resource of informationization experience and knowledge," KISDI Issue Report, KISDI, 2006. [5] Gang, W.S., M.S. Kim, and J.U. Ko, “Effects
of the Smartphone Information Use and Performance on Life Satisfaction among the
Elderly,” Journal of the Korean
Gerontological Society, Vol.33, No.1, 2013, pp. 199-214.
[6] Hoffman, Donna L., and Thomas P. Novak, "Bridging the racial divide on the Internet." Science, Vol. 280, No. 5362, 1998, pp. 390-391.
[7] Jun, Woochun, and Suk-Ki Hong, "A study on improvement plan of web accessibility for the disabled," Journal of the Internet Information Science Society, Vol. 15, No. 4, 2014, pp. 81-89.
[8] Lee, M.J., and G.T. Park, "The Issue Change of Digital Divide Studies and Its Implication," Informatization policy, Vol. 16, No. 3, 2009, pp. 3-17.
6277 [10]Lee, Seungmin, "Analysis of the Effects of
Smart Devices on Digital Divide in America," Korean Library and Information Science Society, Vol. 43, No. 2, 2012, pp. 29-52.
[11]Lee, W.T., "Conceptualizations and Policy Directions of ‘Patcipation Divide' bewteen Smart Mobile Media Users," The 21st Century Political Science Association, Vol. 23, No. 2, 2013, pp. 371-395.
[12]Lim G.G., D. C. Lee, E. C. Robert, “A Comparative Study on The Time Lag Effect of Investments in Innovative Information Systems”, Journal of Theoretical and Applied Information Technology, Vol. 77, No. 3, 2015, pp. 328-341.
[13]Lim G.G. and D.S Yeo. (2017). “A Study on the Social Damage from Individual Mobile Digital Divide”, 2017 ICSSH, (Forthcomming). [14]Lim, G.G., D.S. Yeo, and J.H. Seol, “A Study
on Measuring the Cost of Social Damage to Individual Mobile Divide”, Spring Conference on KMIS, 2017, pp. 395-396.
[15]Lim, G.G. and J.H. Seol, “A Study on Social Damage Cost Estimation Model for Mobile Information Divide Based on Individual Recognized Value”, KMIS summer conference, 2017.
[16]Loader, Brian, ed., Cyberspace divide: equality, agency, and policy in the information society. Psychology Press, 1998.
[17]NIA, 2015 Digital Divide Survey. NIA, 2016 [18]OECD, “Understanding the Digital Divide,”
OECD Digital Economy Papers, OECD Paris, Vol. 49, 2001.
[19]Park, M.H., and S.L. Lee, "Qualitative Analysis on Digital Divide between Parents and Children and its Consequences on Communication, Conflict, and Consumer Socialization," Family and Environment Research, Vol. 42, No. 5, 2004, pp. 11-25. [20]Seo, E.J., "Structuring of digital divide and
social problem," Information and Society, Vol. 2, 2000, pp. 68-87.
[21]Van Dijk, Jan AGM, The deepening divide: Inequality in the information society, Sage Publications, 2005