ORIGINAL RESEARCH ARTICLE
SCREENING DIABETIC RETINOPATHY USING STATISTICAL METHODS
*Koushik Bhattacharyya
Assistant Professor, Computer Science and Engineering, Dream Institute of Technology, Kolkata, India
ARTICLE INFO ABSTRACT
An analysis has been made to the recent digital image processing algorithms in diabetic retinopathy. Diabetic Retinopathy is the common cause of blindness and vision defects in the developing countries. Several algorithms have been developed to pre-process the retinal image and defect the hard exudates in the retinal image. Different digital image processing techniques such as digital image enhancement digital image filter, digital image segmentation, morphology techniques, colour processing, image classification, etc. have been used in diabetic retinopathy. Several fully automatic image processing algorithms have been envolved to diagnose the diabetic retinopathy digital images. A classification of retinal images based on statistical algorithm has proposed. The experimental results show that the proposed algorithm classifies the retinal images with minimum error and faster compared to other existing algorithms.
Copyright © 2018, Koushik Bhattacharyya. This is an open access article distributed under the Creative Commons Attribution License, which permits unrestricted use, distribution, and reproduction in any medium, provided the original work is properly cited.
INTRODUCTION
The population of diabetic patients has been increasing against the total world population. Uncontrolled and prolonged diabetes can damage the microvasculature of the vital organs of the body such as eyes and kidneys. The damage caused to the tiny blood vessels in the retina of the human eye, is known as Diabetic Retinopathy. Due to elevated amounts of glucose circulating through the body, the walls of blood vessels
become damaged and several anomalies such as
Microaneurysms, hemorrhages, Hard Exudates, Cotton wool spots start developing at various phases of retinopathy. The patient affected by Diabetic Retinopathy may not experience visual impairment until the disease has progressed to a severe stage, when the treatment is less effective. Therefore the early detection and the regular follow-ups is necessary to treat diabetic retinopathy. The earliest symptoms of Retinopathy are the Micro aneurysms, which occur due to dilatations of the blood capillaries and they appear as dark red spots on the retina. Hemorrhages occur when the microaneurysms burst. Bright-yellow colored Lesions such as hard exudates occur as a result of fluid leaking into the retinal surface from the capillaries or from Microaneurysms. Another bright white colored lesions, called the soft Exudates or cotton wool spots occur occlusions of the nerve fibre layer.
*Corresponding author:Koushik Bhattacharyya,
Assistant Professor, Computer Science and Engineering, Dream Institute of Technology, Kolkata, India.
Diabetic Retinopathy is a progressive disease. The first stage of retinopathy is known as Non-Proliferative Retinopathy, during which the retinal lesions appear and increase as the disease progresses. Initially, at least one micro aneurysm is seen. With the progression of the disease, the blood vessels become blocked and are short of blood supply. In an attempt to create new paths for blood supply, abnormal and fragile new blood vessels are formed on the surface of retina in the stage of Proliferative Retinopathy that might leak blood into retina causing permanent blindness. The various lesions associated with diabetic retinopathy are as shown in the figure below. Diabetes retinopathy (DR) is a severe eye disease that affects many diabetic patients. Diabetic retinopathy is the most common cause of blindness which a complication of diabetes mellitus, so it is necessary to diagnosed early. The eye, a vital organofthehumanbody,givesusthesenseofcolor,shapeand stateofphysicalobjects.ButifAbnormalitiesoccursintheeye because of diseases such as Conjunctivitis, Fungal Keratitis, glaucoma, diabetic retinopathy, fungal infection, diabetes then eye may be damaged (http://www.sightsavers. net/our_work/
around_the_world/asia/india/9817). The complicated images
obtained from infected eye will be processed using digital Image Processing (DIP) technique, which manipulates the image for the purpose of either extracting information from the image or produces an alternative representation of the image. Thus screening is the most effective method to detect early signs of diabetic retinopathy (Preethi and Vanithaman, 2012 and Fraz et al., 2012).
ISSN: 2230-9926
International Journal of Development Research
Vol. 08, Issue, 11, pp.24176-24182, November, 2018
Article History:
Received 20th August, 2018
Received in revised form 25th September, 2018
Accepted 19th October, 2018 Published online 30th November, 2018
Key Words:
Diabetic Retinopathy,
Sobel operator, Standard Deviation, Variance.
Citation: Koushik Bhattacharyya, 2018. “Screening Diabetic Retinopathy using Statistical Methods”, International Journal of Development Research, 8,
(11), 24176-24182.
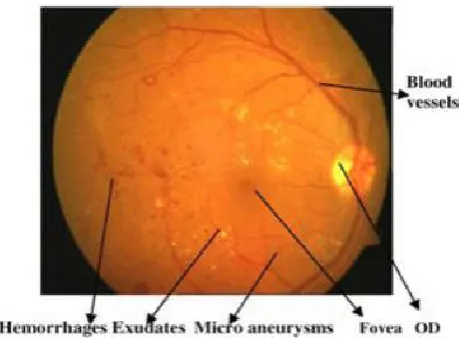
Fig 1. Retinal lesions associated with diabetic retinopathy
Using screening method big blood clots called hemorrhages, Hard exudates, The bright circular region from the blood vessels called optic disk, The fovea defines the center of the retina, and is the region of highest visual acuity, exudates and microaneurysms, irregular shaped, and found in the posterior pole of the fundus can be detected. Ma et al. (Fraz et al., 2012) defined a quality descriptor according to three classes, namely, out-of-focus images, motion blurred images and severely occluded images of eyelids and eyelashes. Zhu et al. (Nekovei and Ying, 1995) proposed a quantitative quality measure using discrete wavelet decomposition. Analyzing and interpreting retinal images have become a necessary and important diagnostic procedure in ophthalmology. We are interested in vessel segmentation in color images for screening of diabetic retinopathy. Thus to remove noise, enhance objects of interest - blood vessels, damaged areas, Changes in the blood Vessel Structure we can use Sobel algorithm, and Laplacian of Gaussian operator, which detects the edges of blood vessels (Leandro et al., 2006). Micro aneurysms (tiny dilations of the blood vessels) are the first apparent sign of diabetic retinopathy so that their detection in fund us images through photography might be detect the disease in an early stage.
Diabetes is a disease which occurs when the pancreas does not secrete enough insulin or the body is unable to process it properly. This disease affects slowly the circulatory system including that of the retina. As diabetes progresses, the vision of a patient may start to deteriorate and lead to diabetic retinopathy. In this study on different stages of diabetic retinopathy, 124 retinal photographs were analyzed. As a result, four groups were identified, viz., normal retina, moderate proliferative diabetic retinopathy, severe non-proliferative diabetic retinopathy and non-proliferative diabetic retinopathy. Automated computer techniques of digital image processing offer a fast, objective and repeatable method for identifying diabetic retinopathy. There are several algorithms available in the literature to identify diabetic retinopathy using image processing techniques. The algorithms use different
image processing techniques such as localization,
normalization, shade correction, histogram equalization, enhancement, segmentation, filtering, classification, etc. These image processing techniques assists the physical to make correct decision
Literature Review
Diabetic retinopathy (DR) is a major cause of blindness in the developed countries. A mass screening of the vision can be
successful to detect diabetic retinopathy for people who are at the risk of this eye disease. Manual extraction of the blood vessels is very time consuming in fundus images and its accuracy will definitely depend on the skill of the user. So, automatic detection of the retinal blood vessels is of utmost importance. Retinal blood vessel segmentation techniques can be divided into five different classes according to (3): (1) Matched filtering, (2) Pattern recognition, (3) Mathematical morphology, (4) Vessel tracking, (5) Multi scale approaches. In each category, several methods have been described in (3).Pattern recognition techniques can be divided into two main methods: supervised and unsupervised. An approach based on back-propagation neural network is described for the blood vessels segmentation in angiography in (Nekovei and Ying, 1995). 2D Gabor wavelet with supervised classification are used for the segmentation of the retinal vessels in (Leandro
et al., 2006). The intensity of the pixels and 2DGabor wavelet
coefficients forms the feature vectors. A technique based on feeding 7D features consisting of gray level with invariant based features to a supervised neural network is described in (Marin et al., 2011). The approach in (Chaudhuri et al., 1989, Gang et al., 2002 and Yao and Chen, 2009), can be considered as matched filter methods. A 2D kernel with Gaussian is described for the vessel detection in (Chaudhuri et al., 1989). Because a vessel can occur in any angles, the kernel is rotated in 12 different directions and maximum response in each pixel is retained. The amplitude modified second order Gaussian filter has been proposed for segmentation of the blood vessel of the retina in (Gang et al., 2002). Also a 2D Gaussian matched filter is used for enhancement of the vessels and then a neural network is applied for the vessel detection in (Fraz et
al., 2012 and Yao and Chen, 2009). Tracking method with the
Kalman and Gaussian filters combination for segmentation of the vessels in the fund us images is proposed in (Fraz et al.,
2012 and Chutatape et al., 1998).
The second order matched filter is used for centre line estimation and after that the track process is started, i.e., the location of the next blood vessel is estimated by the application of the Kalman filter. A supervised method for segmentation of the retinal vessels is proposed in Fraz et al.,
2012 and Anzalone et al., 2008), where using scale space theory, the image background is normalized for non-uniform intensity variations and an optimization technique is applied to decide the optimal scale (Fraz et al., 2012 ). Several scientists have been working in the diabetic retinopathy and published many research papers and articles. Some of the works are discussed below to have a basis idea about diabetic retinopathy in the digital image processing domain. C. Heneghen presented a general technique for segmenting out vascular structures in retinal images and characterized the segmented blood vessels (Nekovei and Ying, 1995). The segmentation technique consists of several steps. Morphological preprocessing has used to emphasize linear structures such as vessels. A second derivative operator has used to emphasize thin vascular structures, and is followed by a final morphological filtering stage. Thresholding of this image has used to provide a segmented vascular mask.
width and tortuosity were shown using test images. Using these tools, a set of images drawn from 23 subjects being screened for the presence of threshold ROP disease is considered. Of these subjects, 11 subsequently required treatment for ROP, 9 had no evidence of ROP, and 3 had spontaneously regressed ROP. The average vessel width and tortuosity for the treated subjects was 96.8 mm and 1.125. The corresponding figures for the non-treated cohort were 86.4 mm and 1.097. These differences were statistically significant at the 99% and 95% significance level, respectively.
Subjects who progressed to threshold disease during the course of screening showed an average increase in vessel width of 9.6 mm and in tortuosity of 10.008. Only the change in width was statistically significant. Appling a simple retrospective screening paradigm based solely on vessel width and tortuosity yields a screening test with a sensitivity and specificity of 82% and 75%. They have shown that segmentation of the vascular structure in retinal images is possible by use of a combination of morphological and linear filtering. Rawi et al. proposed better matched filter parameters (Leandro et al., 2006). Comparisons with other approaches show that matched filter that uses the newly found parameters outperforms the matched filter that uses the classical filter parameters as well as some vessel detection techniques. A technique is also discussed to find the best threshold value for the continuous matched filter output image and hence the best segmented vessel image. S’anchez et al. proposed an automatic image processing algorithm to detect hard exudates (HE) (Marin et al., 2011).
HEs detection is composed of four main stages: (1) image preprocessing and enhancement, (2) feature extraction (3) classification, and (4) post processing. In the first stage, the image is enhanced to obtain adequate illumination normalization and contrast. Following this step, the algorithm extracts dynamical training sets from each image. Next, the algorithm classifies the pixels using a Fisher’s linear discriminate. Finally, a post processing technique is applied to distinguish HEs from cotton wool spots (CWs) and other artifacts. Sopharak et al. proposed proposes a set of optimally adjusted morphological operators to be used for exudates detection on diabetic retinopathy patients’ non-dilated pupil and low-contrast images (Chaudhuri et al., 1989). The red, green, and blue (RGB) space of the original image was transformed to Hue, saturation and intensity (HSI) space because HIS color space is more appropriate since it allows the intensity component to be separated from the other two color components. A median filtering operation was then applied on I band to reduce noise before a contrast-limited adaptive histogram equalization (CLAHE) was applied on I band to reduce noise before a contrast-limited adaptive histogram equalization (CLAHE) was applied for contrast enhancement
(http://www.vision2020india.org/dr_manual.pdf). CLAHE
operates on small regions in the image. The contrast of each small region is enhanced with histogram equalization.
After performing the equalization, the neighboring small regions were then combined by using bilinear interpolation. T. Walter et al. proposed a new algorithm (Gang et al., 2002). The algorithm can be divided into four steps. The first step consists in image enhancement, shade correction and image normalization of the green channel. The second step aims at detecting candidates, i.e. all patterns possibly corresponding to MA, which is achieved by diameter closing and an automatic threshold scheme. Then, features are extracted, which are used
in the last step to automatically classify candidates into real MA and other objects; the classification relies on kernel density estimation with variable bandwidth. C. Kose et al. developed automatic method for segmenting the ARMD in retinal funds image (Yao and Chen, 2009). A simple inverse segmentation method is proposed to exploit the homogeneity of healthy areas of the macule rather than unhealthy areas. This method first extracts healthy areas of the macule by employing a simple region growing method. Then, blood vessels are also extracted and classified as healthy regions. In order to produce the final segmented image, the inverse image of the segmented image is generated as unhealthy region of the macule. The performance of the method is examined on various qualities of retinal fundus images. The segmentation method without any user involvement provides over 90% segmentation accuracy. Direct segmentation techniques are more complex and costly than our inverse method. W. L. Yun completed study on different stages of diabetic retinopathy, 124 retinal photographs were analyzed (10). As a result, four groups were identified, viz., normal retina, moderate non-proliferative diabetic retinopathy, severe non-proliferative diabetic retinopathy and proliferative diabetic retinopathy. Classification of the four eye diseases was achieved using a three-layer feed forward neural network. The features are extracted from the raw images using the image processing techniques and fed to the classifier for classification. We demonstrate a sensitivity of more than 90% for the classifier with the specificity of 100%. A. Haddouche et al. dealt with the segmentation of the Foveal Avascular Zone (FAZ) in digital retinal angiograms (11). Retinal angiography is used for detection and progression in some eye pathologies. The proposed method consists of two-stages: Singular Value Decomposition (SVD) and FAZ segmentation using Markov Random Fields (MRF). The obtained results decomposition that the method is encouraging as a first approach for location and evolution of FAZ in retinal images.
THE METHODS OF DETECTION
The Methodology
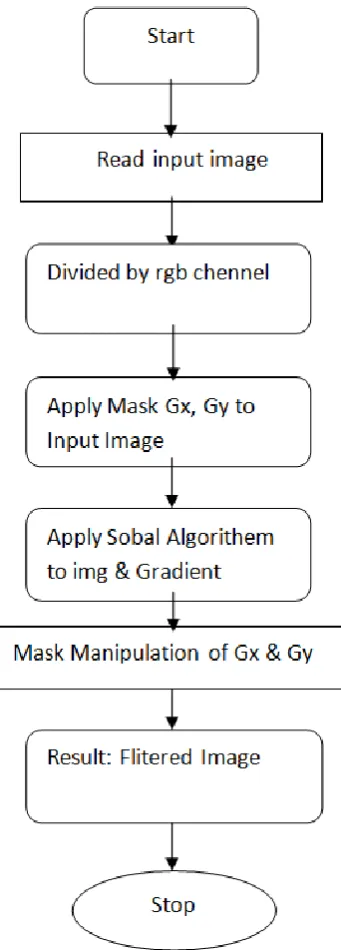
Detection of vessels, exudates, and hemorrhages, blood clots, Hard exudates, optic disk is possible using Sobel method. Edge detection is the process of localizing pixel intensity transitions. The Sobel operator is an algorithm for edge detection in images discovers the boundaries between regions also it determine and separate objects from background in an image. It’s an important part of detecting features and objects in an image (Marin et al., 2011). The Sobel method finds edges using the Sobel approximation to the derivative. It returns edges at those points where the gradient of I is maximum. Where the gradient of the considered image is maximum. The horizontal and vertical gradient matrices whose dimensions are 3 × 3 for the Sobel method has been generally used in the edge detection operations (Chaudhuri et al., 1989). If we define A as the source image, and Gx and Gy are two images which at each point contain the horizontal and vertical derivative approximations, the computations are as follows.
=
−1 0 +1
−2 0 +2
−1 0 +1
∗
=
−1 −2 −1
0 0 0
+1 +2 +1
∗ ……… (2)
= + ……… (3)
| |=| |+ ……… (4)
Gx==(W7+2W8+W9)-(W1+2W2+W3)
Gy==(W3+2W6+W9)-(W1+2W4+W7)
Where, W1 to w9 are pixcels values in a sub image (Chaudhuri
et al., 1989). These filters estimate the gradients in the
[image:4.595.79.250.298.774.2]horizontal (x) and vertical (y) directions and the magnitude of the gradient is simply the sum of these 2 gradients. Using this information, we can also calculate the gradient's direction (Gang and Krishnan, 2002).Where, for example, Θ is 0 for a vertical edge which is darker on the right side.
Fig. 2. Flowchart for Sobel Method
RESULTS EVALUATION
A colour photographic angiogram covering the patient's retina is taken with a conventional fundus imaging camera. The image colour depth is twenty four bit. It is observed that the existing algorithms are time consuming and resource consuming due to complicated computations. It is planned to work on a simple solution using statistical algorithm. The medical expert has classified the retinal images into normal, mild and severe as shown in the following Figure 1. We have selected totally ninety images, thirty images from each category normal, mild, and severe. The categorization is based on the number of micro aneurysms, small intra retinal dot hemorrhages, larger blot hemorrhages, whitish lesions, and cotton wool spots in the retinal image (http://www. worlddiabetesfoundation.org/composite-35.htm, 2011). The proposed algorithm applies Sobel operator to each Red and Green Channel to identify the dots present in the retinal image. This detects the hard exudates present in the Red, Green and Blue channels. Then, Variance value of red channel and variance value of Green Channel are calculated. The blue channel is noisy and may contain small and false information. Therefore, the Red and Green channels are considered for variance calculation and blue channel is ignored. Finally, difference of variance values between Red and Green channel is calculated. From the value obtained from the difference between the Red and Green channel values the retinal image could be classified into normal, mild and severe. The different steps in the proposed algorithm are represented in the following flowchart.
Formula of SD and VAR :
SD =
=
∑( )……….. (5)
M = mean, n = number of element.
= ………. (6)
It is observed form Table 1 and figure 4 that the 0% to 40 % difference for normal category retinal images with 0.13 errors, 40% to 95% difference for mild category retinal images with 0.6 errors and 95% to 100% difference for severe category retinal images with 0.10 errors. The experiment results show that the statistical algorithm is simple and fast in processing. Also, the statistical algorithm is less in error. On an average the error is close to 0.12. It is noted the normal category of retinal images are low in difference in between red and green channel variance values, whereas the severe category of retinal images are in the higher difference variance values and the mild images are in between the normal and severe categories of the retinal images.
Evaluation of the Performance of Classifire
Fig. 3 Retinal image of Normal, Mild and Severe
Fig. 4. Different steps in Proposed Algorithm
Table 1. Normal Image Green Channel
Image Tot mean Tot median Tot var. Tot STD Image1 87.7360 0 343 18.520259 Image2 87.9929 0 532 23.065125 Image3 87.1700 0 780 27.928480 Image4 88.1747 0 520 22.803508 Image5 86.6433 0 156 12.489996
Table 2. Normal Image red Channel
Image Tot mean Tot median Tot var. Tot STD Image1 86.5908 0 314 17.720045 Image2 86.5780 0 417 20.420577 Image3 86.5765 0 514 22.671568 Image4 86.6166 0 318 17.832554 Image5 86.5794 0 346 18.601075
Table 3. Mild Image Green channel
Image Tot mean Tot median Tot var. Tot STD Image1 112.0927 2 517 22.737634 Image2 117.2858 7 686 26.134268 Image3 118.4639 7 535 23.130067 Image4 110.8993 0 636 25.219040 Image5 117.2919 7 861 29.342801
Table 4. Mild Image Red channel
Image Tot mean Tot median Tot var. Tot STD Image1 86.5782 3 324 18 Image2 86.5975 8 368 19.183326 Image3 86.7316 9 432 20.784609 Image4 86.9724 0 382 19.544820 Image5 86.6461 7 513 22.649503
Table 5. Severe Image Green channel
Image Tot mean Tot median Tot var. Tot STD Image1 87.4940 4 493 22.203603 Image2 88.6474 13 448 21.166010 Image3 88.2667 8 406 20.149441 Image4 87.5741 4 302 17.378147 Image5 88.3960 9 546 23.366642
In a given image dataset, these parameters, TP,TN, FP, FN are used in the calculation of the accuracy, Sensitivity (SN) and specificity (SP). Performance of the classifier can be measured in terms of sensitivity, specificity and accuracy.
Sensitivity = TP / (TP+FN)
Sensitivity is measure of the percentage of abnormal images classified as abnormal.
Specificity = TN / (TN+FP)
Specificity gives the measure of normal images that are
classified correctly as normal.
Accuracy = (TP+TN)/ (TP+FN+TN+FP)
It is the measure of total number of well classified normal and abnormal images.
Table6. Severe Image Red channel
Image Tot mean Tot median Tot var Tot STV Image1 87.2704 3 258 16.062378 Image2 86.5687 6 292 17.088007 Image3 86.6487 7 315 17.748239 Image4 86.6442 7 432 20.784609 Image5 86.5872 6 618 24.859605
Table 7 .Variance value of Red, Green Channel of Normal Images
No. Green Channel Red Channel
1. 343 314
2. 532 417
3. 780 514
4. 520 318
5. 156 346
Fig. 5. Variance of Red and Green Channel of Normal Images
Table. 8 Variance value of Red, Green Channel of Mild Images
No. Green Channel Red Channel
1. 517 324
2. 686 368
3. 535 432
4. 636 382
5. 861 513
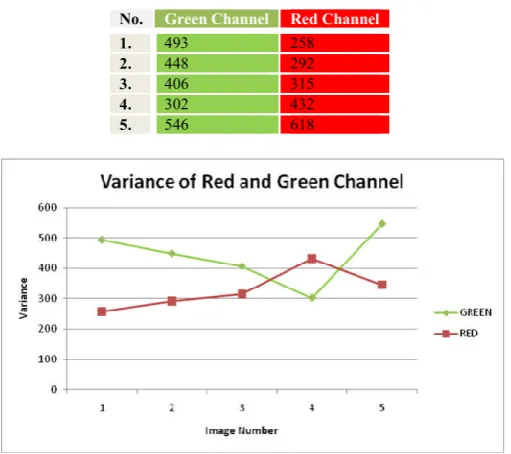
Table 9. Variance value of Red, Green Channel of Severe Images
No. Green Channel Red Channel
1. 493 258
2. 448 292
3. 406 315
4. 302 432
5. 546 618
Fig. 7. Variance of Red and Green Channel ofSevere Images
Table10.Experimentresultofnormal,mildandsevereretinal
images
No. Normal Mild Severe
Red Green Difference Red Green Difference Red Green Difference 1 314 343 29 324 517 193 258 493 235 2 417 532 115 368 686 318 292 448 156 3 514 780 266 432 535 103 315 406 91 4 318 520 202 382 636 254 432 302 180 5 346 156 190 513 861 348 618 546 72 6 378 498 120 431 860 429 475 513 38 7 410 641 231 389 776 387 370 325 45 8 510 209 301 412 822 410 506 473 33 9 321 602 281 365 752 387 283 473 190 10 415 535 120 379 539 160 294 550 256 11 385 528 143 445 790 345 334 619 285 12 456 758 302 456 869 413 424 715 291 13 511 326 185 469 603 134 523 282 241 14 473 290 183 473 822 349 483 300 183
Fig. 8. Difference between red and green channel of different retinal images
Conclusion
We proposed an efficient method based on Sobel method which differentiates between original diabetic image & processed image. Sobel method can show separates parts of the edges of nerves from whole image. This paper has demonstrated an automated system which is able to distinguish normal and abnormal vasculature on the optic disc. The main focus of this work is on segmenting the diabetic retinopathy image and classifies the Exudates, micro aneurysms and hemorrhages. These methods give almost good results. Thus Image processing techniques can reduce the work of
ophthalmologists and the tools used automatically locate the exudates. The proposed algorithm consists of two basic operations, one is Sobel operator and another one is variance calculation of Red and Green channel of the retinal image. The Sobel operator is used to identify the dots in the Red and Green channel of the retinal images. The difference between the variance values of Red and Green channel categorises the retinal image into normal, mild and severe. The experimental results show that the algorithm works faster because of simple computation and categorises the retinal images with minimum amount of error compared to the presently available algorithms.
REFERENCES
AI-Rawi, M., Qutaishat, M. and Arrar, M. 2007. An improved matched filter for blood vessel detection of digital retinal images, Computers in Biology and Medicine, 37: 262-267. Anzalone, A., Bizzarri, F., Parodi, M. and Storace, M. 2008.
“A modular supervised algorithm for vessel segmentation in red-free retinal images”, Computers in Biology and
Medicine, Vol. 38(8), pp.913-922.
Chaudhuri, S., Chatterjee, S., Katz, N., Nelson, M. and Goldbaum, M. 1989. “Detection of blood vessels in retinal images using 2D matched filters", IEEE Trans. Medical
Imaging, Vol.8, No.3, pp 263-
Chutatape, O., Liu, Z. and Krishnan, S.M. 1998.“Retinal blood vessel detection and tracking by Matched Gaussian and Kalman Filters”, 20th Int. Conf. IEEE Eng. Med. Biol, Vol. 3146, pp. 3144– 3149.
Frame, A.J., Undrill, P.E., Cree, M.J. et al. 1998. A comparison of computer based classification methods applied to the detection of microaneurysms in ophthalmic
fluorescein angiograms. Computers in Biology and
Medicine, 28: 225-238.
Fraz, M.M., Remagnino, P., Hoppe, A., Uyyanonvara, B., Rudnicka, A.R., Owen, C.G. and Barman, S.A. 2012. “Blood vessel segmentation methodologies in Retinal images– A survey”, Computer methods and programs in
Biomedicine, 108, pp. 407-433.
Gang, L., Chutatape, O. and Krishnan, S.M. 2002. “Detection and measurement of retinal vessels in Fundus images using Amplitude Modified Second order Gaussian Filter”, IEEE
Trans. Biomedical Engineering, Vol. 49, No. 2, pp. 168–
172.
Heneghen, C., Flynn, J., O’Keefe, M. and Cahill, M.2002. Characterization of changes in blood vessel width and tortuosity in retinopathy of prematurity using image analysis. Medical Image Analysis, 6: 407-429.
http://www.sightsavers.net/our_work/around_the_world/asia/i ndia/9817.
Leandro, J.J.G., Soares, J.V.B., Cesar, R.M., Jelinek, H.F. and Cree, M.J. 2006. “Retinal vessel segmentation using the 2-D Gabor wavelet and Supervised classification”, IEEE Trans. Medical Imaging, Vol. 25, No.9, pp. 1214–1222. Marin, D., Aquino, A., Gegundez-Arias, M.E. and Bravo, J.M.
2011. “A new supervised method for blood vessel segmentation in retinal images by using Gray-level and Moment Invariants-based Features”, IEEE Trans. Medical
Imaging, Vol. 30, No. 1, pp. 146-158.
Nekovei, R. and Ying, S. 1995. “Back-propagation network and its configuration for blood vessel detection in
Angiograms”, IEEE Transactions on Neural networks,
[image:6.595.28.294.348.628.2]Preethi, M. and Vanithamani, R. 2012. “Review of retinal blood vessel detection methods for Automated Diagnosis of Diabetic Retinopathy,” IEEE International Conference
on Advances in Engineering, Science and Management,
Nagapattinam, Tamil Nadu, 30-31 ISBN: 978-81-909042-2-3/IEEE, pp. 262-265.
Sanchez, CI., Hornero, R., Lopez, MI. et al. 2008. A novel automatic image processing algorithm for detection of hard
exudates based on retinal image analysis. Medical
Engineering & Physics, 30: 350-357.
Sopharak, A., Uyyanonvara, B., Barman, S. and Williamson, T. H. 2008. Automatic detection of diabetic retinopathy exudates from non-dilated images using mathematical
morphology methods. Computerized Medical Imaging and
Graphics, 32: 720-727.
Vision 2020 India http://www.vision2020india.org/
dr_manual.pdf 2011 August.
Walter, T., Massin, P., Erginay, A. et al. 2007. Automatic detection of microaneurysms in color fundus images.
Medical Image Analysis, 11: 555-566.
Word Diabetes Foundation http://www.worlddiabetes
foundation.org/composite-35.htm 2011 Augest.
Yao, C. and Chen, H.J. 2009. “Automated retinal blood vessels segmentation based on Simplified PCNN and Fast 2D-Otsu algorithm”, J. Cent. South Univ. Technol, Vol. 16, pp. 0640-0646.