IJPSR (2016), Vol. 7, Issue 2 (Research Article)
Received on 05 August, 2015; received in revised form, 21 September, 2015; accepted, 13 November, 2015; published 01 February, 2016
A NEW SINGLE STABILITY INDICATING RP-ULTRA PERFORMANCE LIQUID CHROMATOGRAPHY (RP-UPLC) METHOD FOR EVALUATION OF ASSAY OF BICALUTAMIDE FROM DOSAGE FORM AND SUITABILITY OF METHOD FOR DETERMINATION OF DISSOLUTION RATE AND RESIDUE ANALYSIS.
Vamsi Krishna Galla, Archana V. and Rajeswari Jinka
Department of Biochemistry, Acharya Nagarjuna University, Guntur, Andhra Pradesh, India.
ABSTRACT: A new single stability-indicating isocratic reversed phase ultra-performance liquid chromatographic (RP-UPLC) method with a shortest run time of 2.5 minutes is developed for the determination of assay of bicalutamide an anti-cancer drug from its finished dosage form in the presence of its forced degradation products. The method is developed using Waters Aquity BEH C18 column with mobile phase containing an isocratic mixture of solvent A and B. The eluted compounds were monitored at 270 nm. Bicalutamide tablets were subjected to the stress conditions of oxidative, acid, base, hydrolytic, thermal, and photolytic degradation, within which forced degradants were well-resolved from main peak, thus proving the stability indicating power of the method. The developed method is validated as per ICH guidelines with respect to specificity, linearity, Accuracy, precision and robustness. The same method is also tested for evaluation of dissolution where recovery, linearity and solution stability were evaluated and found satisfactory. As a part of cleaning validation-Residue analysis, recovery of 0.5ppm on two different surfaces (Stainless steel and Class-A Glass) were performed and found satisfactory along with limit of Quantification with signal to noise greater than 10.
INTRODUCTION: Bicalutamide, a
non-steroidal androgen receptor inhibitor, is indicated for use in combination therapy with a luteinizing hormone-releasing hormone (LHRH) analog for the treatment of Stage D2 metastatic carcinoma of the prostate. The chemical name is propanamide, N [4 cyano-3-(trifluoromethyl) phenyl] – 3 - [(4-fluoro phenyl) sulfonyl]-2-hydroxy-2-methyl-,(+-) with molecular weight of 430.37.
QUICK RESPONSE CODE
DOI:
10.13040/IJPSR.0975-8232.7(2).635-45
Article can be accessed online on:
www.ijpsr.com
DOI link: http://dx.doi.org/10.13040/IJPSR.0975-8232.7 (2).635-45
Bicalutamide available as tablets with 50mg as label claim and inactive ingredients include lactose, magnesium stearate, hypromellose, polyethylene glycol, polyvidone, sodium starch glycollate, and titanium dioxide.
FIG.1: CHEMICAL STRUCTURE OF BICALUTAMIDE
International Conference on Harmonization (ICH) guidelines and regulatory authorities focuses on
validated stability-indicating liquid
chromatography (LC) methods established through
Keywords: Forced degradation, Peak purity, Photo diode array (PDA), RP-UPLC, Bicalutamide,
Dissolution, ICH, Cleaning validation, Residue analysis. Correspondence to Author: Dr. J. Rajeswari,
Assistant Professor,
Department of Biochemistry, Acharya Nagarjuna University, Nagarjuna Nagar, Guntur, Andhra Pradesh 522510, India.
forced degradation studies for stability testing of drug substances and drug products. A stability-indicating method accurately measures the active ingredients, without interference from degradation products, process impurities, excipients, or other potential impurities under the influence of environmental factors over a period of products life cycle. Ultra performance liquid chromatography
(UPLC) is a recent technique in liquid
chromatography, which works with sub-2µ particle size packed columns that enables significant improvement in resolution and reduction in run time and solvent consumption.
As per literature survey, no RP-UPLC assay method is available with shortest run time, which established stress studies of Bicalutamide drug product along with spectral purity (PDA) analysis with negligible carry over. Along with assay, suitability of the method for estimation of dissolution of tablets and residue analysis (Cleaning validation) is evaluated and is the most advantageous attribute of this method for which till date no publications are available. Hence the current method is developed and fully validated which is specific, precise, linear, rugged and robust as per ICH and regulatory guidelines.
Experimental:
Chemicals and reagents:
HPLC gradient grade (0.2µ Filtered) acetonitrile, HPLC grade water and Trifluoro acetic acid (>99.5%) is procured from Thermo Fisher suppliers Hyderabad. Bicalutamide API and working standards, tablets and placebo were received as a gift sample from KP Labs, Hyderabad.
Equipment:
We used Acquity UPLC TM system (Waters, Milford, USA) consists of a binary solvent manager, a sample manager and a photodiode array (PDA) detector. The output signal is monitored and processed using empower 2 software. Digital water bath from Thermo scientifics is used for stress studies. Photo stability studies were carried out in a photo stability chamber (Sanyo, Leicestershire, UK). Thermal stability studies were performed in a dry air oven (Cintex, Mumbai, India). Mobile phases were degassed and Solutions prepared by ultra sonication (Power sonic 420, Labtech, Korea)
and filtered through a 0.22μm (PALL life sciences, USA).
Chromatographic Conditions:
The method is developed using Waters Aquity BEH C18, 100 x 2.1 mm; 1.7μm column (Waters, Milford, USA). Filtered HPLC water through 0.22 μm membrane filter and 0.02% Trifluoro acetic acid is prepared (200µL per litre) and used as Mobile phase-A and acetonitrile as Mobile phase-B in ratio of 52:48 isocratic mode. The flow rate of the mobile phase is 0.5 ml/min. The column temperature is maintained at 40 °C, sampler temperature at ambient and wavelength is monitored at 270 nm, sampling rate of 10 sec, with total run time of 2.5 minutes. Sample manager is set with 10µL loop (characterised seal and loop volume before start) and injection volume is 2 µL. Prepared a mixture of 90:10 Water: ACN as weak needle wash set at 500µL and 90:10 ACN: Water as Strong needle wash set at 500µL. A mixture of 1:2 ratio of mobile phase-A and B is used as diluent.
Preparation of Standard and Sample Solutions:
A stock solution of bicalutamide working standard is prepared by dissolving appropriate amount of respective drug in the diluent followed by further dilutions to meet 20µg/ml.
20 tablets containing label claim of 50mg/tablet were weighed, determined average weight and crushed to fine powder with mortar and pestle. Tablet powder equivalent to 50 mg drug is dissolved in diluent and sonicated at 23ºC for 20 min to give a solution containing 500 μg/ml. Allowed the solution on bench top to settle and from top 2 ml of this solution is diluted to 50 ml with diluent, to give a solution containing 20μg/ml. These solutions were filtered through a 0.22μm pore size PVDF syringe filter.
System suitability and Precision:
of the assay method is evaluated by different analyst.
Accuracy:
The accuracy of the assay method is evaluated using three concentration levels 50%, 100%, 150% to target concentration and % added, % found and % recovered were evaluated.
Linearity:
Linearity of target test concentration for the assay method were prepared from stock solutions at five concentration levels from 50 to 200% of assay concentration (10, 15, 20, 30, 40µg/ml). The peak area versus concentration data is treated by least-squares linear regression analysis and Slope, Y-Intercept, and coefficient of correlation is evaluated.
Specificity:
Specificity is the ability of the method to measure the analyte response in the presence of its potential impurities. Intentional degradation is attempted at stress condition of Thermal, photolytic, acid, alkaline, peroxide and hydrolysis. Tablets were exposed in oven at 105ºC for 36hours and tablets were placed in a petri dish and kept in a photo stability chamber/200Wh/m2 in ultraviolet (UV) for seven days.
Acid Stress sample:
2ml of sample stock solution is transferred to 50ml volumetric flask, added 3ml 2N HCl, and tighten the lid and kept in water bath for 5 hours at 60ºC. After stress time, cooled the solution to room temperature, neutralised with 3ml 2N NaOH solution and filled the volume upto mark with diluent.
Alkali Stress sample: 2ml of sample stock solution is transferred to 50ml volumetric flask, added 3ml methanolic 1N NaOH solution, and tighten the lid and kept on bench top for 90 minutes. After stress time, neutralised with 3ml 1N HCl solution and filled the volume upto mark with diluent. Peroxide Stress sample: 2ml of sample stock solution is transferred to 50ml volumetric flask, added 5ml 10% H2O2 solution, and tighten the lid and kept on bench top for 5 hour. After stress time filled the volume upto mark with diluent.
Hydrolysis Stress sample: 2ml of sample stock solution is transferred to 50ml volumetric flask, added 5ml water and tighten the lid and kept in water bath for 5 hours at 60ºC. After stress time added 5ml Acetonitrile and filled the volume upto mark with diluent.
Thermal and photolytic samples were retrieved form respective chambers and prepared sample solution. Loaded stressed samples into LC system enabled with PDA and analysed peak purity with extended runtime of 5minutes to know about late eluting peaks
Robustness:
To determine the robustness of the developed method, experimental conditions were deliberately altered to evaluate the impact of change in chromatographic conditions. To study the effect of flow rate, flow is changed by ±10% i.e., 0.45ml/min and 0.55ml/min from actual flow rate. Effect of column temperature is studied by altering ± 5ºC i.e., 35ºC and 45ºC of actual column temperature.
Solution Stability and Mobile Phase Stability:
The stability of solutions was determined by leaving solutions of the sample and standard in
tightly capped volumetric flasks at room
temperature from the day of preparation till 48 hours. The mobile phase prepared at the beginning of the study and not is changed during the experiment and tested at an interval of 48 hours. Stability of mobile phase and solutions were determined by comparing with freshly prepared standard and difference in % assay is calculated.
Method development trials:
phases A and B were tried, where satisfactory separation of Alkali degradant peaks is achieved at Mobile phase A and B at ratio of 52:48 at 0.5ml/minute flow rate, with column temperature at 40ºC. PDA scanning from 200 to 400nm showed the absorbance maxima at 270nm for bicalutamide standard and sample solution, hence chosen for analysis. Desirable peak shape, tailing and plate counts with satisfactory area is attained with 2µL injection volume with negligible carry over with shortest run time of 2.5 minutes. Few trails performed with mixtures of mobile phases A and B
as diluent and extraction procedure (time based), where desired sample accuracy is achieved with 1:2 ratio at 20 minutes of sonication.
RESULTS AND DISCUSSION: System suitability and Precision:
System suitability parameter is passed and is within acceptable limits. The % R.S.D. of assay during the assay method repeatability study and intermediate precision is 0.92 and 0.68. These results are conforming good precision of the method. Refer
Table 1.
TABLE1: PRECISION AND SOLUTION STABILITY
System suitability Rt USP USP % RSD
parameters in min Tailing Plate count area
(n=5)* (n=5)* (n=5)* (n=5)*
Method Precision 1.55 1.24 7699 0.6
Intermediate-Precision 1.52 1.23 7817 0.4
Assay Results Spl-1 Spl-2 Spl-3 Spl-4 Spl-5 Spl-6 % Assay** % RSD**
Method Precision 100.2 99.3 100.5 100.1 101.7 100.7 100.4 0.92 Intermediate-Precision 99.7 100.2 99.2 101.1 100.7 100.4 100.8 0.71 * For Standard, ** Acceptance Limits: Assay = 97% to 103% for n=6 test preparations and % RSD ≤ 2.0
Solution Stability: For Standard-Similarity Factor: New vs 48 Hours Standard: 1.01 (limit: 0.98 to 1.02). For sample % Difference: Initial vs 48 Hours Sample: 0.51 (Limit: ± 2.0%).
Mobile Phase Stability: % RSD for standard (n=5): 0.7, USP Tailing: 1.22, USP Plate Count: 7942.
Accuracy: The mean percentage recovery of bicalutamide from tablets at three levels 50%, 100% and 150% is ranged from 99.76% to
100.05% with an %RSD below 2% per triplicate
sample preparation for each level. Refer Table 2.
TABLE 2: ACCURACY
Sample name Added Found % Recovery Average % RSD
(µg/ml) (µg/ml) Assay* n=3* n=3*
Accuracy 50% Spl-1 10.1240 10.0761 99.53
Accuracy 50% Spl-2 10.0560 10.0964 100.40 99.80 0.52
Accuracy 50% Spl-3 10.1880 10.1346 99.48 Accuracy 100% Spl-1 20.0680 19.8883 99.10
Accuracy 100% Spl-2 20.1640 20.2053 100.20 99.76 0.58
Accuracy 100% Spl-3 19.9160 19.9080 99.96 Accuracy 150% Spl-1 29.9640 30.0409 100.26
Accuracy 150% Spl-2 30.1440 30.1456 100.01 100.05 0.19
Accuracy 150% Spl-3 30.3160 30.2788 99.88
* % Recovered and average of n=3 per each level must be within 97% to 103%, % RSD must be ≤ 2.
Linearity: The linearity calibration plot for the assay method is obtained over the calibration ranges tested, i.e. 10–40 µg/ml and correlation coefficient obtained is greater than 0.999 for
Bicalutamide peak. The result shows that a significant correlation existed between the peak
area and concentration of the analyte. Refer Table3
TABLE3: LINEARITY
Linearity Range Slope Y-Intercept r 2*
10 to 40 µg/mL 19337.2449 16993.03448 0.99942
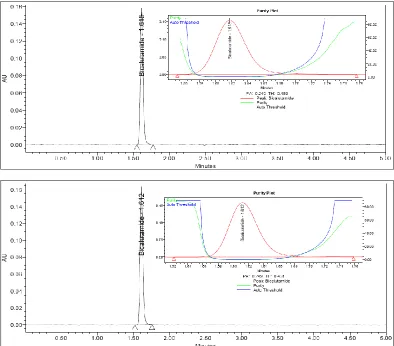
Specificity-Forced degradation:
All forced degradation samples were analyzed at mentioned UPLC conditions using PDA detector to ensure spectral homogeneity and peak purity. Potential degradation of bicalutamide is observed
in alkali (1 N NaOH at benchtop)- Fig. 2b. No
significant degradation is obtained with rest of the stress conditions, like thermal, photolytic, acid, peroxide and water hydrolysis, Figure 2. Based on
earlier published methods on RP-HPLC 1 it is
evident that bicalutamide degrades to its starting material at alkali stress conditions. But few more
peaks >1.5% were retained and well separated from main peak which were not noticed earlier in HPLC methods, here by this indicates superior stability indicating capability of the current studied RP-UPLC method. Blank and placebo doesn’t show any interference at retention time of main peak. Spectral purity of the peak and no impact of assay of bicalutamide under the presence of its
degradation products confirm the
stability-indicating capability of the developed method.
Refer Table 4.
TABLE 4: STRESS STUDIES
Stress Condition % Degraded
Purity Angle*
Purity Threshold*
Purity Flag*
Purity Error*
Unstressed Sample 0.0 0.249 0.451 No No
Acid Stressed Sample 0.41 0.265 0.464 No No
Alkali Stressed Sample 6.97 0.249 0.474 No No
Peroxide Stressed Sample 0.0 0.235 0.460 No No
Photo Stressed Sample 0.0 0.240 0.480 No No
Hydrolysis Stressed Sample 0.0 0.251 0.461 No No
Thermal Stressed Sample 0.0 0.243 0.473 No No
FIG. 2: TYPICAL CHROMATOGRAMS OF STANDARD, ALKALI STRESSED, ACID STRESSED, PEROXIDE STRESSED, THERMAL STRESSED, HYDROLYSIS STRESSED, PHOTO STRESSED AND UNSTRESSED TEST SAMPLES ALONG WITH PEAK PURITY PLOTS.
Solution Stability and Mobile Phase Stability:
The results from solution stability and mobile phase stability experiments confirmed that standard and test solutions were stable up to 48 for assay which is within ±1%, when compared with initial assay. System suitability parameters were passed for standard with mobile phase at 48 hours
stability. Refer Table 1.
Robustness:
System suitability parameters were passed with varied chromatographic conditions (flow rate, column temperature) and found within the acceptance criteria. This proves that this method is robust for deliberate changes in chromatographic
conditions. Refer Table 5.
TABLE 5: ROBUSTNESS
Parameter RT*
% RSD
(n=5)** USP Tailing
USP Plate count 0.45ml/min flow rate 1.732 0.29 1.25 7810 0.55ml/min flow rate 1.417 0.47 1.24 7620 35ºC Column temperature 1.573 0.36 1.25 7303 45ºC Column temperature 1.496 0.73 1.24 7551 * retention time in minutes, ** For standard peak
Suitability of the method for Dissolution analysis: According to FDA-OGD (office of generic drugs), the dissolution of bicalutamide tablets is performed by using 1% SLS solution in
[image:7.612.109.503.53.399.2]For dissolution, Lab India Model DS 8000 manual dissolution system is used. Sodium lauryl sulphate >99% Purity is procured from Merck Ltd, Mumbai. Dissolution media is prepared by dissolving 100g Sodium lauryl sulphate in 10litre demineralised water.
Standard preparation: A stock solution of bicalutamide working standard is prepared by dissolving appropriate amount of respective drug in diluent used for assay followed by further dilution with dissolution medium to meet concentration of
50µg/ml. Performed dissolution by setting
dissolution apparatus at OGD parameters and dropped one tablet in each vessel (n=6) containing 1000ml dissolution media. After single time point-45minutes (Q point), retrieved sample from each vessel, filtered through 0.45 PVDF syringe filter. 100% accuracy sample is performed in triplicate by spiking Bicalutamide API and placebo equalent to one tablet to the dissolution vessel containing 1000ml medium and performed analysis at mentioned dissolution conditions.
Retrieved 10ml sample after 45minutes time point through a syringe and cannula, filtered through 0.22µ PVDF filter. Analysed the samples against standard at mentioned assay method by UPLC, at an injection volume of 4µL keeping rest of the chromatographic conditions same.
Linearity: Linearity is performed by diluting stock solution at five concentration levels ranging from 10 to 170% of test concentration (5, 12.5, 25, 50 and 85µg/ml). The peak area versus concentration data is treated by least-squares linear regression analysis and Slope, Y-Intercept, and coefficient of correlation is evaluated.
[image:8.612.107.506.380.592.2]Solution Stability: Required aliquots of Standard and samples were stored in closed containers and rested on bench top for 24 hours. After hold time, samples and standard were analysed and % difference were compared with freshly prepared standard.
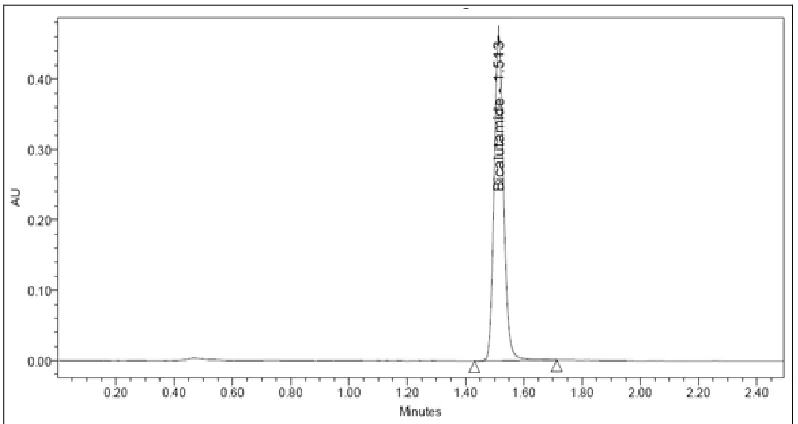
FIG.3: TYPICAL CHROMATOGRAM OF DISSOLUTION TEST SAMPLE.
RESULTS AND DISCUSSION:
System suitability of standard is found within acceptable criteria and satisfactory recovery at 100% level is achieved. All tablets (n=6) has passed Q point 85% at 45 minutes with % drug release >90%. The linearity calibration plot for the method is obtained over the calibration ranges tested, i.e. 5–85 µg/ml and correlation coefficient
obtained is greater than 0.999 for Bicalutamide peak. The result shows that a significant correlation existed between the peak area and concentration of the analyte in dissolution medium. Results of Solution stability of Standard and sample after 24
hours are within the limits. Refer Fig.3, Table 6a,
TABLE 6 a: DISSOLUTION-ACCURACY AND SOLUTION STABILITY
RT* % RSD**
USP
Tailing Recovery Level
%added (µg/ml)
%Found
(µg/ml) % Recovered***
(n=6) (n=6) (n=6) (n=3) mean mean Mean/%RSD
1.57 0.2 1.12 100% Spiked Sample 50.3333 50.2903 99.91/0.96
* Retention time, ** Acceptance Limits: Assay = 97% to 103% for n=3 test preparations and % RSD ≤ 2.0.
Solution Stability: For Standard-Similarity Factor: New vs 24 Hours Standard: 1.004 (limit: 0.98 to 1.02). For sample % Difference: Initial vs 24 Hours Sample: 0.702 (Limit: ± 2.0%).
TABLE 6 b: % DRUG RELEASE BY DISSOLUTION AT Q POINT.
% drug release Tab-1 Tab-2 Tab-3 Tab-4 Tab-5 Tab-6 Mean % RSD
Q-85% in 45 minutes 93.7 94.8 95.6 92.9 95.1 96.2 94.7 1.29
TABLE 6 c: DISSOLUTION-LINEARITY
Linearity Range Slope Y-Intercept r 2*
5 to 85 µg/mL 20981.935 3349.195 0.999927
* Coefficient of Correlation: Limit: >0.999
Suitability of the method for Residue analysis (cleaning validation):
After manufacturing a batch, once the equipment is cleaned through an approved procedure, swabbing at specified positions of the equipment will be performed followed by LC analysis. Determining the % residue left over in order to qualify equipment at manufacturing area is one of the cGMP and regulatory requirements. High sensitive LC method to be developed to determine the concentration of the residue which will be in very less ppm (parts per million) such that achieving
reproducibility of response with symmetric peak shape is critical. For current work, considering worst case scenario of least concentration of 0.5µg/ml with 6µL of injection volume with
suitable peak response, reproducibility and
[image:9.612.113.499.447.739.2]recovery of residue on two different surfaces were evaluated. Standard preparation: A stock solution of bicalutamide working standard is prepared by dissolving appropriate amount of respective drug in diluent used for assay followed by further dilutions to meet concentration of 0.5µg/ml.
Pretreatment of swabs:
Texwipe TX761 swab were washed thoroughly twice in 1:2 water: Acetonitrile, followed by washing twice with acetonitrile and dried completely to remove any leachable from swab. Dispersed 1ml of the stock solution of 5µg/ml in methanol using a pipette on the surface of a stainless steel plate of 5 x 5 cm and dried using a drier. In a test tube containing 10mL 1:2 water:
[image:10.612.49.568.199.248.2]methanol, dipped pre-treated Swab and squeezed to wall of the test tube. Swiped the wet swab on the spiked and dried steel plate in specified directions and dipped in test tube. Closed the test tube with lid and sonicated for 5 minutes and analysed the samples against standard solution and determined % recovered. Same procedure is followed for swabbing on Class-A glass plate of 5 x 5 cm.
TABLE 7: RESIDUE ANALYSIS RT* (n=6) % RSD** (n=6) USP Tailing (n=6)
Residue Recovery on two surfaces
% added (µg/ml)
% Found
(µg/ml) % Recovered***
1.54 6.2 1.3 Stainless steel 0.50096 0.46508 92.84
Class-A Glass 0.50096 0.46216 92.25 * Retention time, ** for standard Acceptable limit: <15%, *** Acceptable limit: >85%.
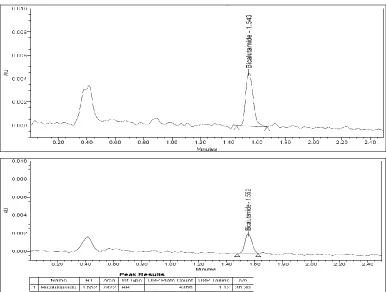
RESULTS AND DISCUSSION: System
suitability passed with satisfactory USP tailing and %RSD for replicate injections (n=6) of standard solution (0.5µg/mL) were within acceptable limits. Greater than 90% drug residue is recovered on both
stainless steel and glass surfaces. Refer Table 7.
Limit of quantification is achieved at 0.23µg/mL
with signal to noise ratio greater than 10. Refer Fig.
3b, 3c.
CONCLUSIONS: The rapid simple isocratic stability indicating RP UPLC method developed with shortest runtime of 2.5 minutes for estimation of assay of bicalutamide from finished dosage forms in presence of forced degradation products is specific, precise, accurate, linear and robust. Satisfactory results were obtained from validation of the method. Adaptability of same method for evaluation of dissolution and residue analysis found suitable. The method is stability-indicating and can be used for routine analysis of developmental, stability and production samples.
ACKNOWLEDGEMENT: The author wish to
thank the department of biochemistry, Nagarjuna University for guidance and supporting this work and cooperation from friends and colleagues in gathering and procurement of materials is appreciated.
REFERENCES:
1. Saravanan, G., Rao, B.M., Ravikumar, M., Suryanarayana, M.V., Someswararao, N. Acharyulu, P.V.R.; A stability-indicating LC assay method for bicalutamide; Chromatographia, 2007; 66: 219–222.
2. V.V.S.S. Raman Nanduri*, V.S.S. Prasad Adapa and Ratnakar Reddy Kura: Development and Validation of Stability-Indicating HPLC and UPLC Methods for the Determination of Bicalutamide: Journal of Chromatographic Science 2012;50:316–323
3. Nageswara Rao, R., Narasa Raju, A., Narsimha, R.; Isolation and characterization of process related impurities and degradation products of bicalutamide and development of RP-HPLC method for impurity profile study; Journal of Pharmaceutical and Biomedical Analysis, 2008; 46: 505–519.
4. International Conference on Harmonisation. Guideline on Validation of Analytical Procedures; Q2 (R1).
5. United States Pharmacopeia. The United States Pharmacopeial Convention, Rockville, MD; 34, 2040.
6. Pharmeuropa. European Directorate for the Quality of Medicines & Health Care, Council of Europe, France, 20: 264.
7. Dantu Durga Rao, Galla Vamsi Krishna, A. Malleswara Reddy, L. Kalyanaraman & K. Kyas (2012): A single common stability indicating ultra performance liquid chromatographic method for determination of related substances and assay of four angiotensin II receptor blockers from finished dosage forms: Journal of Liquid Chromatography & Related Technologies, 35:14, 1973-1989 http://dx.doi.org/10.1080/10826076.2011.627615. 8. www.rxlist.com,www.drugbank.com,www.drugs.co
m online searches.
9. Russo, R.; Guillarme, D.; Nguyen, T-T. D.; Bicchi, C.; Rudaz, S.; Veuthey, J. L. Pharmaceutical Applications on Columns Packed with Sub-2 mm Particles. J. Chromatogr. Sci. 2008, 46, 199–208. 10. Nguyen, D. T.; Guillarme, D.; Rudaz, S.; Veuthey, J.
L. Fast Analysis in Liquid Chromatography Using Small Particle Size and High Pressure. J. Sep. Sci. 2006, 29, 1836–1848.
Particles and Higher Pressure. Anal. Chem. 2005, 77, 460A–467A.
12. Villiers, A. D.; Lestremau, F.; Szucs, R.; Gelebart, S.; David, F.; Sandra, P. Evaluation of Ultra Performance Liquid Chromatography: Par I. Possibilities and Limitations. J. Chromatogr. A. 2006, 1127, 60–69.
13. Wren, S. A. C.; Tchelitcheff, P. Use of Ultra-Performance Liquid Chromatography in Pharmaceutical Development. J. Chromatogr. A. 2006, 1119, 140–146.
14. ICH Q1A (R2). Stability Testing of New Drug Substances and Products; Geneva 2000.
All © 2013 are reserved by International Journal of Pharmaceutical Sciences and Research. This Journal licensed under a Creative Commons Attribution-NonCommercial-ShareAlike 3.0 Unported License.
This article can be downloaded to ANDROID OS based mobile. Scan QR Code using Code/Bar Scanner from your mobile. (Scanners are available on Google Playstore)
How to cite this article: