Munich Personal RePEc Archive
What Lies Beneath: Foreign Exchange
Rate Exposure, Hedging and Cash Flows
Bartram, Söhnke M.
Lancaster University
31 July 2007
Online at
https://mpra.ub.uni-muenchen.de/6661/
What Lies Beneath:
Foreign Exchange Rate Exposure, Hedging and Cash Flows
Söhnke M. Bartram*
Abstract
This paper presents results from an in-depth analysis of the foreign exchange rate exposure of a large nonfinancial firm based on proprietary internal data including cash flows, derivatives and for-eign currency debt, as well as external capital market data. While the operations of the multina-tional firm have significant exposure to foreign exchange rate risk due to foreign currency-based activities and international competition, corporate hedging mitigates this gross exposure. The analy-sis illustrates that the insignificance of foreign exchange rate exposures of comprehensive perform-ance measures such as total cash flow can be explained by hedging at the firm level. Thus, the re-sidual net exposure is economically and statistically small, even if the operating cash flows of the firm are significantly exposed to exchange rate risk. The results of the paper suggest that managers of nonfinancial firms with operations exposed to foreign exchange rate risk take savvy actions to reduce exposure to a level too low to allow its detection empirically.
Keywords: Foreign exchange rates, exposure, risk management, cash flow, derivatives, corporate finance
JEL Classification: G3, F4, F3
First version: October 1, 2005
This version: July 31, 2007
*
Lancaster University, Management School, Department of Accounting and Finance, Lancaster LA1 4YX, United Kingdom, phone: +44 (15 24) 592 083, fax: +1 (425) 952 10 70, Email: <[email protected]>, Internet: <http://www.lancs.ac.uk/staff/bartras1/>.
What Lies Beneath:
Foreign Exchange Rate Exposure, Hedging and Cash Flows
1 Introduction and Motivation
Since many currencies became freely floating after the breakdown of the Bretton Woods system in the
mid 1970s, changes in exchange rates have been a major risk to nonfinancial corporations around the
world. Particularly for firms with foreign currency-based activities, such as imports and exports,
corpo-rate cash flows and thus firm value are a function of exchange corpo-rates, rendering the management of
for-eign exchange rate risk an important corporate objective and activity. To illustrate, higher cash flow
volatility due to exchange rate risk may lead to reductions in firm value if firms face constraints on their
internal financing and, as a consequence, incur either higher costs of raising external funds or
opportu-nity costs of forgone profitable investment projects (Froot et al., 1993). While the effect of exchange rate
risk on the stock price of nonfinancial firms has been shown to depend on a variety of firm
characteris-tics, most empirical studies report only a small number of firms with significant foreign exchange rate
exposure. Consequently, researchers have come to conclude that, somewhat surprisingly, the effect of
exchange rate changes on firm value is economically and statistically small (Griffin and Stulz, 2001).
To this end, this paper contributes to the literature by presenting an in-depth analysis of the
for-eign exchange rate exposure of the cash flows of a large nonfinancial corporation and its ability to hedge
this exposure using proprietary corporate data including cash flows, derivatives and foreign currency
debt. As Bodnar and Wong (2003) point out, the unavailability of suitable cash flow data makes the
analysis of cash flow exposures generally impossible, and, as a consequence, studies of foreign exchange
rate exposures typically use stock returns to proxy for changes in cash flows. Nevertheless, it is
impor-tant to note that the early, mostly theoretical work on foreign exchange rate exposure is based on
corpo-rate cash flows (e.g. Flood and Lessard, 1986; Adler and Dumas, 1984; Hodder, 1982; Shapiro, 1975).
These seminal papers relate firm value as the present value of all future cash flows as well as cash-flow
volatility to the extent of foreign business (such as exports and imports) or competition of the firm.
based on cash flow volatility as well (Smith and Stulz, 1985; Froot et al., 1993). Given that it is difficult
to tailor operational hedging to the particular needs of a firm, operating cash flow exposure is something
many firms must live with, and they can try to hedge this exposure in financial markets. The paper
ana-lyzes a case where the success of such efforts can be evaluated based on data that are rarely available.
While the previous literature has documented the corporate use of different hedging tools in
gen-eral, little detail is available for large samples of firms. Consequently, this paper documents and
exam-ines the nature and effects of corporate risk management practices in a way that cannot be employed for
a large sample, showing in detail how nonfinancial firms conduct financial risk management and what
the effects are on the sensitivity of cash flows and firm value with regards to exchange rate risk. In
par-ticular, the foreign-currency based activities of the firm are analyzed in order to identify the currencies
that are the most important sources of exchange rate risk of the firm, yielding large gross exposures. For
these currencies, foreign exchange rate exposures are estimated for different cash flows such as cash
flows from operations, cash flows from investment activities, cash flows from financing activities and
total (net) cash flows. In this context, the effect of operational hedging (foreign assets and operations)
and financial hedging (foreign currency debt and derivatives) is considered. The results document that
corporate cash flows are affected by foreign exchange rate risk, but that they are coordinated in a way
that total (net) cash flows exhibit only small foreign exchange rate exposures and low cash flow
volatil-ity. Finally, stock price exposures are estimated for the same firm. Similar to total cash flows, the
expo-sures of stock returns to the foreign exchange rates most important for the firm as well as to a foreign
exchange rate index are economically and statistically small.
The paper thus illustrates how corporations use hedging tools to reduce the exposure of their
op-erations to such an extent that the remaining net exposures are hard to identify in empirical analyses. The
results are consistent with cash flow variability being a major concern of companies when considering
value, firms with operations that are heavily affected by exchange rate changes (i.e. firms with large
gross exposures) will engage in risk management activities to an extent that the residual exposure is
small. Consequently, both firms with and without operations exposed to exchange rate risk are likely to
show insignificant residual exposures.1
The remainder of the paper is organized as follows. Section 2 discusses related research, while
Section 3 describes the methodology used to estimate cash flow and stock price exposures. The company
examined in the clinical study is characterized in Section 4, and Section 5 describes the data set. Section
6 presents and discusses the results, and Section 7 concludes.
2 Extant Evidence of Foreign Exchange Rate Exposure
The early research on foreign exchange rate exposure goes back to seminal work by Adler and Dumas
(1984), who define exchange rate exposure as the effect of unexpected changes in foreign exchange rates
on cash flows and, by extension, firm value. Jorion (1990) first tested this phenomenon for a sample of
287 U.S. multinational firms in a regression of stock returns on changes in a foreign exchange rate index
and, as a control variable, the market index. The results show that only few firms, namely 15
(represent-ing 5.2% of the sample), have a statistically significant foreign exchange rate exposure at the 5%
signifi-cance level. These findings have been perceived as surprising and, thus, have motivated a large body of
empirical work investigating the effect of exchange rate changes on stock returns using a variety of
al-ternative approaches with regards to methodology and data (see Bartram and Bodnar (2004) for a
re-view). In contrast, due to data unavailability, there exists only very sparse evidence regarding the effect
of exchange rate risk on corporate cash flows. To illustrate, the foreign exchange rate exposure of
1
can Materials Company is analyzed in a regression of changes of the company’s quarterly operating cash
flows on changes in the USD/GBP exchange rate (Garner and Shapiro, 1986). The results show
eco-nomically and statistically small foreign exchange rate exposures. Oxelheim and Wihlborg (1995) use
quarterly changes of total cash flow, commercial cash flow and sales revenue in their exposure analysis
of Volvo Cars. They find that the financial position of the firm lowers the DEM/SEK exchange rate
ex-posure only to a modest degree. However, for a sample of 40 U.S. manufacturing firms, total cash flows
show lower foreign exchange rate exposures than commercial cash flows using percentage changes of
annual total and commercial cash flows (Oxelheim and Wihlborg, 1987), suggesting hedging effects of
financial cash flows. This is consistent with the result of the clinical study of a U.S. multinational by
Brown (2001) that the foreign exchange hedging policies of corporations aim to stabilize corporate cash
flow, motivating the study of various cash flow exposures at the company-level pursued in this paper.
3 Estimating Foreign Exchange Rate Exposure
The availability of proprietary internal cash flow data of a nonfinancial firm allows conducting an
expo-sure analysis in the spirit of the original work on foreign exchange rate expoexpo-sure, which characterizes
exposure as the elasticity of corporate cash flows with regards to unexpected exchange rate changes
(Adler and Dumas, 1984). Consequently, the following regression can be estimated, as suggested in the
literature:
N (i)
t i FX,t 1 ST,t 2 DS, i 1
CF R R R
= t t
= α +
∑
δ + φ + φ + ε (1)where CFt denotes a cash flow variable, and is the relative change in foreign exchange rate i. The
model employs alternatively a foreign exchange rate index or a set of the bilateral exchange rates most
relevant for the firm based on its operating characteristics (see Section 4). A short-term interest rate
vari-able (R
(i) FX,t
R
ST,t) and a term-spread variable (RDS,t) are employed as control variables. They are defined as
the change in the term spread divided by one plus the long-term rate, where the term spread is defined as
the difference between the long-term rate and the short-term rate.2 The regression coefficients of the
ex-change rate variables capture the sensitivity of the respective cash flow to an exex-change rate ex-change and,
thus, represent a measure of foreign exchange rate exposure.3 Stulz and Williamson (1997) use a similar
framework to regress the change in cash flow of a manufacturing firm on changes in the prices of
alumi-num and copper. Similarly, Bartov and Bodnar (1994), Oxelheim and Wihlborg (1995) and Garner and
Shapiro (1984) employ changes in corporate cash flow variables as regressands for contemporaneous
(and lagged) exchange rate changes.
The advantages of this cash flow regression consist of the fact that the estimated effects of
ex-change rate risk on corporate cash flows are independent of the perception of market participants and
their understanding of the relevance of exchange rate risk for the company. Another benefit of a cash
flow approach is that various alternative cash flow variables can be employed. In particular, it can be of
interest to analyze different cash flows, such as cash flows from operating activities, cash flows from
financing activities and cash flows from investment activities, as well as total cash flow. This allows
studying the components and sources of exposure as well as hedging effects of different cash flows. In
particular, cash inflows in foreign currency such as from export sales will generally lead to positive
ex-posures, while cash outflows in foreign currency such as from raw material purchases typically have a
negative exposure.
2
Defining the interest rate variables this way has the advantage that the sum of them is the change in long-term rate divided by one plus the long-term rate, i.e. a measure that could be used to empirically estimate duration with one interest rate variable. Papers that investigate the interest rate exposure of firms use similar variables such as the percentage change in the short-term rate, the change in long-term yield, the holding period return on a default-free bond, or term-structure vari-ables.
3
Thus, depending on the currency mix, cash flow variables combining cash inflows and outflows
will exhibit positive or negative exposures. Currency matching of inflows and outflows may cancel out
exposures and effectively lead to small or zero remaining exposure. Hedging effects of this nature could
be the result of natural hedges, such as sales and raw material purchases being determined by the same
currencies, or they may occur by construction, such as when a company issues foreign currency debt or
employs derivatives to purposely offset existing operating exposures. In principle, the operating cash
flow will reflect the gross exposure of a firm’s operations in general and its foreign sales in particular,
net of operational hedging (foreign currency costs), pass-through and currency diversification. Changes
in asset values are captured by cash flows from investing activities, and cash flows from financial
in-struments are part of the company’s cash flow from financing activities. Therefore, if a company uses its
financial policy for hedging purposes, the sign of the financing exposure should be opposite that of the
operating exposure. Effective corporate hedging would be consistent with total cash flows being (largely)
unaffected by foreign currency movements. Nevertheless, it is difficult to predict the relative size of
ex-posures of different cash flows, given the effect of leverage on exposure, the possibility of firms taking
bets with derivatives (on direction or volatility), possibly even under the guise of hedging, difficulties of
measuring the hedging effects of foreign currency debt for cash flows, etc.
In addition to estimating cash flow exposures, the availability of stock price data allows
employ-ing the regression framework commonly used in the academic literature, where stock returns are
re-gressed on exchange rate changes and control variables. In particular, the following regression model is
used following Jorion (1990):
N (i)
t m,t i FX,t 1 ST,t 2 DS,t
i 1
R R R R R
=
= α + β +
∑
δ + φ + φ + εt (2)where Rt denotes the excess stock return on the company, Rm,t is the excess return on a market index and
unavailability of suitable corporate cash flow data), virtually all academic studies employ this model to
estimate exposure. Note that stock returns represent changes in firm value. At the same time, the value
of the firm is nothing other than the present value of all current and future (net) cash flows. Therefore,
there is natural link between regression models (1) and (2).4 Since cash flow volatility may be costly in
the presence of capital market imperfections such as bankruptcy costs, convex tax schedules (Smith and
Stulz, 1985), or underinvestment problems (Bessembinder, 1991; Froot, Scharfstein, and Stein, 1993),
there are economic rationales for firms to be concerned with cash flows as well as value (Starks and
Wei, 2006). Therefore, both approaches are important and relevant in their own right.
Note also that the stock return is a comprehensive measure of corporate performance that is
ag-gregated across time and space and incorporates all effects of currency matching and diversification,
op-erational and financial hedging, pass-through, etc. As such, stock return exposures (and similarly total
(net) cash flow exposures) allow only capturing net or post-hedging exposures.5 As a consequence, these
residual exposures may be too small to be detected empirically if managers act rationally and take
effec-tive exposure-reducing measures in case the operations of their firm are sensieffec-tive to exchange rate risk,
i.e. if the firm has gross foreign exchange rate exposure.
4 VEBA Corporation
The clinical study in this paper is based on the German multinational company VEBA AG (“Vereinigte
Elektrizitäts- und Bergwerks-Aktiengesellschaft”), a conglomerate with a high degree of industrial
di-versification.6 Its main industry sectors are chemicals and allied products, freight transportation,
petro-leum products and refining, and utilities. Further business areas include real estate management,
4
Given common practice to use the return on the market index as a control variable in the stock return regression, the coeffi-cients of the exchange rate variables reflect exchange rate exposures over and above what is captured by the market index.
5
Exposure of total cash flow and stock returns may differ due to differences in time horizon, flexibility of operations in the longer, but not in the short term, non-random walks, mean reversion in exchange rates, etc.
6
communications, silicon wafers and electronics. With total sales of around € 42.8 billion and over
131,000 employees, VEBA AG is the fifth-largest publicly traded German company as of December
1998 and as such a member of the DAX. Table 1 shows the geographic scope of VEBA’s operations.
The company generates sales all over Europe, the Americas, Asia, and South Africa. The table shows the
local currencies of the countries where VEBA has operations, and the currencies of the resulting
expo-sures, taking into account linkages between currencies (such as currency pegs). Of the set of relevant
currencies, eight are pegged to the U.S. Dollar or the SDR. Another eight currencies maintain some form
of currency peg to the Deutsche Mark or are part of the European Monetary System (EMS).
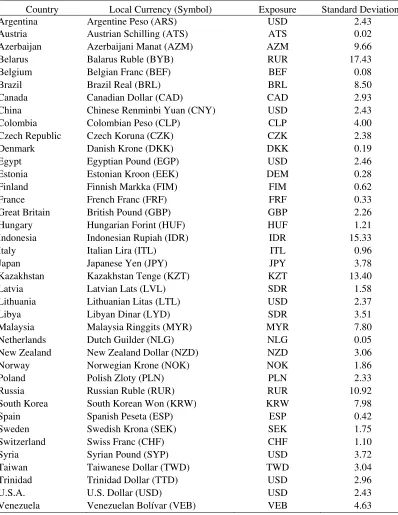
Two factors are generally important for a company to have an economically important foreign
exchange rate exposure: The relevant exchange rate has to be volatile, and/or the cash flows affected
have to be large. Therefore, Table 1 also presents the standard deviations of the changes in the exchange
rates of the local currency relative to the German Mark. It documents that exchange rate risk differs
sig-nificantly across the various foreign countries. Given that the sample period includes the Asian crisis, the
Russian crisis and the (beginning of the) Brazilian crisis, it is not surprising that many Asian currencies,
the Russian Ruble as well as Latin American currencies show the highest standard deviations. At the
same time, even major international currencies like the U.S. Dollar (2.4), the British Pound (2.3) and the
Japanese Yen (3.8) show quite high volatility, potentially giving rise to important exposures to the
re-spective exchange rates. In contrast, EMS currencies show little variation and are therefore less likely to
cause large foreign exchange exposures.
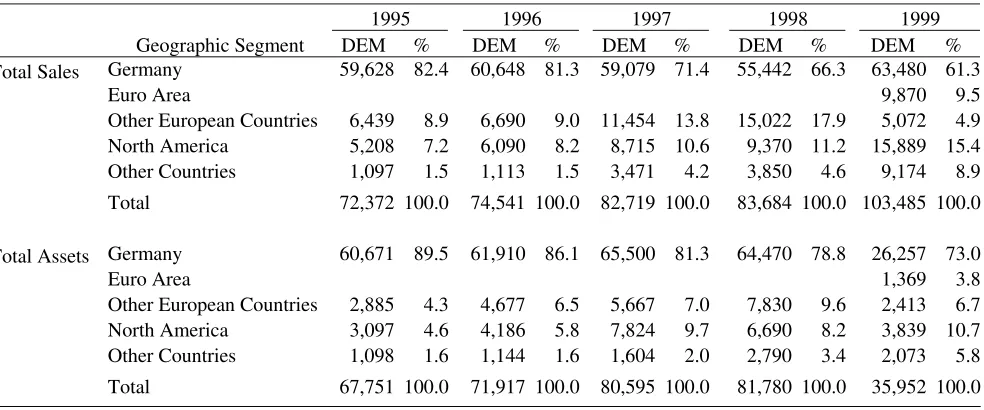
In order to gauge the absolute and relative importance of the cash flows in foreign currency as a
source of exchange rate exposure, Table 2 reports VEBA’s sales and total assets by geographic segment.
While the company naturally has large domestic sales and assets, it also has important foreign business,
particularly in other European countries (14% of sales and 7% of total assets in 1997), North America
1995-1999 period, the proportion of foreign sales as well as foreign assets increased significantly (from
18% to 39% and from 11% to 27%, respectively). Given the skewed distribution of foreign activity, the
degree of geographic diversification appears smaller than one might have believed from Table 1.7
Considering VEBA’s extensive petrochemical operations, the U.S. Dollar is likely to be one of
the most important sources of its foreign exchange rate exposure. Moreover, the company‘s operations
and recent investments in Scandinavia, notably in oil-related projects in Norway and in the electricity
market in Sweden, suggest important exposures to the Swedish Krona and the Norwegian Krone.
Fur-thermore, the British Pound is likely another source of significant exposure due to the company’s
tele-communications and utility business. Finally, East Asia, notably Japan, is important for VEBA in terms
of its operations, customers and sourcing, which suggests the Japanese Yen as an important source of
exposure.
Expectations on the direction of the exposure of VEBA are derived from the nature and the
de-velopment of its business within the different currency areas. First, exposure to the U.S. Dollar is
ex-pected to be negative. This is mainly due to two factors. First, most of the inputs of VEBA’s large
petro-chemical business such as crude oil and oil derivatives are denominated in U.S. Dollars, while the
mar-kets for its outputs, such as chemicals and petrol, are mainly outside the United States. Second, its
opera-tions in the United States experienced operating difficulties and several restructurings, which negatively
affected VEBA’s operating cash flow and stock market value. This is in contrast to its exposure to
Brit-ain, Sweden and Norway, where VEBA successfully sells electricity produced by its German power
plants. Thus, as an exporter to these markets, VEBA’s operating cash flow is likely positively exposed to
these three currencies. Finally, while VEBA has some chemical operations in Japan, it also uses this
market to source some of its electronics inputs, so that the sign of the exposure to the Japanese Yen is
7
difficult to predict.
For the analysis of exchange rate exposures, it is also important to consider all corporate
activi-ties that likely reduce the gross exposure originating from foreign business activiactivi-ties. To this end,
opera-tional and financial hedging activities at the corporate level are relevant. With regards to operaopera-tional
hedges, Table 2 reveals that VEBA has high concentrations of foreign assets in countries/regions where
it also has high foreign sales. Foreign assets may proxy for foreign production and thus indicate that the
company has not only revenue, but also cost in foreign currency, which establish natural hedges. These
effects reduce the sensitivity of the firm’s operating cash flow to exchange rate risk (relative to the firm
not having such operational hedges).
Firms typically employ operational hedges to reduce the long-term exposures of future cash
flows, while the flexibility of financial instruments such as derivatives is used to complement and
fine-tune operational hedging measures. VEBA is no exception, as it employs foreign currency derivatives as
well as foreign currency debt. The corporation pursues systematic and group-wide foreign exchange risk
management with the objective of limiting its exposure to exchange rate fluctuations, which it also states
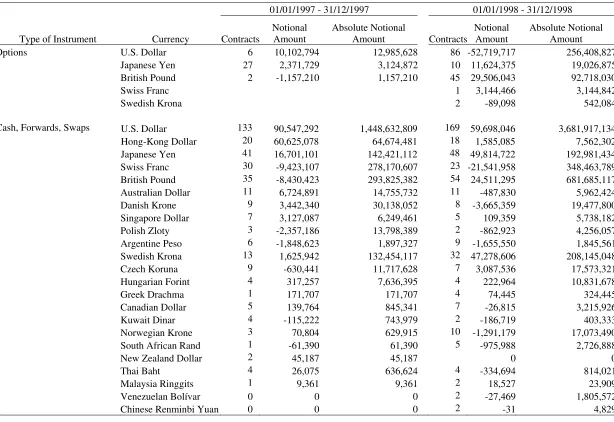
in its annual report. To illustrate, Table 3 shows VEBA’s positions in cash and derivatives instruments
for foreign currency that are expiring in the years 1997 and 1998 by type of instrument and currency of
denomination. Consistent with the above risk management objective, the largest foreign currency
trans-actions are in the currencies to which the company is most exposed, i.e. the U.S. Dollar, Japanese Yen,
British Pound, and the Swedish Krona. The Swiss Franc is another important currency of denomination,
which is consistent with important operations in Switzerland. While transactions in currency options are
limited to these currencies, VEBA actually engages in instruments with linear payoff profiles (i.e. cash,
forward and swaps) for a quite extensive range of currencies, mostly in currencies of countries where it
indeed has foreign operations, including the Argentine Peso, Australian Dollar, Canadian Dollar,
Forint, Kuwait Dinar, Malaysia Ringgit, New Zealand Dollar, Norwegian Krone, Polish Zloty,
Singa-pore Dollar, South African Rand, Thai Baht, and the Venezuelan Bolívar.8 In addition to currency
de-rivatives, VEBA also employs foreign currency debt, mostly in U.S. Dollars, British Pound, Japanese
Yen, Swiss Franc, Norwegian Krone, and Swedish Krona, which provides another source of financial
hedging.
5 Data Sources
The analysis of cash flow exposures in this paper is based on a proprietary data set of monthly cash
flows as well as information on derivatives’ transactions and foreign currency debt from the Treasury
Department of VEBA for the period January 1996 to December 1999. Most importantly, detailed cash
flow data are available for the cash flow from operating activities, the cash flow from investing
activi-ties, the cash flow from financing activities and total cash flow. Following common practice, cash
in-flows and outin-flows are classified according to the activity to which they relate (see e.g. Sutton, 2000). In
particular, the Operating Cash Flow (OCF) captures cash flows related to a firm’s operating activities,
such as revenue from the sale of goods and other receipts, as well as related costs such as salaries,
sup-plies, utilities and other operational expenses.
The cash flow from investing activities reports the total change in a company's cash position
re-sulting from any gains (or losses) from investments in financial markets and operating subsidiaries, and
changes resulting from amounts spent on investments in capital assets such as plant and equipment.
Therefore, the Investment Cash Flow (ICF) reflects investment activities such as the purchase or
divest-ment of fixed (tangible and intangible) assets, the acquisition/sale of consolidated subsidiaries, interests
in unconsolidated subsidiaries or participations, etc. Finally, the Financing Cash Flow (FCF) pertains to
8
the firm’s financing activities and thus captures for instance cash flows originating from the
in-crease/decrease of capital, short-term and long-term loans and deposits, acceptance credit, interest and
dividend payments and includes the effects of financial hedging (i.e. derivatives and foreign currency
debt).9 By definition, the Total Cash Flow (TCF) is the combination of the cash flows from operating,
investing and financing activities. Changes in these measures are scaled by total sales to create the
de-pendent variables for the cash flow regressions.10
Further information about VEBA and its competitive environment is obtained from the Treasury
Department and internal reports, annual reports, analysts’ reports, publications in industry magazines
and practitioner articles. Additional accounting data is from Thomson Analytics OneBanker. All capital
market data are obtained from Datastream in monthly frequency. These are total return indices for
VEBA stock as well as for the value-weighted stock market index of Germany. Excess returns are
calcu-lated as the log-difference in the total return indices minus the risk-free rate. The short-term rate is the
three-month Euro-Mark interest rate, and the long-term rate is the ten-year government benchmark bond
yield.
The exchange rate variables are calculated as log-differences in the exchange rates (in Deutsche
Mark relative to foreign currency), in particular of the U.S. Dollar (USD), the British Pound (GBP), the
Japanese Yen (JPY), the Swedish Krona (SEK), the Norwegian Krone (NOK) and the trade-weighted
exchange rate index of the German Mark from the Bank of England. All data used in the study are
9
One might also consider alternative definitions of these cash flows, for instance combining ICF with changes in long-term debt and equity. Note that hedging effects of foreign currency debt may also take the form of capital gains and losses on long-term debt, which are more difficult to measure.
10
nominated in Deutsche Mark.11 Panel A of Table 4 shows summary statistics of the main variables. The
cash flow variables, particularly cash flows from investing activities and cash flows from financing
ac-tivities are more volatile than stock returns, while the operating cash flow variable has a smaller standard
deviation. As a consequence of the significant investing activities of the firm, the mean values of the
cash flow variables are negative, resulting on average in investing cash outflows and slight decreases in
the operating cash flow and total cash flow during the sample period.12
The return on VEBA stock has been positive on average during the sample period, yielding
0.65% per month. At the same time, the German market index has performed even better (1.72% per
month). The larger degree of diversification of the German market index is reflected in its lower
stan-dard deviation compared to VEBA (5.62% vs. 6.99%). The summary statistics on the exchange rate
variables document that the German Mark has been depreciating against the selected currencies as well
as the trade-weighted currency basket over the sample period. The short-term interest rate variable has
mean and median values of close to zero, indicating that short-term rates changed little on average. The
negative value of the term-structure variable shows that spreads between long-term rates and short-term
rates decreased during the sample period.
Given that the Euro was introduced in 1999, which had important effects on market betas and
ex-change rate exposures (see Bartram and Karolyi, 2006), all regressors also enter the regression equations
interacted with a dummy variable for the Euro effect. In order to accommodate the fact that the
introduc-tion of the Euro may have been anticipated to some extent, we follow other papers, such as Bris et al.,
11
Note that the data are nominal, i.e. not adjusted for inflation. Studies that examine the effect of inflation on exchange rate exposure typically find that this effect is negligible (e.g. Bodnar and Wong, 2003; Choi and Prasad, 1995; Booth and Roth-enberg, 1990).
12
(2003) and use January 1, 1998 as the effective date of the Euro introduction.13 Moreover, cash flow
re-gressions use monthly dummy variables to control for potential seasonality effects in the data, even
though the high degree of industrial diversification should attenuate potential seasonal effects.14
6 Results and Discussion
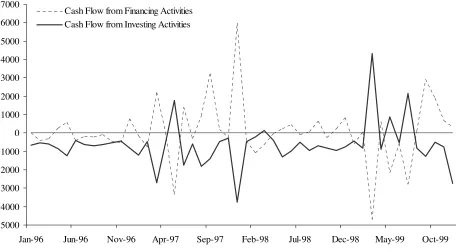
The time-series pattern of the different corporate cash flows is shown in Figure 1, and Table 4 (Panel B)
characterizes the relationship between these cash flows by their correlation coefficients. Several
interest-ing observations can be made: First, it is apparent that the cash flows from financinterest-ing and investinterest-ing
ac-tivities are fairly volatile. This is likely due to large investments and restructurings that VEBA was
un-dertaking between 1996 and 1999. Second, it is apparent that financing and investing cash flows are
largely offsetting, suggesting that the need and availability of funds are highly synchronized. Indeed, the
correlation between the changes in these cash flows is –0.89.
In contrast to the investing and financing cash flows, the cash flow from operating activities is
very stable, reflecting the high degree of diversification of VEBA’s operations as well as the effect of
natural hedges and possibly pass-through. The significant correlation coefficient of –0.34 between
oper-ating and financing cash flows indicates that financial transactions complement these operational
hedg-ing effects. As a result, total cash flow as the sum of all three cash flows is quite stable as well. The
cor-relation between total cash flow and the stock price of VEBA is low and insignificant, and the
correla-tion between operating cash flow and stock price is larger and significant, but negative.15
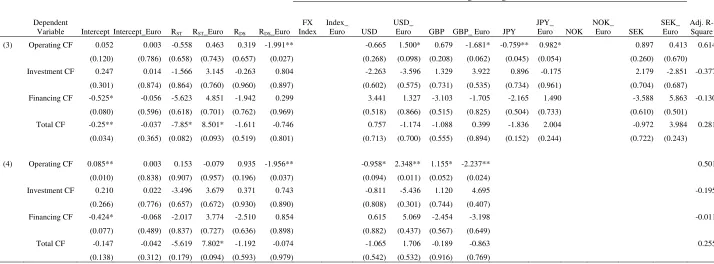
Table 5 shows the results of the regression analysis with different cash flow variables.16 For
13
To illustrate, Danthine et al. (2001) document that there was already a consensus about Euro membership among financial and economic forecasters in January 1998.
14
The results remain largely unchanged when using quarterly dummy variables.
15
Correlations between all exogenous variables are reasonably low. Across different specifications, condition indices and variance inflation factors have values in the range of 6.61-8.35 and 1.20-6.40, respectively.
16
specification (1) that uses the trade-weighted exchange rate index, none of the cash flows exhibits a
sta-tistically significant foreign exchange rate exposure. In contrast, the use of sets of individual currencies
that are identified in Section 4 as most important for VEBA’s operations yields several significant
expo-sures. Given the relatively high correlation between the Swedish Krona and the Norwegian Krone, these
currencies are used as alternative measures to capture exposure of the Scandinavian operations in
speci-fications (2) and (3). Specification (4) focuses on the most important exchange rates. The results of these
specifications with bilateral exchange rates show that operating cash flows are exposed to several
cur-rencies. At the same time, the adjusted R-squared increases relative to specification (1) as well. These
observations highlight the importance of carefully identifying the relevant currencies for the analysis of
foreign exchange rate exposures.
The results of the specifications with individual currencies reveal significant exposures of the
op-erating cash flow of VEBA to the British Pound, the Japanese Yen and the U.S. Dollar. Moreover, the
signs of the coefficients are generally as predicted. In particular, the exposure coefficients for the British
Pound, the Norwegian Krone, and the Swedish Krona are positive, which identifies these as export
mar-kets, e.g. for VEBA’s electricity. The negative sign on the Japanese Yen and the U.S. Dollar suggests
these as currencies of denomination of input markets and/or competitive effects. In fact, VEBA sources
electronics in Japan, while its extensive petrochemical operations and loss-making U.S. operations imply
adverse effects of the strengthening U.S. Dollar. The fact that operating cash flows exhibit significant
foreign exchange rate exposures indicates that operational hedging and pass-through are not sufficient to
eliminate foreign exchange rate exposure. This appears reasonable given that foreign business operations
are costly to establish (and to unwind), that they are likely motivated by considerations other than just
foreign exchange risk management, and that the nature of product market competition limits the ability
to pass exchange rate effects on to customers.
ac-tivities do not exhibit significant foreign exchange rate exposures. Importantly, there are no significant
foreign exchange rate exposures at the level of total cash flow. The exposure coefficient of the cash flow
from financing activities typically has the opposite sign than that of the operating cash flow (as well as
always that of the investing cash flow). Thus, VEBA is actively using its financial policy to offset the
impact of foreign exchange rate risk on its medium and long-term cash flow commitments resulting from
operations and investments. The resulting exposure coefficients associated with total cash flow show the
residual, economically smaller and statistically insignificant foreign exchange exposure. This is an
im-portant result, as it documents the hedging effect of financial cash flows for operating and investing cash
flows, reducing the exposures to a level too small to be detected empirically. As an aside, the interest
rate variables are mostly insignificantly related to the cash flow variables, except for total cash flow.
Fi-nally, the incremental change in the exchange rate betas induced by the introduction of the Euro
gener-ally has the opposite sign to the exposure before the Euro.
Table 6 presents the results of the same specifications that estimate the foreign exchange rate
ex-posure of VEBA’s stock returns. The main result across all different specifications is that there is no
sig-nificant relationship between the stock returns of VEBA and any exchange rate, which is also consistent
with the idea that hedging at the firm level effectively eliminates exposures.17 The signs of the estimated
foreign exchange rate exposures are very consistent with the cash flow exposures estimated in Table 5,
and they are generally in line with the priors based on the characteristics of VEBA’ operations, i.e. stock
returns are positively exposed to the British Pound, the Norwegian Krone, and the Swedish Krona, but
negatively exposed to the U.S. Dollar. The market betas are estimated quite consistently across
specifi-cation around 0.8 and are always highly significant. Moreover, the effect of the introduction of the Euro
17
is a reduction in the market and most of the foreign exchange rate betas, as documented in Bartram and
Karolyi (2006).
In order to verify the robustness of the results, different sets of macroeconomic variables are
in-cluded in the regressions as control variables. In particular, we use alternatively (1) short-term interest
rate variables and term-structure variables for Germany, Britain, the United States and Japan, (2)
short-term interest rate variables for Germany, Britain, the United States and Japan as well as interactions of
these variables with a Euro dummy, (3) the short-term interest rate variable and the term-structure
vari-able for Germany (both with Euro effects), the log-difference in the oil price and the yield of a global
long-term government bond index (maturities of 10 years and more). The main result of significant
for-eign exchange rate exposures of the operating cash flow and insignificant forfor-eign exchange rate
expo-sures of the total cash flow and the stock return is unchanged.
7 Summary and Conclusion
To date, a sizable literature has empirically investigated the effect of foreign exchange rate risk on the
stock returns of nonfinancial corporations, yielding a relatively small number of firms, i.e. 15-20%, that
exhibit significant foreign exchange rate exposures in almost any sample. The clinical analysis of the
foreign exchange rate exposure of a large multinational firm in this paper, based on a proprietary set of
detailed internal data, including cash flows, derivatives and foreign currency debt, as well as capital
market data, illustrates the importance of considering the effect of corporate hedging for this type of
in-vestigation. In particular, the operating cash flows of the firm are significantly exposed to the exchange
rates that are of key relevance for its business activities. At the same time, the multinational firm uses
hedging to reduce its exposure, resulting in insignificant exposure of total cash flow. The paper thus
provides an illustration that managers of corporations exposed to foreign exchange rate risk are
success-ful at reducing the exposure of their operations to such an extent that the remaining net exposures are
References
Adler, M., and B. Dumas 1984. Exposure to Currency Risk: Definition and Measurement, Financial Management 13: 41-50.
Allayannis, G., and E. Ofek 2001. Exchange Rate Exposure, Hedging, and the Use of Foreign Cur-rency Derivatives, Journal of International Money and Finance 20: 273-296.
Allayannis, G., and J. Ihrig 2001. Exposure and Markups, Review of Financial Studies 14: 805-835.
Amihud, Y. 1994. Exchange Rates and the Valuation of Equity Shares, in: Amihud, Y., and R.M. Levich [eds.]: Exchange Rates and Corporate Performance, Irwin (New York, NY), 49-59.
Bae, S.C., 1990. Interest Rate Changes and Common Stock Returns of Financial Institutions: Revis-ited, Journal of Financial Research 13:1: 71-79.
Bartov, E., and G.M. Bodnar 1994. Firm Valuation, Earnings Expectations, and the Exchange Rate Exposure Effect, Journal of Finance 44:5: 1755-1785.
Bartov, E., and G.M. Bodnar 1995. Foreign Currency Translation Reporting and the Exchange-Rate Exposure Effect, Journal of International Financial Management & Accounting 6:2:93-115.
Bartram, S.M. 2004. Linear and Nonlinear Foreign Exchange Rate Exposures of German Nonfinan-cial Corporations, Journal of International Money and Finance: 23:4: 673-699.
Bartram, S.M., and G.A. Karolyi 2006. The Impact of the Introduction of the Euro on Foreign Ex-change Rate Risk Exposures, Journal of Empirical Finance 13:4-5, 519-549.
Bartram, S.M., and G.M. Bodnar 2004. The Foreign Exchange Exposure Puzzle. Johns Hopkins University Working Paper.
Bartram, S.M., G. Brown and B. Minton 2005. Resolving the Exposure Puzzle: The Many Facets of Exchange Rate Exposure, Lancaster University, University of North Carolina at Chapel Hill and Ohio State University Working Paper.
Bessembinder, H. 1991. Forward Contracts and Firm Value: Investment Incentive and Contracting Effects, Journal of Financial and Quantitative Analysis 26:4: 519-532.
Bodnar, G.M., and M.H.F. Wong 2003. Estimating Exchange Rate Exposures: Issues in Model Structure, Financial Management 32: 35-67.
Bodnar, G.M., G.S. Hayt, R.C. Marston, and C.W. Smithson 1995. Wharton Survey of Derivatives Usage by U.S. Non-Financial Firms, Financial Management 24: 104-114.
Bris, A., Y. Koskinen, and M. Nilsson. 2003. The Euro and Corporate Valuations, Yale School of Management Working Paper.
Brown, G.W. 2001. Managing Foreign Exchange Risk with Derivatives, Journal of Financial Eco-nomics 60: 401-448.
Choi, J.J., Elyasiani, E., 1997. Derivative Exposure and the Interest Rate and Exchange Rate Risk of U.S. Banks, Journal of Financial Services Research 12:2-3: 267-286.
Choi, J.J., Elyasiani, E., and K.J Kopecky 1992, The Sensitivity of Bank Stock Returns to Market, Interest and Exchange Rate Risks, Journal of Banking & Finance 16:5: 983-1005.
Chow, E.H., and H.L. Chen 1998. The Determinants of Foreign Exchange Rate Exposure: Evidence on Japanese Firms, Pacific-Basin Finance Journal 6:1/2: 153-174.
Danthine, J.-P., F. Giavazzi, and E.-L. von Thadden. 2001. European Financial Markets after EMU: A First Assessment. In C. Wyplosz, ed. EMU: Its Impact on Europe and the World, Oxford University Press.
Doukas, J.A., P.H. Hall, and L.H.P. Lang 2003. Exchange Rate Exposure at the Firm and Industry Level, Financial Markets, Institutions & Instruments 12:5: 291-347.
Dukas, S.P., A.M. Fatemi, and A. Tavakkol 1996. Foreign Exchange Rate Exposure and the Pricing of Exchange Rate Risk, Global Finance Journal 7:2: 169-189.
Flannery, M.J., James, C.M., 1984. The Effect of Interest Rate Changes on the Common Stock Re-turns of Financial Institutions, Journal of Finance 39:4: 1141-1153.
Flood, E. Jr., and D.R. Lessard 1986. On the Measurement of Operating Exposure to Exchange Rates: A Conceptual Approach. Financial Management 15: 25-37.
Froot, K.A., D.S. Scharfstein, and J.C. Stein 1993. Risk Management: Coordinating Corporate In-vestment and Financing Policies, Journal of Finance 48: 1629-1658.
Garner, C.K., and A.C. Shapiro 1984. A Practical Method of Assessing Foreign Exchange Risk, Midland Corporate Finance Journal 6-17.
Griffin, J.M., and R.M. Stulz 2001. International Competition and Exchange Rate Shocks: A Cross-Country Industry Analysis of Stock Returns, Review of Financial Studies 14: 215-241.
Guay, W. and S.P. Kothari. 2003. How much do firms hedge with derivatives?, Journal of Financial Economics 70: 423-461.
He, J., and L.K. Ng 1998. The Foreign Exchange Exposure of Japanese Multinational Corporations, Journal of Finance 53:2: 733-753.
Hodder, J.E. 1982. Exposure to Foreign Exchange-Rate Movements. Journal of International Eco-nomics 13:11: 375-386.
Jong, A. de, J. Ligterink and V. Macrae 2006. A Firm specific Analysis of the Exchange Rate Expo-sure of Dutch Firms, Journal of International Financial Management and Accounting 17:1: 1-28.
Jorion, P. 1990. The Exchange-Rate Exposure of United-States Multinationals, Journal of Business 63, 331-345.
Koutmos, G. and A.D. Martin. 2003. Asymmetric exchange rate exposure: theory and evidence, Journal of International Money and Finance 22:3: 365-384.
Miller, K.D. and J.J. Reuer. 1998. Asymmetric corporate exposures to foreign exchange rate chan-ges, Strategic Management Journal 19:12: 1183-1191.
Oertmann, P., Rendu, C., Zimmermann, H., 2000. Interest Rate Risk of European Financial Corpora-tions, European Financial Management 6:4: 459-478.
Oxelheim, L., Wihlborg, C.G. 2003. Recognizing Macroeconomic Fluctuations in Value-Based Management, Journal of Applied Corporate Finance 15: 104-110.
Oxelheim, L., Wihlborg, C.G. 1987. Macroeconomic Uncertainty, Wiley.
Oxelheim, L., Wihlborg, C.G. 1995. Measuring Macroeconomic Exposure: The Case of Volvo Cars. European Financial Management 1:3: 241-263.
Petersen, M.A. Thiagarajan, S.R. 2000. Risk Measurement and Hedging: With and Without Deriva-tives. Financial Management 29:4, 5-30.
Prasad, A.M., Rajan, M. 1995. The Role of Exchange and Interest Risk in Equity Valuation: A Comparative Study of International Stock Markets. Journal of Economics and Business 47:5: 457-472.
Shapiro, A.C. 1975. Exchange Rate Changes, Inflation, and the Value of the Multinational Corpora-tion. Journal of Finance 30:2: 485-502.
Simkins, B.J., and P. Laux 1997. Derivatives Use and the Exchange Rate Risk of Investing in Large U.S. Corporations. Proceedings of the 2nd International Finance Conference, Georgia Institute of Technology.
Smith, C.W., and R.M. Stulz. 1985. The Determinants of Firms' Hedging Policies, Journal of Finan-cial and Quantitative Analysis 20:4: 391-405.
Starks, L.T. and K.D. Wei, 2006, Foreign Exchange Rate Exposure and Short-Term Cash Flow Sen-sitivity, University of Texas working paper.
Stulz, R.M. and R. Williamson. 1997. Identifying and Quantifying Exposures, in: Jameson, R. [ed.]: Financial Risk and the Corporate Treasury, Risk Publications: 33-51.
Sutton, T. 2000. Corporate Financial Accounting and Reporting, Prentice Hall.
Sweeney, R.J., and A.D. Warga. 1986. The Pricing of Interest-Rate Risk: Evidence from the Stock Market, Journal of Finance 41:2: 393-410.
Walsh, E.J. 1994. Operating Income, Exchange Rate Changes, and the Value of the Firm: An Em-pirical Analysis. Journal of Accounting, Auditing and Finance 9:4: 703-724.
Figure 1: Time Series of Corporate Cash Flows
The figure shows the monthly time series of different cash flow levels of VEBA in millions of Deutsche Mark be-tween January 1996 and December 1999. Panel A presents the cash flows from financing and investing activities, while Panel B shows the cash flows from operating activities and total cash flow, respectively.
Panel A: Investing and Financing Cash Flows
-5000 -4000 -3000 -2000 -1000 0 1000 2000 3000 4000 5000 6000 7000
Jan-96 Jun-96 Nov-96 Apr-97 Sep-97 Feb-98 Jul-98 Dec-98 May-99 Oct-99 Cash Flow from Financing Activities
Cash Flow from Investing Activities [DM mio]
Panel B: Cash Flow from Operations and Total Cash Flow
-5000 -4000 -3000 -2000 -1000 0 1000 2000 3000 4000 5000 6000 7000
Jan-96 Jun-96 Nov-96 Apr-97 Sep-97 Feb-98 Jul-98 Dec-98 May-99 Oct-99 Cash Flow from Operating Activities
Table 1: Sources of Operating Exposure
The table reports information on the sources of operating exposure from the largest foreign markets for VEBA over the period 1996 to 1999. The first and second columns report the countries, the corresponding local currencies and their official symbol, respectively. The third column displays the actual currency of the exposure considering link-ages (such as currency pegs) to other currencies. Latvia and Libya, for instance, maintain a peg to the Special Draw-ing Rights, SDR. The fourth column shows the standard deviation of monthly change of the exchange rates relative to the German Mark (times 100) over this period. Data of some currencies were not available for the entire time pe-riod. As a result, the series of the Balarus Ruble starts in October 1998, and the Azerbaijani Manat and the Kazakh-stan Tenge both start in December 1998. All foreign exchange rates are expressed in Deutsche Mark per unit of for-eign currency.
Country Local Currency (Symbol) Exposure Standard Deviation
Argentina Argentine Peso (ARS) USD 2.43
Austria Austrian Schilling (ATS) ATS 0.02
Azerbaijan Azerbaijani Manat (AZM) AZM 9.66
Belarus Balarus Ruble (BYB) RUR 17.43
Belgium Belgian Franc (BEF) BEF 0.08
Brazil Brazil Real (BRL) BRL 8.50
Canada Canadian Dollar (CAD) CAD 2.93
China Chinese Renminbi Yuan (CNY) USD 2.43
Colombia Colombian Peso (CLP) CLP 4.00
Czech Republic Czech Koruna (CZK) CZK 2.38
Denmark Danish Krone (DKK) DKK 0.19
Egypt Egyptian Pound (EGP) USD 2.46
Estonia Estonian Kroon (EEK) DEM 0.28
Finland Finnish Markka (FIM) FIM 0.62
France French Franc (FRF) FRF 0.33
Great Britain British Pound (GBP) GBP 2.26
Hungary Hungarian Forint (HUF) HUF 1.21
Indonesia Indonesian Rupiah (IDR) IDR 15.33
Italy Italian Lira (ITL) ITL 0.96
Japan Japanese Yen (JPY) JPY 3.78
Kazakhstan Kazakhstan Tenge (KZT) KZT 13.40
Latvia Latvian Lats (LVL) SDR 1.58
Lithuania Lithuanian Litas (LTL) USD 2.37
Libya Libyan Dinar (LYD) SDR 3.51
Malaysia Malaysia Ringgits (MYR) MYR 7.80
Netherlands Dutch Guilder (NLG) NLG 0.05
New Zealand New Zealand Dollar (NZD) NZD 3.06
Norway Norwegian Krone (NOK) NOK 1.86
Poland Polish Zloty (PLN) PLN 2.33
Russia Russian Ruble (RUR) RUR 10.92
South Korea South Korean Won (KRW) KRW 7.98
Spain Spanish Peseta (ESP) ESP 0.42
Sweden Swedish Krona (SEK) SEK 1.75
Switzerland Swiss Franc (CHF) CHF 1.10
Syria Syrian Pound (SYP) USD 3.72
Taiwan Taiwanese Dollar (TWD) TWD 3.04
Trinidad Trinidad Dollar (TTD) USD 2.96
U.S.A. U.S. Dollar (USD) USD 2.43
Table 2: Geographic Segments of Sales and Assets
The table presents a geographic breakdown of the sales and assets of VEBA, in millions of Deutsche Mark and as percentages of the total, for the period 1995 to 1999. Due to lack of data availability, the geographic segment data for 1999 shows fixed assets rather than total assets.
1995 1996 1997 1998 1999
Geographic Segment DEM % DEM % DEM % DEM % DEM %
Total Sales Germany 59,628 82.4 60,648 81.3 59,079 71.4 55,442 66.3 63,480 61.3
Euro Area 9,870 9.5
Other European Countries 6,439 8.9 6,690 9.0 11,454 13.8 15,022 17.9 5,072 4.9
North America 5,208 7.2 6,090 8.2 8,715 10.6 9,370 11.2 15,889 15.4
Other Countries 1,097 1.5 1,113 1.5 3,471 4.2 3,850 4.6 9,174 8.9
Total 72,372 100.0 74,541 100.0 82,719 100.0 83,684 100.0 103,485 100.0
Total Assets Germany 60,671 89.5 61,910 86.1 65,500 81.3 64,470 78.8 26,257 73.0
Euro Area 1,369 3.8
Other European Countries 2,885 4.3 4,677 6.5 5,667 7.0 7,830 9.6 2,413 6.7
North America 3,097 4.6 4,186 5.8 7,824 9.7 6,690 8.2 3,839 10.7
Other Countries 1,098 1.6 1,144 1.6 1,604 2.0 2,790 3.4 2,073 5.8
Table 3: Derivatives Positions
The table shows the derivatives positions of VEBA by maturity, instrument and currency for maturities between January 1997 and December 1998 for transactions with settlement date within that calendar year. The table reports the number of contracts during that year (Contracts), the notional amounts (No-tional Amount) as well as the absolute no(No-tional amounts (Absolute No(No-tional Amount) in Deutsche Mark.
01/01/1997 - 31/12/1997 01/01/1998 - 31/12/1998
Type of Instrument Currency Contracts
Notional Amount
Absolute Notional
Amount Contracts
Notional Amount
Absolute Notional Amount
Options U.S. Dollar 6 10,102,794 12,985,628 86 -52,719,717 256,408,827
Japanese Yen 27 2,371,729 3,124,872 10 11,624,375 19,026,875
British Pound 2 -1,157,210 1,157,210 45 29,506,043 92,718,030
Swiss Franc 1 3,144,466 3,144,842
Swedish Krona 2 -89,098 542,084
U.S. Dollar 133 90,547,292 1,448,632,809 169 59,698,046 3,681,917,134
Hong-Kong Dollar 20 60,625,078 64,674,481 18 1,585,085 7,562,302
Cash, Forwards, Swaps
Japanese Yen 41 16,701,101 142,421,112 48 49,814,722 192,981,434
Swiss Franc 30 -9,423,107 278,170,607 23 -21,541,958 348,463,789
British Pound 35 -8,430,423 293,825,382 54 24,511,295 681,685,117
Australian Dollar 11 6,724,891 14,755,732 11 -487,830 5,962,424
Danish Krone 9 3,442,340 30,138,052 8 -3,665,359 19,477,800
Singapore Dollar 7 3,127,087 6,249,461 5 109,359 5,738,182
Polish Zloty 3 -2,357,186 13,798,389 2 -862,923 4,256,057
Argentine Peso 6 -1,848,623 1,897,327 9 -1,655,550 1,845,561
Swedish Krona 13 1,625,942 132,454,117 32 47,278,606 208,145,048
Czech Koruna 9 -630,441 11,717,628 7 3,087,536 17,573,321
Hungarian Forint 4 317,257 7,636,395 4 222,964 10,831,678
Greek Drachma 1 171,707 171,707 4 74,445 324,445
Canadian Dollar 5 139,764 845,341 7 -26,815 3,215,926
Kuwait Dinar 4 -115,222 743,979 2 -186,719 403,333
Norwegian Krone 3 70,804 629,915 10 -1,291,179 17,073,490
South African Rand 1 -61,390 61,390 5 -975,988 2,726,888
New Zealand Dollar 2 45,187 45,187 0 0
Thai Baht 4 26,075 636,624 4 -334,694 814,021
Malaysia Ringgits 1 9,361 9,361 2 18,527 23,909
Venezuelan Bolívar 0 0 0 2 -27,469 1,805,572
25
Table 4: Summary Statistics of Variables
The table reports summary statistics of the dependent and independent variables. The cash flow variables are calcu-lated as the monthly level changes scaled by contemporaneous sales. Stock market variables and exchange rate vari-ables are log differences. RVEBA and RM denote the log difference in the total return indices of VEBA and the German
stock market, respectively, in excess of the risk-free rate. FX Index represents the Bank of England trade-weighted foreign exchange index of the Deutsche Mark. The interest rate variables RST and RDS are defined as the change in the
short-term interest rate divided by one plus the long-term rate, and the change in the term-spread divided by one plus the long-term rate respectively. The German ten-year government bond benchmark yield serves as the long-term inter-est rate and the German three-month Euro-Mark interinter-est rate as the short-term interinter-est rate. All foreign exchange rates are expressed in Deutsche Mark per unit of foreign currency. Panel A shows descriptive statistics of different variables, while Panel B shows correlations between the cash flow variables and stock returns. a, b, and c indicate significance at the 1%, 5%, and 10% level, respectively. All variables are stationary according to the Phillips-Perron Unit Root Test.
Panel A: Descriptive Statistics
Variable Mean Std. Minimum Median Maximum
Cash flow variables Operating -0.0031 0.0570 -0.1104 -0.0114 0.1691
Investing -0.0057 0.2201 -0.6461 0.0092 0.6161
Financing -0.0003 0.2980 -0.9163 0.0142 0.7756
Total Cash Flow -0.0081 0.1457 -0.3886 0.0077 0.3783
Stock market variables RVEBA 0.0065 0.0699 -0.1695 0.0152 0.1531
RM 0.0172 0.0562 -0.1787 0.0284 0.1320
Foreign exchange and interest rates FX Index 0.0023 0.0069 -0.0129 0.0029 0.0192
U.S. Dollar 0.0058 0.0243 -0.0536 0.0046 0.0608
British Pound 0.0071 0.0226 -0.0389 0.0095 0.0483
Japanese Yen 0.0067 0.0378 -0.0543 0.0041 0.1463
Swedish Krona 0.0014 0.0175 -0.0288 -0.0008 0.0712
Norwegian Krone 0.0013 0.0186 -0.0486 0.0020 0.0452
RST 0.0001 0.0125 -0.0357 0.0000 0.0340
RDS -0.0010 0.0186 -0.0340 -0.0025 0.0374
Panel B: Correlations of Cash Flow Variables and Stock Returns
Total Cash Flow
Operating Cash Flow
Investing Cash Flow
Financing Cash Flow
Operating Cash Flow 0.097
Investing Cash Flow -0.233 0.347b
Financing Cash Flow 0.626a -0.344b -0.891a
Table 5: Cash Flow Regressions
The table reports the results of the following regression, estimated between January 1996 and December 1999:
N ( i )
t i FX ,t 1 ST ,t 2 DS,t t i 1
CF R R R
=
= α +
∑
δ + φ + φ + εwhere CFt denotes the change in cash flow i scaled by the level of total sales. OCF, ICF, FCF and TCF refer to Operating Cash Flow, Investment Cash Flow, Financing Cash
Flow and Total Cash Flow, respectively. R( i )FX ,t, RST,t, and RDS,t denote the percentage change of foreign currency i, the change in the short-term interest rate divided by one plus
the long-term rate, and the change in the term-spread divided by one plus the long-term rate, respectively. All variables are also interacted with a dummy variable DEUR with a
value of 1 after January 1, 1998 and 0 otherwise. Dummy variables are further used to control for potential seasonality effects. USD, GBP, JPY, SEK, NOK, and FX Index represent percentage changes of the U.S. Dollar, the British Pound, the Japanese Yen, the Swedish Krona, the Norwegian Krone, and the Bank of England trade-weighted foreign exchange index of the Deutsche Mark. The German ten-year government bond benchmark yield serves as the long-term interest rate and the German three-month Euro-Mark interest rate as the short-term interest rate. All regressions include monthly dummy variables. For each variable, the table shows the estimated coefficient and p-value (in parentheses). *, **, and *** indicate significance at the 10%, 5%, and 1% level, respectively. Adj. R-Square is the adjusted R-Squared of the regression.
Foreign Exchange Rates
Dependent
Variable Intercept Intercept_Euro RST RST_Euro RDS RDS_Euro FX Index
Index_ Euro USD USD_ Euro GBP GBP_ Euro JPY JPY_ Euro NOK NOK_ Euro SEK SEK_ Euro Adj. R-Square
(1) Operating CF 0.074** -0.006 -0.298 -0.094 0.720 -1.746* -0.984 2.399 0.411
(0.022) (0.679) (0.834) (0.950) (0.309) (0.069) (0.536) (0.332)
Investment CF 0.108 0.030 0.888 -0.453 0.432 -1.390 4.028 -1.775 -0.227
(0.530) (0.707) (0.911) (0.957) (0.912) (0.789) (0.650) (0.897)
Financing CF -0.305 -0.078 -7.461 9.084 -2.536 3.044 -10.125 7.032 0.014
(0.151) (0.416) (0.441) (0.380) (0.594) (0.630) (0.350) (0.672)
Total CF -0.140 -0.053 -7.135* 8.967** -1.336 0.235 -6.736 6.282 0.342
(0.102) (0.174) (0.072) (0.036) (0.483) (0.926) (0.124) (0.347)
(2) Operating CF 0.069** 0.003 -0.716 0.662 0.431 -1.948** -0.685 1.449 0.968 -1.785* -0.710* 0.985* 0.098 0.930 0.540
(0.039) (0.829) (0.604) (0.657) (0.564) (0.036) (0.269) (0.152) (0.103) (0.074) (0.078) (0.074) (0.887) (0.250)
Investment CF 0.286 0.001 -1.608 0.991 1.952 0.349 0.781 -6.649 0.231 5.353 0.807 -0.903 -5.949 5.088 -0.280
(0.174) (0.994) (0.856) (0.918) (0.684) (0.951) (0.843) (0.303) (0.950) (0.392) (0.748) (0.793) (0.187) (0.327)
Financing CF -0.536** -0.040 -5.673 8.584 -5.244 1.450 -1.304 6.249 -1.336 -3.871 -2.073 2.540 8.112 -6.662 -0.045
(0.043) (0.699) (0.602) (0.466) (0.376) (0.835) (0.787) (0.426) (0.768) (0.611) (0.501) (0.546) (0.143) (0.295)
Total CF -0.201* -0.035 -8.177* 10.473** -2.780 0.131 -1.067 0.546 -0.208 -0.294 -1.865 2.453 2.194 -0.278 0.255
(0.064) (0.415) (0.078) (0.039) (0.258) (0.964) (0.593) (0.865) (0.912) (0.925) (0.150) (0.166) (0.331) (0.915)
Table 5 Cash Flow Regression (continued)
Foreign Exchange Rates
Dependent
Variable Intercept Intercept_Euro RST RST_Euro RDS RDS_Euro
FX Index
Index_
Euro USD USD_
Euro GBP GBP_ Euro JPY
JPY_
Euro NOK NOK_
Euro SEK SEK_
Euro
Adj. R-Square
(3) Operating CF 0.052 0.003 -0.558 0.463 0.319 -1.991** -0.665 1.500* 0.679 -1.681* -0.759** 0.982* 0.897 0.413 0.614
(0.120) (0.786) (0.658) (0.743) (0.657) (0.027) (0.268) (0.098) (0.208) (0.062) (0.045) (0.054) (0.260) (0.670)
Investment CF 0.247 0.014 -1.566 3.145 -0.263 0.804 -2.263 -3.596 1.329 3.922 0.896 -0.175 2.179 -2.851 -0.377
(0.301) (0.874) (0.864) (0.760) (0.960) (0.897) (0.602) (0.575) (0.731) (0.535) (0.734) (0.961) (0.704) (0.687)
Financing CF -0.525* -0.056 -5.623 4.851 -1.942 0.299 3.441 1.327 -3.103 -1.705 -2.165 1.490 -3.588 5.863 -0.130
(0.080) (0.596) (0.618) (0.701) (0.762) (0.969) (0.518) (0.866) (0.515) (0.825) (0.504) (0.733) (0.610) (0.501)
Total CF -0.25** -0.037 -7.85* 8.501* -1.611 -0.746 0.757 -1.174 -1.088 0.399 -1.836 2.004 -0.972 3.984 0.281
(0.034) (0.365) (0.082) (0.093) (0.519) (0.801) (0.713) (0.700) (0.555) (0.894) (0.152) (0.244) (0.722) (0.243)
(4) Operating CF 0.085** 0.003 0.153 -0.079 0.935 -1.956** -0.958* 2.348** 1.155* -2.237** 0.501
(0.010) (0.838) (0.907) (0.957) (0.196) (0.037) (0.094) (0.011) (0.052) (0.024)
Investment CF 0.210 0.022 -3.496 3.679 0.371 0.743 -0.811 -5.436 1.120 4.695 -0.195
(0.266) (0.776) (0.657) (0.672) (0.930) (0.890) (0.808) (0.301) (0.744) (0.407)
Financing CF -0.424* -0.068 -2.017 3.774 -2.510 0.854 0.615 5.069 -2.454 -3.198 -0.011
(0.077) (0.489) (0.837) (0.727) (0.636) (0.898) (0.882) (0.437) (0.567) (0.649)
Total CF -0.147 -0.042 -5.619 7.802* -1.192 -0.074 -1.065 1.706 -0.189 -0.863 0.255
(0.138) (0.312) (0.179) (0.094) (0.593) (0.979) (0.542) (0.532) (0.916) (0.769)
Table 6: Stock Price Regressions
The table reports the results of the following regression, estimated between January 1996 and December 1999:
N ( i )
t m ,t i FX ,t 1 ST ,t 2 DS,t t i 1
R R R R R
=
α + β +
∑
δ + φ + φ + ε =where Rt and Rm,t denote the return on VEBA stock and the return on a local stock market index (RM), respectively, in excess of the risk-free rate. is the return on
foreign exchange variable i. R
( i ) FX ,t
R
ST,t and RDS,t are defined as the change in the short-term interest rate divided by one plus the long-term rate and the change in the term
spread divided by one plus the long-term rate, respectively. All variables are also interacted with a dummy variable DEUR with a value of 1 after January 1, 1998 and 0
otherwise. USD, GBP, JPY, SEK, NOK, and FX Index represent percentage changes of the U.S. Dollar, the British Pound, the Japanese Yen, the Swedish Krona, the Norwegian Krone, and the Bank of England trade-weighted foreign exchange index of the Deutsche Mark. The German ten-year government bond benchmark yield serves as the long-term interest rate and the German three-month Euro-Mark interest rate as the short-term interest rate. For each variable, the table shows the estimated coefficient and p-value (in parentheses). Panel A shows regressions with market index, while Panel B shows regression without market index. *, **, and *** indicate significance at the 10%, 5%, and 1% level, respectively. Adj. R-Square is the adjusted R-Squared of the regression.
Foreign Exchange Rates
Intercept Intercept_Euro RM RM_ Euro RST RST_Euro RDS RDS_Euro FX Index
Index_
Euro USD
USD_
Euro GBP
GBP_
Euro JPY
JPY_
Euro NOK
NOK_
Euro SEK
SEK_ Euro
Adj. R-Square
Panel A: Regressions with Market Index
(1) 0.011 -0.036* 0.788** -0.312 -0.415 -0.536 0.037 0.629 0.618 1.381 0.354
(0.419) (0.054) (0.011) (0.380) (0.792) (0.766) (0.962) (0.553) (0.752) (0.624)
(2) 0.011 -0.038* 0.763** -0.246 -0.566 -0.490 0.045 0.617 -0.530 -0.164 0.435 0.408 0.410 -0.085 0.591 -0.172 0.288
(0.450) (0.064) (0.037) (0.563) (0.749) (0.806) (0.959) (0.599) (0.491) (0.888) (0.572) (0.721) (0.424) (0.888) (0.507) (0.882)
(3) 0.012 -0.039* 0.812** -0.268 -0.424 -0.580 -0.009 0.658 -0.444 -0.151 0.232 0.574 0.287 0.014 0.470 -0.267 0.277
(0.412) (0.055) (0.023) (0.521) (0.810) (0.772) (0.992) (0.580) (0.555) (0.895) (0.750) (0.612) (0.570) (0.981) (0.634) (0.828)
(4) 0.011 -0.035* 0.830** -0.292 -0.755 -0.181 -0.015 0.930 -0.263 -0.262 0.287 0.593 0.325
(0.431) (0.069) (0.016) (0.459) (0.644) (0.922) (0.986) (0.403) (0.703) (0.807) (0.683) (0.585)
Panel B: Regressions without Market Index
(1) 0.019 -0.038* -1.633 0.626 -0.300 1.209 2.587 0.366 0.169
(0.207) (0.068) (0.343) (0.752) (0.730) (0.311) (0.213) (0.904)
(2) 0.015 -0.033 -1.628 0.445 0.015 0.892 -0.153 -0.082 0.953 -0.388 0.490 -0.208 1.132 -0.134 0.125
(0.365) (0.130) (0.390) (0.836) (0.987) (0.492) (0.853) (0.948) (0.244) (0.753) (0.388) (0.754) (0.234) (0.912)
(3) 0.017 -0.036 -1.485 0.391 -0.068 0.956 0.118 -0.090 0.627 -0.220 0.269 -0.053 0.713 0.011 0.076
(0.294) (0.111) (0.444) (0.859) (0.945) (0.476) (0.883) (0.941) (0.437) (0.860) (0.637) (0.937) (0.521) (0.994)
(4) 0.017 -0.033 -1.846 0.882 -0.046 1.175 0.356 -0.119 0.709 -0.179 0.127