Munich Personal RePEc Archive
Financing basic education in Bangladesh
Al-Samarrai, Samer
Institute of Education for Development
January 2007
Online at
https://mpra.ub.uni-muenchen.de/1505/
Financing basic education in Bangladesh
*Samer Al-Samarrai
January 2007
Working paper prepared for the Consortium for Research on Educational Access, Transitions and Equity (CREATE).
Institute of Education and Development, BRAC University, Dhaka, Bangladesh. Centre for International Education, University of Sussex, Brighton, United Kingdom.
Abstract
This paper presents education finance trends for Bangladesh since 2000. It shows that while government spending on education as a proportion of national income has stagnated, it has increased in real terms. Real increases in education spending have resulted in substantial increases in per student spending in basic education. At primary, enrolment declines have reinforced these trends and in 2005 per student spending in government primary schools was 30% higher, in real terms than in 2001. Despite these increases, per student spending on education in Bangladesh remains low compared to other countries in the region and countries at similar levels of development. Levels of government funding also vary enormously across different providers of basic education although these differences do not appear to have a significant impact on education outcomes at the primary level. At secondary, there appears to be a closer correlation between levels of public funding and outcomes although the socio-economic status of student intakes also appears to play an important role. To achieve equitable access to basic education, it is important to narrow these public funding differences. However, given the comparatively low levels of funding across the basic education system it is perhaps more important to increase overall levels of funding if the quality and overall efficiency of the system is to be improved.
*
The author is grateful to Fahmida Abedin,Sajidul Islam, Abdur Rahman and Dr Rashid Zaman for research
1. Introduction
During the 1990s Bangladesh made great strides in improving access to basic education. These gains were achieved through the introduction of demand side reforms, most notably stipend schemes, coupled with a massive programme of school expansion. School expansion has largely been the result of government incentives for establishing private schools resulting in an education system consisting of a large number of different providers with different levels of resourcing. Since the 1990s, the basic education system has expanded more slowly and there is some evidence of enrolment beginning to decline in parts of the system (DPE 2006a).
This paper explores trends in public education financing since 1999/00 and reports on how recent changes in enrolment have affected levels of per student spending. The paper identifies the main providers of basic education and analyses their funding levels from both government and non-government sources. It compares funding levels with other countries in the region and countries at similar levels of development. The paper also attempts to assess current differences in support for different providers from an efficiency and equity perspective. In particular, the paper explores the extent to which differences in levels of financing across providers explain existing patterns of education outcomes and the extent to which the poor are well served by current provision.
In Bangladesh, basic education has commonly been used to describe primary education and adult literacy programmes. In this paper, basic education refers to the first 10 years of education which conforms with UNESCO classifications of education levels. The first 10 years of education in Bangladesh cover primary education and the first stage of secondary education. Given that two separate ministries are responsible for these two sub-sectors the paper provides information separately where possible.
The next section describes the basic education sector and outlines the different financing modalities employed by government to support the sector. Section 3 analyses the trends in public education spending and explores how this has changed across different providers. Section 4 uses existing research findings to outline household support to the sector and to explore whether private spending reinforces patterns of public spending. It also explores the distribution of public education expenditure from an equity perspective. Section 5 explores the relationship between different levels of financing and education outcomes. The final section offers some conclusions.
2. Education provision in Bangladesh
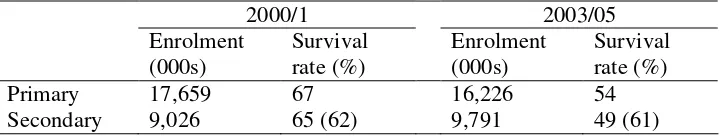
Table 1: Trends in enrolment and survival in basic education
2000/1 2003/05
Enrolment (000s)
Survival rate (%)
Enrolment (000s)
Survival rate (%)
Primary 17,659 67 16,226 54
Secondary 9,026 65 (62) 9,791 49 (61)
Source: DPE (2002a; 2006a) and BANBEIS (2004).
Notes: Figures for primary education are for 2001 and 2005 and only include government recognised primary schools. Data for secondary is for 2000 and 2003. Data for secondary survival rates are for general education. Madrasah education survival rates are reported in parentheses.
Changes in primary enrolment have not been uniform across different school providers. Government and registered non-government primary schools had approximately 13% fewer students in 2005 compared with 2001 while madrasahs more than doubled their enrolment over the same period. Increases in madrasah enrolment may in part, be due to better reporting in 2005. However, the decline in enrolment seen in government and registered non-government schools appears to reflect a real decline rather than improved reporting.3 Survival rates also appear to have declined in primary education over the period suggesting that fewer students are completing primary school in the middle of the decade.4
It should be noted that Government figures for primary schooling do not include non-formal schools and some types of unregistered schools such as Qawmi madrasahs. While information on the number of children attending these types of education facilities are not collected annually they do enrol a substantial number of primary school students. For example, a recent study reported that approximately 1.5 million children are enrolled in NGO non-formal primary schools (World Bank 2006). If enrolment in these school types is included trends in primary enrolment rates show a slight upward trend since 2000. The last two rounds of the nationally representative Household Income and Expenditure Survey (HIES) show the primary gross enrolment rate increasing slightly from 102% in 2000 to 105% in 2005 (BBS 2006). These findings suggest that there may have been a shift out of government recognised into unrecognised schools during the period rather than a decline in overall primary enrolment levels.
Unlike primary enrolment, total enrolment in secondary education over a similar period increased. However, the slowing down of primary school expansion, low survival rates and high primary to secondary transition rates are beginning to impact on secondary enrolment.5 In 2003, approximately 40,000 fewer students enrolled in Class 6 than in the previous year (BANBEIS 2006).
Compared to the beginning of the decade fewer children are successfully completing their education. In the mid-2000s approximately a half of all students beginning primary or secondary education actually survived to the final grades (see Table 1). Combining these trends suggests that only around a quarter of students survive the basic education cycle. Participation and pass rates in the Secondary School Certificate (SSC) at the end of Class 10 are also very low implying that an even smaller proportion successfully complete basic education.
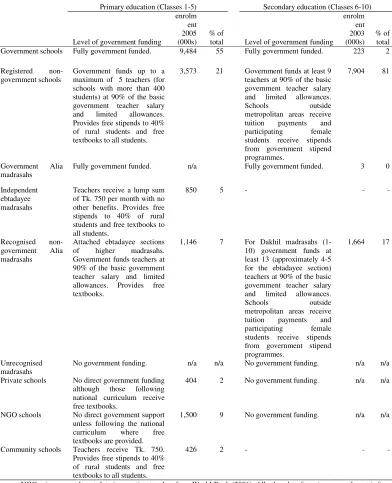
government funded primary schools provide over half of all primary school places. Government provides a proportion of basic teacher pay and some non-salary support to registered non-government primary schools and ebtadayee sections of high madrasahs (i.e. Dakhil and above). These school types make up a further 28% of primary school enrolment. Independent ebtadayee madrasahs are supported by government at much lower levels than high madrasahs and in a similar way to community schools.6
Table 2 : Government financing modalities in primary and secondary education
Primary education (Classes 1-5) Secondary education (Classes 6-10)
Level of government funding
enrolm ent 2005 (000s)
% of
total Level of government funding enrolm ent 2003 (000s) % of total Government schools Fully government funded. 9,484 55 Fully government funded. 223 2
Registered non-government schools
Government funds up to a maximum of 5 teachers (for schools with more than 400 students) at 90% of the basic government teacher salary and limited allowances. Provides free stipends to 40% of rural students and free textbooks to all students.
3,573 21 Government funds at least 9 teachers at 90% of the basic government teacher salary and limited allowances. Schools outside metropolitan areas receive tuition payments and participating female students receive stipends from government stipend programmes.
7,904 81
Government Alia madrasahs
Fully government funded. n/a Fully government funded. 3 0
Independent ebtadayee madrasahs
Teachers receive a lump sum of Tk. 750 per month with no other benefits. Provides free stipends to 40% of rural students and free textbooks to all students.
850 5 - - -
Recognised non-government Alia madrasahs
Attached ebtadayee sections of higher madrasahs. Government funds teachers at 90% of the basic government teacher salary and limited allowances. Provides free textbooks.
1,146 7 For Dakhil madrasahs (1-10) government funds at least 13 (approximately 4-5 for the ebtadayee section) teachers at 90% of the basic government teacher salary and limited allowances. Schools outside metropolitan areas receive tuition payments and participating female students receive stipends from government stipend programmes.
1,664 17
Unrecognised madrasahs
No government funding. n/a n/a No government funding. n/a n/a
Private schools No direct government funding although those following national curriculum receive free textbooks.
404 2 No government funding. n/a n/a
NGO schools No direct government support unless following the national curriculum where free textbooks are provided.
1,500 9 No government funding. n/a n/a
Community schools Teachers receive Tk. 750. Provides free stipends to 40% of rural students and free textbooks to all students.
426 2 - - -
Unlike primary education, secondary education provision is completely dominated by registered non-government schools and madrasahs; 98% of students enrolled in 2003 were enrolled in schools of this type (see Table 2). Funding of non-government secondary schools and madrasahs follows a similar format to government support in primary although a larger number of teachers are supported in each institution. Stipend programmes for female students operate in secondary schools located outside metropolitan areas. These programmes offer free tuition and a small stipend conditional on attendance, examination performance and female students remaining unmarried. Support for tuition payments represents an important source of income for non-government schools particularly for madrasahs.
Table 2 shows that there are differences in the way that school providers are supported by government. In particular, government support to teachers tends to be different across school types and, as the next section will show, lead to large disparities in government per pupil funding.
3. Trends in public financing of education
Intersectoral allocations of public expenditure
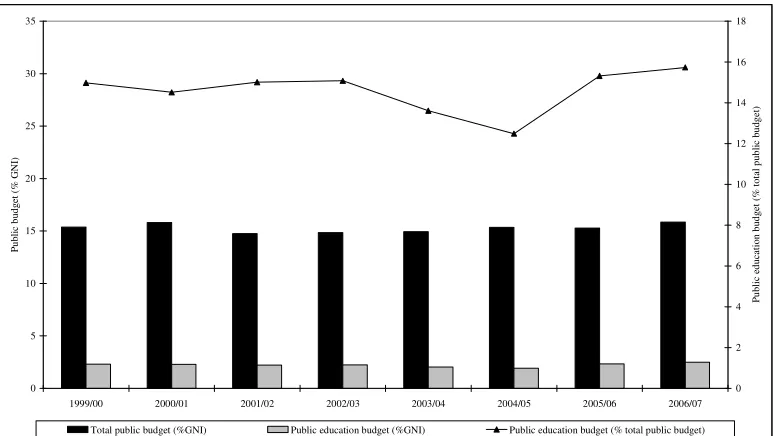
Figure 1: Education as a proportion of the overall budget 0 5 10 15 20 25 30 35
1999/00 2000/01 2001/02 2002/03 2003/04 2004/05 2005/06 2006/07
P u b li c b u d g et ( % G N I) 0 2 4 6 8 10 12 14 16 18 P u b li c ed u ca ti o n b u d g et ( % t o ta l p u b li c b u d g et )
Total public budget (%GNI) Public education budget (%GNI) Public education budget (% total public budget)
Source: Ministry of Finance (various years-a), Planning Commission (various years) and Bangladesh Bureau of Statistics for GNI data.
Notes: All figures are for revised budget except 2000/01 (total development and education development budget) and 2006/07 (all statistics) which are budgeted figures. Total public budget figures exclude debt repayments, loans and advances, food operations and structural adjustment spending. The total budget figures for 2005/06 and 2006/07 include programmes financed by the non-development budget (commonly 1-2% of the overall budget) whereas other figures do not. Total budget figures for 1999/00 and 2000/01 are not completely comparable with other figures but the differences are small. See Annex for further details.
In 1999/00 government education spending as a proportion of national income was 2.3% (see Figure 1). It initially declined, reaching a low of 1.9% in 2004/05 before rallying to reach a similar level in 2006/07 as it had achieved in 1999/00 (see Figure 1). However, the proportion of GNI spent on education remains low compared to other countries in the region and developing countries more generally. For example, the average percentage of GNI devoted to public education spending in 2002 was 4.5% for developing countries as a whole and 3.8% for countries in South and West Asia (UNESCO 2006). The comparatively low proportion of national income devoted to education appears to contradict the healthy share of government resources that have been shown to be devoted to education. However, as Figure 1 shows the overall government budget as a proportion of national income is low and subsequently the share of education spending in national income is also low.
While the share of national income devoted to education was similar in 1999/00 and 2006/07, real spending has increased over the period because of high rates of economic growth; between 1999/00 and 2006/07 the overall economy grew, on average, by 5% per year in real terms. This resulted in public education spending increasing by 50% in real terms over the period.
Intrasectoral allocations of public education expenditure
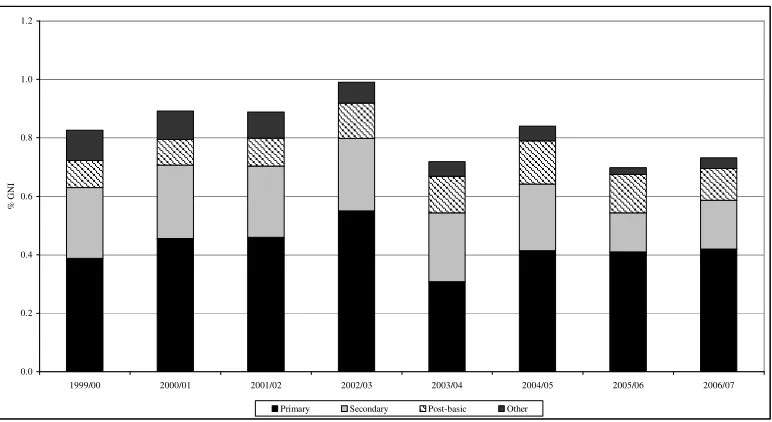
Figure 2). In 1999/00, 60% of basic education revenue resources went to primary but by 2005/06 basic education revenue resources were almost equally shared between primary and secondary education.
Figure 2: Sub-sectoral revenue budget allocations for education 1999/00-2005/06 (% GNI)
0.0 0.2 0.4 0.6 0.8 1.0 1.2 1.4 1.6 1.8
1999/00 2000/01 2001/02 2002/03 2003/04 2004/05 2005/06
%
G
N
I
Primary Secondary Post-basic Other
Source: Author’s calculations from Ministry of Finance (various years-b) and Planning Commission (various years).
Notes: Revenue budget data is based on the revised budget except for 2005/06. For details of how sub-sectoral budget allocations have been calculated see the Annex.
How does recurrent spending on basic education compare with other countries? Comparable data on basic education spending is not available. However, information is available for recurrent spending on primary education and this data suggests that Bangladesh spends relatively little on primary education compared to other countries. For example, in 2002 India and Nepal spent 1.4% and 1.3% of national income on primary education respectively, more than double the percentage spent in Bangladesh in the same year (UNESCO 2006). PEDP II aims to increase recurrent spending on primary education to 2.8% of national income by 2009 (MoPME 2003b). This would represent a massive increase in spending over a relatively short period of time and would represent more than the total 2006/07 education recurrent budget (see Figure 1).
Figure 3: Sub-sectoral development budget allocations for basic education (% GNI)
0.0 0.2 0.4 0.6 0.8 1.0 1.2
1999/00 2000/01 2001/02 2002/03 2003/04 2004/05 2005/06 2006/07
%
G
N
I
Primary Secondary Post-basic Other
Source: Author’s calculations from Planning commission (various years).
Notes: Original budget data is used. A time series of the revised development budget broken down by project is unavailable. For details of how sub-sectoral budget allocations have been calculated see the Annex.
Figure 3 shows that the composition and level of development spending on education has fluctuated considerably more than the revenue budget. Development spending appears to have been higher before 2002/03 and in particular for basic education. For example, the development budget going to primary education dropped from 0.5% of national income in 2002/03 to less than 0.3% in 2003/04 (see Figure 3). This large decline in development spending on primary education was due to the completion of some large development projects and a decline in the amount of funds allocated to the primary stipends scheme.9
In 2004/05 the introduction of PEDP II significantly reversed this decline although its original allocation of Tk. 700 million in the 2004/05 ADP was revised to just Tk. 240 million (not shown in Figure 3).
On average, 75-80% of the total education development budget is devoted to basic education and this has remained relatively stable despite fluctuations in the total education development budget shown in Figure 3. Primary education accounts for the majority of development spending on basic education. This is likely to be due to the larger number of schools at the primary level and the greater number fully supported by government. Unlike the revenue budget the proportion of basic education development spending devoted to primary education has been increasing since 1999/00. In 2005/06, 75% of basic education development spending was devoted to primary education compared to only 60% in 1999/00.
development side it has increased. The decline in the share of recurrent spending going to primary is likely to have been driven by the faster expansion in secondary enrolment while the beginning of the large PEDP II has been responsible for the increase in the share of development spending assigned to primary.
Composition of public spending on basic education
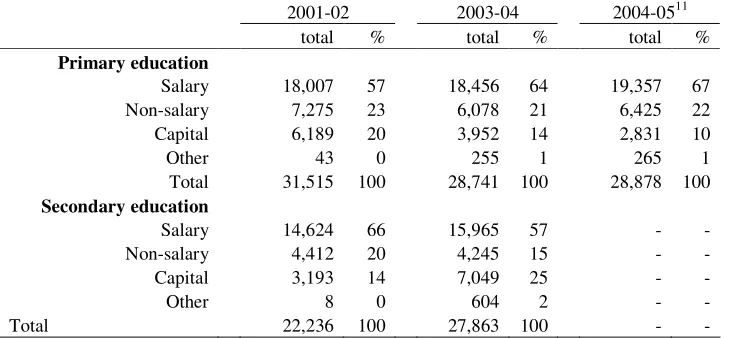
A large proportion of the education revenue budget is allocated to personnel costs. In fact, approximately 98% of the revenue budget allocated for primary education is for salaries and allowances, a percentage which has not changed since the beginning of the decade.10 A similar pattern prevails in secondary although given the much greater proportion of the budget going to support the salaries of teachers in non-government secondary institutions over 99% of the revenue budget is for teachers. However, a great deal of non-salary recurrent spending occurs on the development side of the budget. Most notably, stipends provided to basic education students are drawn from the development side of the budget as is the provision of textbooks to primary school students.
Table 3: Composition of total public education spending, various years (constant 2006/07 Taka millions)
2001-02 2003-04 2004-0511 total % total % total %
Primary education
Salary 18,007 57 18,456 64 19,357 67 Non-salary 7,275 23 6,078 21 6,425 22 Capital 6,189 20 3,952 14 2,831 10 Other 43 0 255 1 265 1 Total 31,515 100 28,741 100 28,878 100
Secondary education
Salary 14,624 66 15,965 57 - - Non-salary 4,412 20 4,245 15 - - Capital 3,193 14 7,049 25 - - Other 8 0 604 2 - - Total 22,236 100 27,863 100 - -
Source: Author’s calculations from CGA unaudited accounts, MoPME (2002; 2003a; 2005) and MoE (2002; 2003). Bangladesh Bureau of Statistics GDP deflator is used to express the data in constant 2006/07 prices.
Notes: Revenue expenditure for primary and secondary education is defined in the same way as in Figure 2. Primary development spending is based on total MoPME development spending excluding non-formal education projects. 2001/02 secondary education development spending is based on total Directorate of Secondary and Higher Education projects. For 2003/04 secondary education spending is based on the overall Ministry of Education development budget and is therefore not comparable with 2001/02 or other tables and figures in the paper. No attempt has been made to apportion development spending on madrasahs between primary and secondary education and therefore all this spending is recorded under secondary education.
[image:10.612.111.479.328.497.2]programme currently underway as part of PEDP II.13 Recent data on the composition of development spending is difficult to obtain for secondary education.14 However, where information is available it does suggest a similar breakdown (see Table 3).
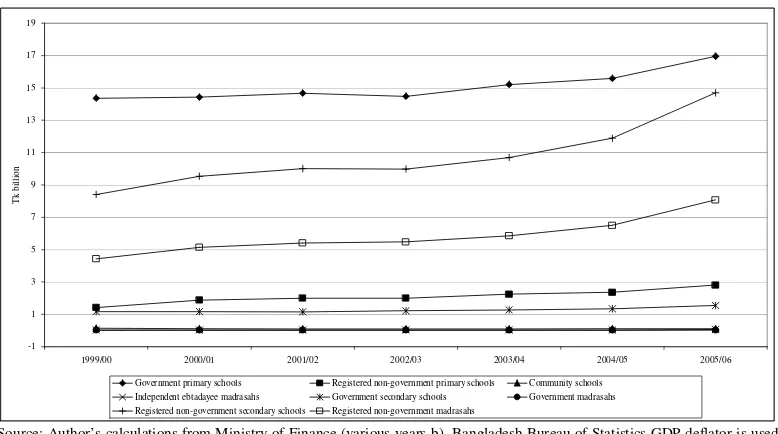
Trends in government spending by provider
While real spending on education appears to have been increasing steadily, have there been any shifts in spending across the different providers outlined in Table 2? Patterns shown in Figure 4 generally follow those shown in Figure 1 for the overall education budget. Until 2004/05 rates of budget increase amongst the different providers were similar. However, after 2004/05 the non-government secondary school and madrasah sub-sector as a whole saw faster increases in the amount of budgetary allocation than other providers of education. This could be because more institutions have been registered to receive government support. It may also be the case that more teachers are now included on the payroll of existing registered madrasahs and secondary schools.15 Unfortunately, no information on enrolment or the number of secondary institutions is available after 2003 and therefore it is not possible to explore this further.
Figure 4: Trends in the education revenue budget by education provider (constant 2006/07 prices)
-1 1 3 5 7 9 11 13 15 17 19
1999/00 2000/01 2001/02 2002/03 2003/04 2004/05 2005/06
T
k
b
il
li
o
n
Government primary schools Registered non-government primary schools Community schools Independent ebtadayee madrasahs Government secondary schools Government madrasahs Registered non-government secondary schools Registered non-government madrasahs
Source: Author’s calculations from Ministry of Finance (various years-b). Bangladesh Bureau of Statistics GDP deflator is used to express the data in constant 2006/07 prices.
Notes: Revised budget data for each year is used. Registered non-government madrasahs also includes spending on the ebtedayee and post-basic sections of these madrasahs.
Government per student spending in basic education
[image:11.612.112.501.349.566.2]level increases in per pupil spending are proportionately larger than budget increases owing to the declining enrolment in much of the primary education system supported by government (see Table 1).16
Before looking at differences across providers it is useful to understand the legal framework under which primary schools operate. With the exception of examination and scholarship fees, primary schools receiving government support are not allowed to directly charge fees to their students. While there is some scope for school managing committees to raise contributions from the local community for school development, a school’s ability to raise funds for operating expenses is severely constrained. Therefore, these schools are heavily dependent on government funding for the bulk of their operating expenses.
[image:12.612.118.503.402.557.2]Table 4 shows that government funding of registered non-government primary schools is very low compared to government schools. On the whole, differences in government support to teachers explains this funding difference. As Table 2 shows, teachers in registered non-government schools receive 90% of the basic pay of a government teacher and some very limited allowances. Using current government pay scales the average government school teacher earns two to three times the amount that a non-government primary school teacher receives. While non-government schools are supposed to supplement the income of their teachers this rarely happens in practice owing to the very limited funding available to these schools and the legal limitations in raising revenue from fees.
Table 4: Expenditure per student in basic education (constant 2006/07 Taka)
Primary Secondary
2001 2005 1999 2003
Revenue Spending per student
Government schools 1,355 1,788 5,288 5,686 Registered non-government schools 479 786 1,197 1,353 Government Alia madrasahs 4,106 3,797 4,106 3,797 Recognised non-government Alia madrasahs 1,426 1,704 1,426 1,704 Independent ebtadayee madrasahs 52 65 - -
Community schools 177 235 - -
Development spending per student 914 1,083 805 868
Sources: Author’s calculations from DPE (2002a; 2006a), BANBEIS (2004; 2006), Ministry of Finance (various years-b), and Planning Commission (various years). Bangladesh Bureau of Statistics GDP deflator is used to express the data in constant 2006/07 prices.
Notes: Development spending is attributed to primary and secondary education as described in the annex. It is very difficult to break down per-pupil spending between primary and secondary in madrasahs since all Alia madrasahs have an ebtadayee (primary) section. No attempt was therefore made to do this and it is assumed that government per pupil spending is the same in all sections (primary, secondary etc.) of madrasahs.
motivation and retention. How do teacher salaries compare with other comparably qualified individuals in Bangladesh? Using data from 2000, Asadullah (2005) shows that teachers in non-government schools are paid significantly less than non-teachers in the private sector with similar levels of education and other characteristics. The paper also shows that there are no significant differences in the pay of government teachers and non-government teachers (Asadullah 2005). This pattern is confirmed by looking at salary scales for other government workers in the social sectors. For example, medical assistants who require similar levels of educational qualifications and training as teachers are on a similar salary scale. Comparing pay with teachers in other countries in the region suggests that government teachers in Bangladesh are paid a similar amount although non-government teachers are paid substantially less. For example, government teacher salaries in Bangladesh tend to be in the order of three to four times GDP per capita compared to 3.4 and 3.6 times GDP per capita in India and Pakistan respectively (Bennell 2004). Non-government primary school teachers get paid approximately the same as average GDP per capita and hence substantially less than teachers in other countries of the region.17
The much greater salaries that teachers in government schools receive compared to their non-government counterparts seems to imply much larger differences in per-student funding than those shown in Table 4. However, higher paid teachers in government schools teach more students on average and hence spread their costs over a greater number of students. For example, in 2005 the pupil teacher ratio in government primary schools was 58:1 compared to 46:1 in registered non-government primary schools (DPE 2006a).
Among primary schools that are supported by government, the poorest funded are independent ebtadayee madrasahs and community schools. In these schools government funding is extremely low and again the differences are largely to do with support to teachers; teachers receive only Tk. 750 per month and this is the only revenue funding they receive.18 It is interesting to note that independent ebtadayee madrasahs are very poorly supported by government compared to ebtadayee sections of high madrasahs. This seems unusual given that the schools are providing a similar type of education and like other primary schools are not allowed to charge fees.
Table 4 also reports development spending per student. It is not possible to break this down by school type as most projects cover more than one school type and disaggregated information is unavailable. The data reveal that development spending at primary is very high compared to revenue spending for some school types.19 For example, development spending on non-government primary schools tends to be higher than revenue spending. In a similar way to revenue spending, development spending has shown an upward trend in both primary and secondary education during the 2000s. Again, this reflects increased spending on education as well as for primary, declines in enrolment.
Furthermore, the maximum annual payment on the primary programme for an individual child is Tk.1,200 compared to Tk. 960 for female secondary stipend participants.20
International comparisons of government per student spending in basic education
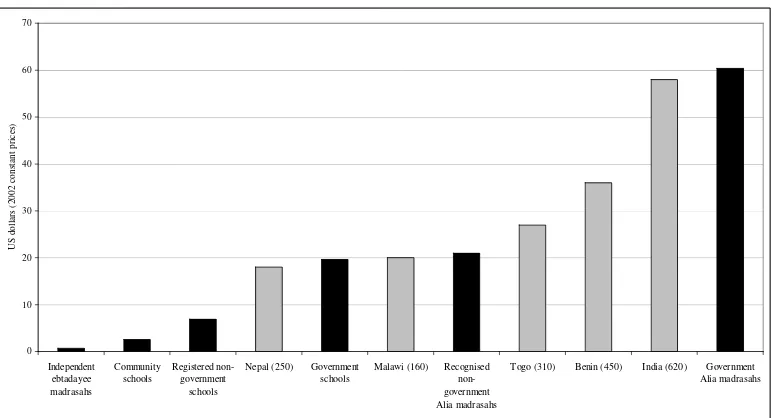
How does per pupil spending on primary education in Bangladesh compare to other countries? Figure 5 reports revenue spending per pupil in the different types of primary schools in Bangladesh and compares these with spending in other countries within the region and some other developing countries. Table 2 showed that in terms of primary schooling, government and registered non-government schools provide the lion’s share of access. Figure 5 shows that per student funding in non-government schools is very low compared to other countries within the region. For example, Nepal, with an income per capita level nearly half that of Bangladesh, provides almost three times as much public funding per student than Bangladesh provides to its non-government schools. Government school funding per student in Bangladesh is similar to Nepal and Malawi although both these countries achieve these levels of funding at much lower levels of per capita income.
Figure 5: Recurrent primary education expenditure per student in a selection of developing countries in 2001-2002 (constant 2002 US dollars)
0 10 20 30 40 50 60 70
Independent ebtadayee madrasahs
Community schools
Registered non-government
schools
Nepal (250) Government schools
Malawi (160) Recognised non-government Alia madrasahs
Togo (310) Benin (450) India (620) Government Alia madrasahs
U
S
d
o
ll
ar
s
(2
0
0
2
c
o
n
st
an
t
p
ri
ce
s)
Source: Bangladesh data is for 2003 and is taken from Table 3. Other country data refers to 2002 and is from UNESCO (2006). Notes: Figures in parentheses are GNI per capita figures in US dollars for 2004. For Bangladesh, GNI per capita in the same year is US$ 440. India data are for 2001/02 and similar to Nepal are estimates.
[image:14.612.114.501.349.558.2]Registered non-government madrasahs receive a slightly higher per student allocation than non-government schools but this is largely driven by the much lower pupil teacher ratios in these schools. For example, in 2003 the pupil teacher ratio in non-government secondary schools was 40 compared to only 27 in Dakhil madrasahs.21
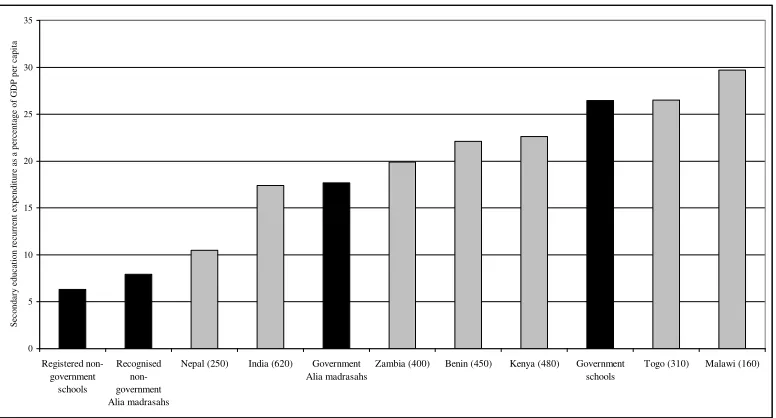
[image:15.612.113.501.408.617.2]Comparing public per student secondary education recurrent expenditure in Bangladesh with other countries reveals some interesting patterns. While government secondary school spending tends to compare quite well with other countries spending on non-government schools and madrasahs is very low (see Figure 6). It should be noted however that the data shown in Figure 6 are not directly comparable. Other school systems have different providers and it is possible that the country averages hide large differences in funding across different school types. However, they are similar to a weighted average and therefore still show substantially larger levels of resourcing for the majority of school types compared to registered non-government schools in Bangladesh. It is also the case that figures for other countries include the whole of secondary while the Bangladesh figures exclude higher secondary (see notes to Figure 6). It is possible, therefore, that increased spending in the higher grades increases per-student spending averages for the other countries shown in the figure. While this may be true it is also the case that higher secondary provision in colleges in Bangladesh is funded in a similar way to secondary schools. Therefore, including the two years of higher secondary in Bangladesh is unlikely to alter substantially the figures shown in Figure 6.
Figure 6: Recurrent secondary education spending as a percentage of GDP per capita in a selection of developing countries (2003)
0 5 10 15 20 25 30 35 Registered non-government schools Recognised non-government Alia madrasahs
Nepal (250) India (620) Government Alia madrasahs
Zambia (400) Benin (450) Kenya (480) Government schools
Togo (310) Malawi (160)
S ec o n d ar y e d u ca ti o n r e cu rr en t ex p e n d it u re a s a p er ce n ta g e o f G D P p er c ap it a
Source: Bangladesh data is for 2001 and is taken from Table 4. Other developing country data is taken from UNESCO Institute of Statistics (2006).
Notes: Figures in parentheses are GNI per capita figures in US dollars for 2004. For Bangladesh, GNI per capita in the same year is US$ 440. Other country data refers to 2003 except for Zambia and Togo (2000) and Benin (2002). Country comparisons need to be treated with caution as secondary education covers a different number of years in each country. For this paper secondary education (excluding higher secondary) in Bangladesh lasts for 5 years as it also does in Zambia. In India, Nepal, Benin and Togo it lasts for 7 years and in Kenya and Malawi 6 years.
particularly at the primary level. It is not known whether all recurrent spending has been included for the other countries used to compare with Bangladesh. However, even if development spending is included, per pupil spending still appears low in Bangladesh compared to other countries (see Table 4).
4. Private spending on education and equity
[image:16.612.114.538.300.431.2]How does private spending on education alter levels of overall spending on education? Table 5 shows that private spending is a very important component of education spending, often outweighing government contributions. Private spending as a proportion of total spending tends to increase as one moves up the basic education system and this is largely driven by increased spending on private tuition (CAMPE 2001; CAMPE 2006). Perhaps unsurprisingly, Table 5 shows that in schools receiving little government support (i.e. community schools and ebtedayee madrasahs) private spending makes up the lion’s share of total spending.
Table 5: Annual private and public spending in basic education (constant 1996 prices)
Primary (2000-2001) Secondary (2003-2005)
public private total %
priv public private total % priv
Government schools 1,355 1,034 2,388 43 5,686 12,689 18,375 69 Registered non-government schools 479 815 1,294 63 1,353 6,704 8,057 83 Government Alia madrasahs 4,106 - - - 3,797 - - - Recognised non-government Alia
madrasahs 1,426 1,532 2,958 52 1,704 4,736 6,440 74 Independent ebtadayee madrasahs 52 1,103 1,155 95 - - - - Community schools 177 552 730 76 - - - - Source: Public per spending per student taken from Table 4. Primary private spending per student - Table 6.5 CAMPE (2001). Secondary private spending per student - Annex Table 7.2 CAMPE (2006). Bangladesh Bureau of Statistics GDP deflator is used to express the data in constant 2006/07 prices.
Notes: Data on public spending for primary (secondary) is for 2001 (2003) whereas private spending data is for 2000 (2005). In CAMPE (2001) private spending at the primary level is reported for nine months. These figures have been inflated to give an annual estimate for the purposes of comparison. Private spending on government schools includes both registered and registered schools although these schools make up very small proportion of the total. Private spending on recognised non-government Alia madrasahs may also include unregistered madrasahs as well as students from the three non-government madrasahs.
Table 5 shows that in most cases private spending tends to narrow differences in spending per student in the different school types.22 For example, government spends 3-4 times as much on government primary and secondary schools students compared to students in registered non-government schools. Private spending differences between the school types are much smaller and imply that total spending per student (both public and private) is only twice as high in government primary and secondary schools. However, even though the differentials decrease once private spending is included they remain large.
reflected in public spending; primary education spending tends to be relatively equitable whereas secondary education expenditure is concentrated on the non-poor (World Bank 2001). 25
Figure 7: Gross enrolment rates by poverty status, 2003
0 20 40 60 80 100 120 140
primary secondary
G
ro
s
s
e
n
ro
lm
e
n
t
ra
te
(
%
)
low middle high total
Source: Table 5.2, Ahmed and Sharmeen (2004).
Surprisingly little is known about the socioeconomic status of students attending different types of primary schools and this represents a serious gap in the research literature.Using data from the 2000 Household Income and Expenditure Survey the World Bank (2006) showed that schools receiving government support had a similar proportion of poor students. For example, 34% of government primary school students came from the poorest 40% of households compared to 33% in madrasahs and 27% in registered non-government schools. While these findings need to be treated cautiously they suggest that the large differences in public per pupil spending across different service providers are distributionally neutral. 26
size of the government secondary school sector it is unlikely to skew public spending towards the rich much further than it already is (see Figure 7 and World Bank 2001).
5. Education outcomes
[image:18.612.110.473.262.357.2]How do education outcomes differ between education providers? Table 6 shows that in terms of learning outcomes the primary education system is characterised by relatively low levels of achievement. Only slightly over half of the competencies that students are expected to have achieved by the end of the primary cycle are actually achieved by students. Table 6 also shows that differences in the number of competencies achieved are small across different education providers.
Table 6: Primary education outcome indicators
School type
Average number of competencies achieved (out of a total of 27) for
Class 5 students, 2000
Survival rate to Class 5, 2002
Male female total male female Total Government 15 17 16 63 70 n/a Non-government 15 15 15 49 53 n/a Non-formal 17 18 17 n/a n/a n/a
Total 16 17 16 58 63 61
Source: Achievement of competencies - Table 4.13 CAMPE (2001) (2001). Survival rates - DPE (2006a).
Notes: Private unaided schools are included with non-government schools for the competency data. Survival rates are calculated using reconstructed cohort methods. Total survival rates shown in the table only include government recognised primary education institutions and hence do not include non-formal schools.
Completing primary education is seen to be an important step in realising benefits associated with education such as basic literacy and numeracy. In a survey conducted in 2002 it was found that about two thirds of individuals that had completed primary education were literate compared to 15% of individuals that had only completed two years of education (CAMPE 2003). Table 6 shows that only 60% of children that enrol in Class 1 reach the final grade of primary school. This implies that at least 40% of primary school entrants fail to complete primary education and to achieve even basic literacy. It is also important to note that survival rates differ across school types; government schools are more successful at retaining their students than non-government schools.
Table 7: Secondary education outcome indicators
School type
Percentage of students achieving grade point averages (maximum 5) in surveyed
schools, 2004
Survival and completion rates, 2004/05
4-5 2-4 less than 2
Survival rate (%)
Completion rate (%)
Government 36 56 8 74 57
Non-government 18 70 12 40 19 Dakhil madrasah 19 69 13 37 28 Source: GPA scores - Annex Table 6.7 CAMPE (2006). Survival and completion rates - Table 6.4 CAMPE (2006).
Notes: Survival and completion rates are based on reconstructed cohort methods using 2004/05 data. The survival rate is the percentage of a hypothetical cohort of Class 6 students reaching Class 10. The completion rate is the percentage of a hypothetical cohort of Class 6 students successfully passing the SSC at Class 10. Non-government includes both registered and unregistered schools and whether Dakhil madrasahs only include government recognised madrasahs is not reported.
Evidence on education outcomes at the secondary level are more scarce. Information on SSC results in the 2005 CAMPE survey schools show that in similar examinations government secondary school students tend to outperform their non-government school counterparts (CAMPE 2006). For example, more than twice the number of government students achieve a GPA of four or above compared to non-government school students (see Table 7). While Dakhil madrasah students appear to do equally well in the SSC examination when compared to non-government students it should be recalled that the Dakhil examination is equivalent but not directly comparable to the SSC examination. However, a study conducted by the World Bank to assess the impact of their support to the female stipends programme showed that differences in mathematics achievement between secondary schools and madrasahs was small. The average score on a mathematics test given to Class 6 students was 36 and 38% for madrasah and secondary school students respectively (Asadullah, Chaudhury et al. 2006).28
The limited evidence available on learning outcomes suggests that differences between madrasah and non-government students are small and the largest disparities are between these schools and the small number of government schools. A similar pattern emerges when survival and completion rates are compared (see Table 7). Differences between outcomes across secondary school types do appear to be similar to patterns in private and public spending (see Table 5); government secondary school students appear to do better and substantially more is invested in government students by government and households alike.
6. Conclusions
to public spending means that a comparatively small share of national income is also spent on education relative to other countries.
Putting together the information on trends in spending and enrolment shows that per student spending has increased in most basic education school types. This has been due to an increase in real revenue spending combined with declines in overall enrolment levels in government supported schools. Despite these increases, public funding per student in Bangladesh remains low and there are large disparities across providers with particularly low levels of support to primary and secondary non-government schools.
Primary school completion rates are low in Bangladesh and for students who make it to the end of primary, learning outcomes are often poor. These findings represent not only a missed opportunity for a large proportion of children enrolling in primary school but also a poor return on the massive investment both government and households make. The paper has shown that primary education outcomes were largely the same across school types even though there are substantial differences in public subsidies. It is tempting to conclude from this evidence that registered non-government primary schools are more cost-effective than the non-government sector; they provide similar outcomes for a much lower level of per pupil spending (both public and private). However, this assumes direct causation between spending and education outcomes. In other developing country contexts, more detailed analysis controlling for other factors that determine learning outcomes, has found this link to be at best weak (see for example, Heyneman and Loxley 1983; Fuller 1987; Fuller and Clarke 1994; Fuller, Hua et al. 1994; Riddell 1997). Further research exploring differences in education outcomes by school type, controlling for all factors determining these outcomes is clearly needed. However, it seems clear primary schools in general are underfunded and increasing investment across all school types will be needed if education outcomes are to be improved.
Patterns in education outcomes across the different types of secondary school types appear to be similar to patterns in per pupil spending. It is also clear that richer households send their children to government schools and combined with higher levels of per pupil spending these students have better outcomes than their poorer counterparts in the mass education system (i.e. registered non-government secondary schools and madrasahs). While narrowing government funding differences between government and non-government schools is important for equity it should be borne in mind how small government secondary education provision is. Potentially more worrying is the low level of completion in the secondary education system. Less than half of the students starting secondary school reach Class 10 and an even smaller proportion pass the SSC. This implies that substantial resources, both public and private, are invested in a system that fails to provide a complete secondary education to most students. The poor quality of secondary education is partly related to the low levels of per-student spending at this level; from an international perspective non-government secondary schools in particular, appear to be poorly funded (see Figure 6).
with similar characteristics working in the private sector. Whenever government salary scales have been reviewed, non-government teachers have improved their pay relative to government teachers although the gap remains large. Non-government teacher pay is a major political issue in Bangladesh evidenced by the large number of national teacher strikes that demand better pay and the nationalisation of non-government schools. It is likely therefore, that the gap in salaries will continue to narrow and this will have a substantial impact on the government education budget. In view of this it is important that teachers are properly trained and supported in order to maximise their effectiveness. Better controls on teacher absenteeism and improvements in the time spent by teachers in the classroom are likely to lead to better student outcomes across the government supported education system.
Endnotes
1 This decline is based on official reported figures. However, the school age population projection for
2001 used by DPE (18.1 million) was much higher than the 2001 census figure (17.1 million) that came out in 2003 (BBS 2003). Using the more accurate census figures for 2001 would imply an overall gross enrolment rate of 103%.
2 Currently there are no agreed school-age population projections that use the latest census of 2001.
While there is general agreement that there has been a slowdown in the rate of growth of this group the magnitude is a source of debate. While one source suggests the school age population has declined the majority suggest a very slow growth in this population since 2000. DPE, using information provided by BBS, suggest that between 2001 and 2005 the primary school age population has grown by approximately 1%. Projections reported in the National Plan of Action also show a similar proportional increase although the actual school age population is much lower. Both sources are also in line with UN population projections which suggest a very slowly increasing population at least until 2010.
3 A similar number of government and non-government schools are recorded in 2001 and 2005 which
suggests that enrolment per school has declined.
4 The accuracy of survival rate information for primary education in 2001 has been questioned. Data
for 2002 shows the survival rate for primary education to be 54% (DPE 2006b).
5 The transition rate between primary and secondary education was reported to be 94% in 2005 (DPE
2006a).
6 Unlike ebtadayee students in high madrasahs, students in independent ebtadayee madrasahs are able
to participate in the primary stipend programme which offers guardians of poor primary school students a quarterly cash stipend conditional on school attendance and examination performance (see DPE 2002b). While schools and madrasahs do not directly receive any benefit from the stipends programme its objective is to provide poor families with resources to support their childrens’ education.
7 The revised development budget for 2004/05 was only 51% of the original budget.
8 The budget is revised in the second half of the financial year to reflect spending in the first half of
the year as well as adjusting the remaining budget for revised revenue forecasts. For further details of the budgetary process see Ministry of Finance (2005).
9 The decline in real resources to education in 2003-04 is primarily driven by a substantial decline in
the ADP for primary education. A large project (ADB development of primary education in Chittagong, Sylhet and Barisal) was completed the year before and other projects began to wind down, spending much less than in the previous year. In addition the primary stipends scheme allocation was much smaller in this year. In 2004/05 the introduction of PEDP II significantly reversed this decline. However, the original allocation of Tk. 700 million in the 2004/05 ADP was revised to just Tk. 240 million.
10 The figures here are exclusively for the education budget allocated to government primary schools,
petty maintenance and non-government primary schools and ebtedayee madrasahs. They do not include administration and PTIs.
11 For 2004/05, actual primary education spending is low compared to budget figures because only
51% of the development budget was spent. This was largely due to the slow implementation of PEDP II at the start; budget execution for this project was only 34%.
12 Textbooks are centrally produced and more than 60 million textbooks are distributed each year. 13 In 2005/06 Tk. 9.2 billion was spent on construction in primary compared to only Tk. 1.7 billion in
2004/05 (MoPME 2006).
14 Financial management units, set up in the education ministries, are responsible for providing this
information. However, reports for all years were not available from this unit in the MOE and it is unclear whether they are continuing to collect this information. CGA accounts also include development spending but crucially do not include Direct Project Aid (DPA) which does not pass through government accounting systems.
15 Salary increases amongst teachers in 2004/05 across different providers were similar and therefore
this cannot account for the differences.
16 For example, real revenue expenditure on government primary schools increased by 13% between
2001 and 2005 whereas unit expenditures increased by 30%.
17 Calculations of pay for teachers in Bangladesh are based on a trained assistant teacher and use
18 Like other primary schools, however, they do receive free textbooks and their students also receive
stipends.
19 Independent ebtadayee madrasahs in rural areas are eligible to participate in the primary school
stipends scheme whereas ebtadayee sections of higher madrasahs are not. While it is also the case that primary sections attached to general secondary schools do not qualify for stipend funding the number of students are much smaller; in 2005 there were over 1 million primary school students enrolled in higher madrasahs compared to only 156,000 enrolled in high schools.
20 Figures for the maximum stipend payment at secondary are based on a non-government student in
Class 10 and exclude a one-off Tk. 250 payment received for SSC registration.
21 The madrasah figure includes teachers and students enrolled in the ebtadayee sections of Dakhil
madrasahs.
22 Table 5 puts together the most up to date information that can be used to compare private and
public spending across different school types. As the notes to the table suggest the precise numbers should be treated with caution. More recent information on household spending on education is available but this is often not disaggregated by school type.
23 A similar pattern was found in the HIES 2000; in junior secondary the junior secondary (secondary)
enrolment rate for the poorest 20% of the population was 26 (8)% compared to 53 (96)% for the richest 20% of the population (World Bank 2001).
24 It should be noted that national gross enrolment rates reported by the Directorate of Primary
Education around the same time showed slightly lower enrolment rates (see DPE 2002a).
25 The public education expenditure incidence analysis conducted as part of the World Bank and ADB
poverty assessment in 2001 did not differentiate between school types at the primary level (World Bank 2001).
26 The question asking which type of school the student was currently attending was only asked to
students that were literate. Therefore many students in primary did not respond to this question. Given that illiterate individuals are disproportionately poor it is likely that these figures are biased.
27 See Table 7.2 (CAMPE 2006).
28 The World Bank supported component of the female stipends programme covers approximately a
References
Ahmed, A. U. and T. Sharmeen (2004). Assessing the performance of conditional cash transfer programs for girls and boys in primary and secondary schools in Bangladesh. Washington, International Food Policy Research Institute: 85.
Asadullah, M., N (2005). "Pay differences between teachers and other occupations: Some empirical evidence from Bangladesh." Skills, Knowledge and Organisational Performance (SKOPE) research paper. No:58: 29.
Asadullah, M., N, N. Chaudhury, et al. (2006). "Religious schools, social values and economic attitudes: evidence from Bangladesh." SKOPE and World Bank. No.
Bangladesh Bureau of Educational Information and Statistics (BANBEIS) (2004). Educational Institution Survey (Post Primary)-2003. Dhaka, Ministry of Education, Government of Bangladesh: 127.
Bangladesh Bureau of Educational Information and Statistics (BANBEIS). (2006). "Secondary education statistics " Retrieved 16 December 2006, from
http://www.banbeis.gov.bd/.
Bangladesh Bureau of Statistics (BBS) (2003). Population Census 2001: National report (provisional). Dhaka, Planning Division, Ministry of Planning, Government of Bangladesh: 731.
Bangladesh Bureau of Statistics (BBS) (2006). Preliminary report on Household Income and Expenditure Survey (HIES) - 2005. Dhaka, Bangladesh Bureau of Statistics: 94.
Bennell, P. (2004). Teacher motivation and incentives in Africa and Asia. Brighton, Knowledge and Skills for Development: 60.
CAMPE (2001). Education Watch 2000. A question of quality: State of Primary Education in Bangladesh. Dhaka, Campaign for Popular Education.
CAMPE (2003). Education Watch 2002. Need for a new vision. Dhaka, Campaign for Popular Education.
CAMPE (2006). Education Watch 2005. The state of secondary education: Progress and challenges. Dhaka, Campaign for Popular Education.
Directorate of Primary Education (DPE) (2002a). Primary Education Statistics in Bangladesh - 2001. Dhaka, Primary and Mass Education Division, Government of the Peoples' Republic of Bangladesh: 146.
Directorate of Primary Education (DPE) (2004). Second quarter adjustment bill. Dhaka, Primary education stipend project, Directorate of Primary Education, Ministry of Primary and Mass Education, Government of Bangladesh.
Directorate of Primary Education (DPE) (2006a). Baseline survey of Second Primary Education Development Programme (PEDP-II) - draft report. Dhaka, Ministry of Primary and Mass Education, Government of the Peoples' Republic of Bangladesh:
92.
Directorate of Primary Education (DPE) (2006b). Primary Education Statistics in Bangladesh - 2002. Dhaka, Primary and Mass Education Division, Government of the Peoples' Republic of Bangladesh.
Fuller, B. (1987). "What School Factors Raise Achievement in the Third World?" Review of Educational Research 57(3): 255-292.
Fuller, B. and P. Clarke (1994). "Raising School Effects While Ignoring Culture? Local Conditions and the Influences of Classroom Tools, Rules, and Pedagogy." Review of Educational Research 64(1): 119-157.
Fuller, B., H. Hua, et al. (1994). "When Girls Learn More than Boys: The Influence of Time in School and Pedagogy in Botswana." Comparative Education Review 38(3): 347-376.
Heyneman, S. and W. Loxley (1983). "The effect of primary school quality on academic achievement across twenty-nine high and low-income countries." American Journal of Sociology 88: 1162-1194.
Ministry of Education (MoE) (2002). Financial management report on development projects. Dhaka, Financial Management Unit, Ministry of Education, Government of Bangladesh.
Ministry of Education (MoE) (2003). Financial management report on development projects. Dhaka, Financial Management Unit, Ministry of Education, Government of Bangladesh.
Ministry of Finance (2005). Public expenditure management manual. Dhaka, Finance division, Ministry of Finance, Government of Bangladesh: 184.
Ministry of Finance (various years-a). Budget in brief. Dhaka, Finance division, Government of Bangladesh.
Ministry of Finance (various years-b). Detailed budget estimates. Dhaka, Finance Division, Government of Bangladesh.
Ministry of Primary and Mass Education (MoPME) (2003a). Annual development programme, Monthly management reports, financial and physical progress. Dhaka, Financial management unit, Ministry of Primary and Mass Education, Government of Bangladesh.
Ministry of Primary and Mass Education (MoPME) (2003b). Second primary education development programme (PEDP II): Programme Memorandum. Dhaka, Ministry of Primary and Mass Education, Government of Bangladesh.
Ministry of Primary and Mass Education (MoPME) (2005). Annual development programme, Monthly management reports, financial and physical progress. Dhaka, Financial management unit, Ministry of Primary and Mass Education, Government of Bangladesh.
Ministry of Primary and Mass Education (MoPME) (2006). Annual development programme, Monthly management reports, financial and physical progress. Dhaka, Financial management unit, Ministry of Primary and Mass Education, Government of Bangladesh.
Planning Commission (various years). Annual development programme. Dhaka, Government of Bangladesh.
Riddell, A. (1997). "Assessing Designs for School Effectiveness Research and School Improvement in Developing Countries." Comparative Education Review 41(2): 178-204.
UNESCO (2006). Education for All: Literacy for Life EFA Global Monitoring Report 2006. Paris, UNESCO: 447.
UNESCO Institute of Statistics. (2006). "Statistical tables." Retrieved 15 October
2006, from
http://www.uis.unesco.org/ev.php?URL_ID=5187&URL_DO=DO_TOPIC&URL_S
ECTION=201.
World Bank (2001). "Benefit Incidence Analysis: Education and Health Sectors." Bangladesh poverty assessment working paper. No:6.
Annex: Data used for public expenditure and budget analysis
The tables and figures in Section 3 of the paper are produced from five main sources:
1. Ministry of Finance detailed revenue budget estimates. Published on an annual basis these estimates provide a detailed breakdown of the revenue side of the government budget by function (e.g. government primary schools) and economic code (e.g. salaries and allowances).
2. Ministry of Finance budget in brief. Published on an annual basis these publications are used in Section 3 for the overall government revenue and development budget. The budget in brief is generally produced before the detailed budget estimates and there are often small discrepancies between the two sources (compare Annex Table 1 with Annex Table 3).
3. Planning Commission’s Annual Development Programmes. These annual reports provide detailed information on all government projects currently underway in each sector. Section 3 uses this source to report budgeted development expenditures.
4. Unaudited CGA accounts. This source has been used for actual revenue expenditures.
5. Financial Management Unit annual development reports. These reports contain detailed actual expenditure information on the annual development programme.
Annex Table 1: Trends in the revised government budget (Tk. million)
1999/00 2000/01 2001/02 2002/03 2003/04 2004/05 2005/06 2006/07
Total government budget
revised revenue 184,440 206,620 226,920 253,070 283,900 333,240 380,700 437,200 revised development 165,000 182,000 160,000 171,000 190,000 205,000 215,000 260,000 total budget 349,440 388,620 386,920 424,070 473,900 538,240 595,700 697,200
Total government education budget
revised revenue 32,200 33,440 36,360 38,020 41,080 46,090 62,600 71,050 revised development 20,136 22,946 21,714 25,910 23,421 21,103 28,650 38,620 total budget 52,336 56,386 58,074 63,930 64,501 67,193 91,250 109,670
Education as a percentage of total budget
revised revenue 17.5 16.2 16.0 15.0 14.5 13.8 16.4 16.3 revised development 12.2 12.6 13.6 15.2 12.3 10.3 13.3 14.9 total budget 15.0 14.5 15.0 15.1 13.6 12.5 15.3 15.7
GDP deflator (1996 constant prices)
113.6 115.7 117.5 121.3 126.8 132.2 138.9 146.1
GDP deflator (2006/07 constant prices)
77.8 79.2 80.5 83.0 86.8 90.5 95.1 100.0 Source: Ministry of Finance (various years-a), Planning Commission (various years) and Bangladesh Bureau of Statistics for
GDP deflator.
Annex Table 1 reports the complete information for the total budget and education’s share of that budget. This information is used in Figure 1.
Breaking down the government education budget by education level is complicated by the overlap between the two ministries in their roles and responsibilities for basic education. A major issue is assigning spending on madrasahs between primary and secondary education. While this can only be approximate, the paper uses the proportion of primary and secondary level students in madrasahs to apportion the budget spent on madrasahs between the primary and secondary levels. In 2003, 46% cent of enrolment in Dakhil, Alim, Fazil and Kamil madrasahs supported by government, were in the ebtedayee section (BANBEIS 2006). Therefore, 46% of the MOE budget going to these types of madrasahs is assigned to primary. Dividing the budget in this way assumes that per-student spending in madrasahs is the same for students regardless of the class that they are in.
Annex Table 2: Private registered madrasah enrolment in 2003
No. of madrasahs
Total enrolment (excluding ebtedayee)
Ebtadayee section enrolment in high madrasahs
Dakhil 5,995 1,119,588 n/a
Alim 1,220 310,059 n/a
Fazil 1,030 328,656 n/a
Kamil 162 87,638 n/a
TOTAL 8,407 1,845,941 1,592,766
Source: BANBEIS (2004)
In both ministries a proportion of the budget is used for administration and, in this paper, a separate category for administration is included rather than apportioning administration across the different education levels (see Annex Table 3). As far as possible only expenditure on schools is included in the intrasectoral estimates. The MoE has a separate engineering department that carries out repair and maintenance on post-primary education institutions and often manages construction projects. With no detailed information on how resources are allocated across different post-primary institutions and across school types this information has been reported separately as maintenance with no attempt made to apportion a share to the different sub-sectors.
Annex Table 3: Sub-sectoral budgetary allocations in education (Tk. million)
1999/00 2000/01 2001/02 2002/03 2003/04 2004/05 2005/06
REVENUE
MoPME 13,121 13,783 14,284 14,686 16,304 18,045 21,004 MoE 19,447 22,092 23,105 24,941 28,444 32,769 41,599
Total 32,568 35,875 37,390 39,627 44,748 50,814 62,604
Basic education 23,507 25,793 27,030 27,843 30,914 34,576 42,477
Primary(1-5) 14,198 15,116 15,704 16,088 17,793 19,440 22,905 Secondary(6-10) 9,308 10,677 11,326 11,755 13,121 15,136 19,572 Higher secondary and above 7,582 8,648 8,723 9,394 10,598 12,310 15,084 Administration 874 971 1,063 1,918 2,260 2,538 3,266 Maintenance 502 458 470 470 873 1,184 1,201 Other 103 4 103 2 103 206 576
Total 32,568 35,875 37,390 39,627 44,748 50,814 62,604
DEVELOPMENT
MoPME 10,902 13,190 14,053 17,383 11,059 15,958 16,661 MoE 7,882 8,718 9,269 10,916 11,736 13,506 10,515
Total 18,785 21,908 23,322 28,299 22,794 29,465 27,176
Basic education 14,310 17,374 18,465 22,798 17,242 22,491 21,207
Primary(1-5) 8,796 11,199 12,060 15,705 9,762 14,500 15,946 Secondary(6-10) 5,514 6,175 6,406 7,093 7,480 7,992 5,262 Higher secondary and above 2,106 2,176 2,492 3,464 3,965 5,202 5,089 Non-formal education 2,195 2,138 2,176 1,877 1,458 1,616 771 Other 175 220 190 159 126 156 109
Total 18,785 21,908 23,322 28,299 22,791 29,465 27,176
Source: Ministry of Finance (various years-b) and Planning Commission (various years).
Notes: :Revenue budget data is based on the revised budget except for 2005/06. For development spending original budget data is used as information on the revised development budget broken down by individual projects is unavailable.
It should be noted that MoPME expenditure on Primary teacher training institutes are included in the higher secondary and above category (see Annex Table 3). In Figure 2 revenue budget data is based on the revised budget whereas in Figure 3 the development budget is based on the original budget. A time series of the revised development budget broken down by project was unavailable. Basic information on the projects included in the Annual Development Programme and Financial Management Unit reports was used to allocate projects between different sub-sectors. This was straightforward for MoPME development expenditure but more difficult for post-primary education owing to some projects covering more than one sub-sector. It should also be noted that only investment projects are included in the analysis for this paper. A full list of the projects that are included by sub-sector is available from the author on request.