Histogram Equalization based PCCE Algorithm and
Wiener Filter for Power Reduction
Shivank Kumar Soni
Research Scholar
Computer Science & Engineering Department SATI, Vidisha (M.P.), India
Y. K. Jain,
Ph.DHead Computer Science & Engineering Department SATI, Vidisha (M.P.), India
ABSTRACT
In current scenario, there is a requirement of power saving in multimedia devices such as mobile and televisions. When we increase contrast in these devices, more power to be consumed by display panel. The PCCE algorithm has been developed a framework for power saving and contrast enhancement together in emissive displays. But this algorithm does not give proper results on noisy image due to unwanted pixels of noise. For removing this weakness, we introduced a new method in which image filtered through wiener filter and then use PCCE algorithm for emissive displays. The proposed method give better results than existing method in terms of power saving.
Keywords
Contrast enhancement, Emissive displays, Wiener filter, Image enhancement.
1.
INTRODUCTION
The quick development of digital technologies has made it straightforward to take and process digital photographs. However, when lighting conditions and imaging devices are not ideal we often receive low quality and noisy photographs. Many techniques have been introduced to enhance these low quality images for some factors such as sharpness, brightness, noise level and contrast. In all of these, high contrast is a major quality factor for better visualization of image. Many techniques for contrast enhancement have been developed. For example: histogram based techniques are widely used for enhancing low contrast image. Histogram equalization is a very famous technique for contrast enhancement [1].
Whereas, various contrast enhancement techniques have been developed to improve the qualities of the general image. However, there is a need of power saving in addition to the contrast enhancement in multimedia applications for example mobiles and televisions (these are the examples of multimedia devices), where power saving plays a very important role in addition to the contrast enhancement of image. When contrast is high, a big portion of the power is consumed by display panels for displaying the images in these devices [2] [3], and this trend is carrying to continue as display sizes are getting larger. Therefore, it is required to develop an image processing algorithm, which is capable of saving power in display panels, as well as enhancing image contrast. For planning such a power-constrained contrast-enhancement (PCCE) algorithm, different properties of display panels should be taken.
Display panels can be divided into two categories one is emissive displays and second is non-emissive displays [4]. Emissive displays that do not need external light sources, Cathode-Ray Tubes (CRT), Plasma Display Panels (PDPs), Organic Light-Emitting Diode (OLED), and Field Emissive Displays (FED) are emissive display devices, whereas the Thin-Film Transistor Liquid Crystal Display (TFT-LCD) is a non-emissive device.
Emissive displays have a number of advantages over non-emissive ones, let in high contrast and low-power consumption. First, an emissive display can turn off each individual pixel to express whole darkness and reach a high contrast ratio. Next, in an emissive display, each pixel can be independently driven and the power consumption of a pixel is proportional to its gray level. Thus, an emissive display normally consumes less power than non-emissive displays, in which turn on a backlight regardless of pixel intensities.
To save the power of emissive display, PCCE algorithm for emissive display based on histogram equalization has been developed in 2012 [5]. But when we apply this approach on a noisy image, it does not provide better results due to power consumption of unwanted pixels. A Histogram Equalization based PCCE Algorithm for Emissive Display and Use Wiener Filter for power reduction proposed in this paper. By the use of wiener filter we are trying to improve the performance of PCCE algorithm for noisy gray scale image. In which wiener filter will reduce the unwanted pixels. The proposed method gives better result as compare to existing method for noisy image and does reduce the high power consumption due to unnecessary pixels.
2.
WIENER FILTER
Wiener Filter is a good filter that removes noise and simultaneously de-blurring of the image. The aim of the Wiener filter is to filter out different types of noise effectively [6] [7] such as speckle, poisson, and guassian noise. It is followed a statistical method. Typical filters are designed for a response of desired frequency. The Wiener filter performs filtering from a different angle. One is putative to have knowledge of the spectral properties of the original image and the noise.
Wiener filter:
W 𝑓1, 𝑓2 = 𝐻∗ 𝑓
1,𝑓2 𝑆𝑥𝑥 𝑓1,𝑓2
𝐻 𝑓1,𝑓2 2𝑆𝑥𝑥 𝑓1,𝑓2 +𝑆𝜂𝜂 𝑓1,𝑓2
(1)
Dividing with 𝑆𝑥𝑥 For fine view:
W 𝑓1, 𝑓2 = 𝐻
∗ 𝑓 1,𝑓2
𝐻 𝑓1,𝑓2 2+𝑆𝜂𝜂 𝑓1,𝑓2 𝑆𝑥𝑥 𝑓1,𝑓2
(2)
45
3.
LHM
Log based histogram modification scheme is the extension of histogram modification scheme. HM scheme is further modified by logarithmic function, which is monotonously increases and is able to effectively reduce large values of histogram. Logarithmic function successfully reduces the high dynamic range of images while retaining the details. We use this property, and the application of a logarithmic function to HM scheme, which is called LHM [5]. We use the following logarithm function to convert the input histogram values hk To the modified histogram values mk .
𝑚𝑘 =log (ℎ𝑘 ℎ𝑚𝑎𝑥 10
−µ+ 1)
log (ℎ𝑚𝑎𝑥2 .10−µ+ 1) (3)
Where, hk Is a collection of pixels having intensity k in the input image. hmax Shows the maximum value in the input histogram h and µ is the parameter that controls the level of HM. As µ gets larger, than the denominator of (3) will smaller number due to this mk Becomes almost linearly proportional to hk. Then the histogram will less strongly modified. On the other hands as µ gets smaller, than the numerator of (3) become dominant. Hence, mk Becomes a constant inattentive of hk, making the modified histogram uniformly distributed. In this way, a small value of µ results in stronger HM. In our paper µ fixed at 5 because of fine results.
Whenµ = -∞, The modified histogram is evenly distributed. In the other aftermost case whenµ = ∞ , Histogram has not changed at all. Therefore, by adjusting the single parameter µ, LHM can get the transformation function, which varies between the identity function and the classical HE result.
4.
PCCE ALGORITHM
Power Constrained Contrast enhancement (PCCE) [5] mainly designed for contrast enhancement and power saving in emissive display devices simultaneously. Fig 2 shows the abstract view of this algorithm. In this algorithm firstly applies LHM for contrast overstretching and then use convex optimization theory for minimizing the objective function, power consumption of the
image and adjust the image contrast without lowering the image quality.
A. Model of Power Consumption For Emissive Displays: The power consumption in an emissive display panel that is required to display an image is modelled in this algorithm. In [8], Proposed a pixel-level power model for an OLED display. These experimental results, power consumed to display a single pixel in a gray image can be modelled by
P = Yγ (4)
Where, Y is the gray level of any pixel in the image and γ is due to the gamma correction of the gray values in the gray image format. A tentative γ is 2.2 [9]. In another way of explaining, after transforming the gray values into luminous intensities in the linear gray image format, Credit obtains a linear relationship between the power and the luminous intensities.
Then, Model the total dissipated power (TDP) for displaying a gray scale image by
TDP = N−1i=0 Yiγ (5)
Where, YiIs the gray level of ith pixel in the image and TDP shows the total power consumed by the image in an emissive display panel.
B. Limitations of optimization problem:
Saving the power in an emissive display by incorporating the power model in (5) into the HE technique. Basically There are two targets in our problem, i.e., we try to equalize the histogram and enhancing the image contrast, but we also seek to reduce power consumption by reducing the histogram of the large values of intensities. These objectives can as a limited constrained optimization problem, i.e.,
Minimize 𝐷𝑥 − 𝑚 2 + λℎ𝑡∅𝛾(𝑥)
Subject to 𝑥0= 0, 𝑥𝐿−1= L-1, Dx ≥ 0 (6)
This Objective Function contains mainly two terms Dx − m 2 + αht∅γ(x). Such that Dx − m 2 The term is a histogram equalize term, where, D ∊RL×L Belongs to families of different matrices. x is a column vector and m is the output of LHM (Fig.2). αht∅γ(x) term is a power term in (5). By minimizing the sum of these two terms reduce the total power and enhance the contrast of image consequently. λ denotes the user controllable variable for maintaining these two terms. There are three constrained intensities should be minimum 0 and maximum L-1 (L denotes the highest level) and the differential matrix should not be less than zero.
C. Solution to the optimization problem:
As stated in power consumption model, γ in (4) is due to the gamma correction, and a tentative γ is 2.2. For generalization, let us assume that γ ≥ 1. Then, in [5] shows the power term ht∅γ(x) is a convex function of x , and the problem in (6) becomes a convex optimization problem [10]. On the basis of convex theory, Suggested PCCE algorithm to provide the optimum solution to the problem.
Setting λ in the objective function (6) determine the relative contributions of Dx − m 2 And ht∅γ(x). These two terms are not affected by the resolution of an input image, histogram values in h depend on the resolution of the image. More particularly, we modified the variable by
β = λ × N−1i=0 Yinput ,i (7) c)Gaussian noise and
filtered image
d)Salt & Paper noise and filtered image a)Speckle noise and
filtered image
b)Poisson noise and filtered image
e)Blur image and de-blur image
Fig.1 (a),( b), (c) and (d) are different noisy images and filtering by wiener filter and (e) is a blur image and
Where Yinpu ,,i Is the intensity level of the ith Pixel value in the input image. After that, now we adjust the value of β instead of λ. If the LHM parameter µ is fixed to 5, and γ is fixed to 2.2. And β = 0, then there is no power constrained. Gradually, In this manner, This algorithm deals with the conversion function perfectly, balances the requirements of energy saving and contrast enhancement. Further, the amount of energy saving can be controlled by a single parameter.
[image:3.595.304.542.71.341.2]However, [11] silently may issue a transformation function, which invert the ordering of pixel intensities in the produced image. The inert mapping can put down the image quality severely. On the wayward, the PCCE algorithm forever provides the optimum transformation function, which fulfil all the constraints. Moreover, the proposed algorithm can be employed for any γ which is greater than or equal to 1.
Fig. 2. Flow Diagram Of PCCE Algorithm
5.
PROPOSED METHODOLOGY
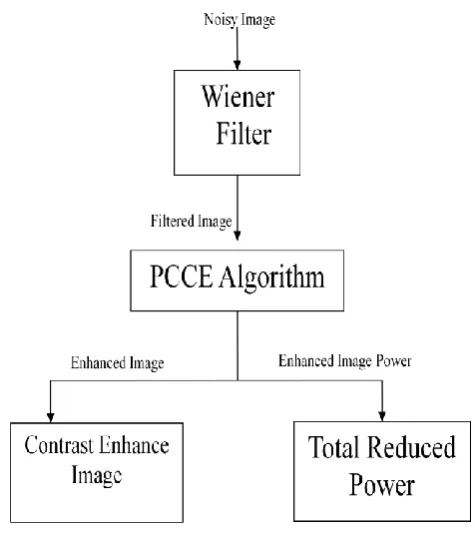
Lee et al. [5] proposed an algorithm (power constrained contrast enhancement for emissive displays based on HE) which enhance image contrast and save power simultaneously for any type of images. If we apply this algorithm on the noisy gray scale image, Algorithm enhances the contrast and reduces the power of a noisy image as mentioned above, but the quality of the image was not maintained and the power of the image becomes large due to unwanted pixels (Noise). We remove this weakness and proposed a new method "PCCE algorithm based on histogram equalization and wiener filter for power reduction". Fig.3 gives the overview of proposed method The proposed technique works under following modules:
Wiener Filter.
LHM
PCCE Algorithm
Fig.3 Flow Diagram Of Proposed Method
A.Working of Wiener Filter:
Wiener filter eliminates the additive noise and inverts the blurring simultaneously. The Wiener filter is optimum with respect to the mean square error.
The steps performed by wiener filter:
To the Wiener filter put into practice, we need to estimate the power spectra of the original image and the additive noise.
For additive white noise, the power range is equal to the variance of the noise.
To estimate the power spectrum of the original image data, many methods can be used. A direct determination of the estimated value of the power spectrum calculated from the observed:
𝑆𝑦𝑦𝑝𝑒𝑟 = 1
𝑁2 𝑌(𝑘, 𝑙)𝑌(𝑘, 𝑙)∗ (8)
Where, Y (k, l) is the DFT of the observation.
Flow diagram in Fig.3 shows the proposed method. Firstly, we input a gray-scale noisy image to the wiener filter for removing noise from the image and maintained the objects clarity. Then we gives filtered image to the PCCE algorithm (maintained in previous section) for image enhancement and power reduction. Finally, we found two outputs one is enhanced image and second is Total dissipated power.
6.
RESULTS ANALYSIS
[image:3.595.55.292.242.549.2]47 Fig.4 shows all results of PCCE algorithm such as original
image, noisy image, HE image, LHM image, optimized image and power has been calculated before and after the optimization. Fig.5 shows all the possible results of the proposed method on the noisy Lena Image such as noisy image, filtered image, HE image, LHM image, optimized image and here after calculating the power. We can see that image after optimization objects of image are clear and power has been reduced as compared to PCCE algorithm.
A. PCCE Algorithm results for Lena image with Poisson noise:
Power consumption on noisy Lena image by PCCE algorithm:
Table 1 TDP
Total power Before Optimization 8.6985e+03
Total power after optimization 5.6800e+03
We evaluate the performance of the PCCE algorithm on the first test image "Lena". In Fig. 4(a) we considered a gray scale standard Lena image and calculate the histogram of the image. For experiment with the addition of some Poisson noise on the image, initially we calculate the histogram as shown in the Fig. 4(b). For enhancing the contrast of this noisy image, we equalized the histogram values by the use of conventional HE and it has been observed from Fig. 4(c) that the conventional HE algorithm causes excessive contrast stretching. In the “noisy Lena” image, noises become more visible, degrading the image quality severely.
For removing the overstretching of histogram values, we modified the histogram values by the log based histogram modification scheme as shown in Fig. 4(d). By the use of equation (5), we calculate total dissipated power on the LHM image before applying convex optimization theory as shown in table no. 1. For reducing the power as well as maintaining the contrast of noisy Lena image, we applied convex optimization theory and we obtained two results, one is enhanced image as shown in Fig. 4(e) and second is reduced power after applying convex optimization theory as shown in table no. 1.
B. Proposed Method results on Lena Image with Poisson noise:
Power consumption on noisy Lena image by IPCCE algorithm:
Table 2 TDP
Total power Before Optimization 6.8391e+03
Total power after optimization 4.1053e+03
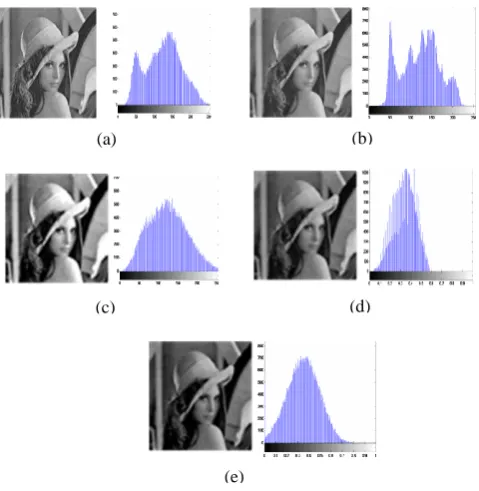
Now we evaluate the performance of the proposed Method on the same test image "Lena". In Fig. 5(a) we take same Lena image with Poisson noise as shown in Fig. 4(b). We removed the unwanted pixels (noise) by the use of Wiener filter and filtered image shown in Fig. 5(b). For enhancing the contrast of this filtered Lena image, we equalized the histogram values by the use of HE and we observe from Fig. 5(c) that the HE technique causes excessive contrast stretching. Remaining noises after filtering become less visible, enhancing the image quality severely. Then we follow the same procedure as given earlier, modified the histogram values by the log based histogram modification scheme as shown in Fig. 5(d) and calculate total dissipated power on the LHM image before applying convex optimization theory as shown in table no. 2. Then we applied convex optimization theory and obtained two results, one is enhanced image as shown in Fig. 4(e) and second
(a) (b)
(c)
(e)
(d)
Fig.5: (a) noisy image with additive Poisson noise, (b) filtered image by wiener filter, (c) HE image, (d) LHM
image, (e) image after optimization
(c) (d)
(e)
Fig.4: (a) original image, (b) noisy image with additive Poisson noise, (c) HE image, (d) LHM
image, (e) image after optimization
[image:4.595.55.290.190.460.2] [image:4.595.309.549.210.456.2]is reduced power after applying convex optimization theory as shown in table no. 2.
7.
PERFORMANCE EVALUATION
Power saving is an important issue in emissive display panels, while enhancing the contrast of an image for better visualization. PCCE algorithm successfully enhanced the contrast of an image and save power in emissive display panels. We calculate the total power, by the sum of each pixel intensity in an image. We insert some noise in any image and calculate power, and then we observe that power is increased, as compare to same noise free image. Any type of noise presents in the image is one of the major factors for increasing the power consumption. So we proposed a new method for emissive display which enhances contrast of an image as well as save the power of noisy image. In previous section, with the help of table 1 and 2 we evaluate the performance of PCCE algorithm and proposed method.
In this section, we are comparing total power consumption on noisy Lena image by the use of proposed method and PCCE algorithm for emissive displays. We have shown a graph in Fig. 6, this graph shows total power consumed by the image from emissive display panel before and after applying convex optimization theory in terms of intensity. Finally we found that proposed algorithm works efficiently on noisy image and it reduces the power consumption and improve the object clarity of a noisy image.
Fig.6: Power consumption by Lena image
8.
CONCLUSION
The existing technique implemented, the power constrained contrast enhancement of emissive display models, needs more power to be consumed for noisy gray-scale image. Hence we
want the efficient results for the noisy gray image on the Emissive displays, its power should be reduced, at the same time the contrast of the image should be enhanced with clarity of image objects and its brightness gets preserved. All these factors are achieved in our proposed method which gives better results than existing method as shown in the results.
Thus, we conclude that the proposed technique requires less power to display a noisy image as compared to the existing techniques with contrast enhancement and power saving simultaneously. One of the future issue is to generalize the power with limited image enhancement framework to accommodate more sophisticated contrast enhancement techniques.
9.
REFERENCES
[1] R. C. Gonzalez and R. E. Woods, “Digital Image Processing”, 3rd Ed. Upper Saddle River, NJ: Prentice-Hall, 2007.
[2] W. C. Cheng, Y. Hou, and M. Pedram, “Power minimization in a backlit TFT-LCD display by concurrent brightness and contrast scaling”, IEEE Consumer Electronics Society, vol. 50, issue 1, pp. 25–32, Feb. 2004.
[3] M. Dong, Y. S. K. Choi, and L. Zhong, “Power modeling of graphical user interfaces on OLED displays”, DEC’09 Proceedings of the 46th Annual Design Automation Conference, pp. 652–657, Jul. 2009.
[4] W. Den Boer, “Active Matrix Liquid Crystal Displays”. Amsterdam, the Netherlands: Newnes, Aug. 2005.
[5] Chulwoo Lee, Chul Lee, Young-Yoon Lee, Chang-Su Kim, “Power-Constrained Contrast Enhancement for Emissive Displays Based on Histogram Equalization”, IEEE Transaction On Image Processing, vol.21, no.1, Jan. 2012.
[6] Pawan Patidar , Sumit Srivastava , Ashok Kumar Nagawat , Manoj Gupta “Image De-noising by Various Filters for Different Noise”, International Journal of Computer Applications (IJCA), vol. 9, no.4, Nov. 2010.
[7] M. Kazubek “Wavelet domain image de-noising by thresholding and Wiener filtering”, IEEE on Signal Processing Letters, vol. 10, issue 11, pp. 324 - 326, Nov. 2003.
[8] M. Dong, Y. S. K. Choi, and L. Zhong, “Power modeling of graphical user interfaces on OLED displays”, Proceedings of the 46th Annual Design Automation Conference DAC '09, pp. 652–657, July 2009.
[9] C. Poynton, “A Technical Introduction to Digital Video”, Hoboken, NJ: Wiley, Jan. 1996.
[10]S. Boyd and L. Vandenberghe, “Convex Optimization”, Cambridge University Press U. K., 2004.