Using Predictive Analysis for Improved Project
Manager Assignment
Sanjay Kumar Prasad
IBM India Pvt. Ltd.Bangalore, India
Ravi Shankar
Indian Institute of Technology Delhi New Delhi, India
Sreejit Roy
IBM India Pvt. Ltd.Bangalore, India
ABSTRACT
It is commonly agreed that project management competence is a critical success factor for project based organizations. However, there is not sufficient research in literature to develop objective analytical methods to identify required project management skill level for a project. In practice, practitioners still need an effective methodology to determine competence level needed to manage a particular project —especially in larger companies where it is difficult for management to subjectively identify right project manager for new and ongoing projects. Even for the projects with assigned project manager, there is value in understanding if the assigned project manager has the right skill level for the project. In this paper, authors address problem of analytically identifying right project management skill level. Specifically, this paper demonstrates how supervised learning can be used to build models for predicting required project management skill level, thus enabling focused and individualized resource management. Further, these techniques are illustrated in the context of real-world project data from a large IT firm.
General Terms: Data Mining
Keywords:
Competence, Decision Making, Classification, Resource Management, Supervised Learning
1. INTRODUCTION
Service industries comprise the great majority of gross domestic product (GDP) of virtually all developed nations, and cover a very broad and diverse range of activities [1]. Further, Human Resource Management is one of the key pillars of success in any organization, and more so in a services organization.
Many IT Services firms follow project-based organization, where various units of work are carved out as distinct projects and contracted work is delivered through these projects. The question ”How to assign projects to project managers?” is considered to be one of the most important questions in this context [2]. However, due to multitude of factors impacting a project, it is not very straightforward to identify level of project management skill required. Further, impact of the factors differ in space and
time —two projects may not experience the same impact (based on presence of other variables), and impact on the same project may differ as we move in time. Traditionally, staffing process has been driven by manager intuition, and there is no standard process or methodology adopted to assign a project manager (PM) to a project. In this model, PM skills may not match with the project requirements, and the mismatch is discovered post-facto after much damage has been done to client satisfaction and profitability due to project failure.
With increasing competition and ever-demanding customers, organizations have to deliver right first time and there is little tolerance for any delivery failures. Key input to any organization performance, especially for one in services sector, is its human talent. Therefore, organizations need to get the human talent side of their equation right first time. Traditional approach of subjective decision making is neither scalable nor predictable in long run, especially for larger organizations with lot of decision makers. This paper endeavors to propose a data driven classification model to dynamically discover required project management skill to manage a project. This model can be used to:
a) Assign right project managers for new projects; and/or b) Understand potential areas of risk by proactively identifying
projects where assigned project manager has lower skill than required skill level to manage the project. This will enable organizations to proactively plan remedial actions like additional managerial oversight, additional education/coaching for current project manager or reassignment of project to another project manager.
2. LITERATURE REVIEW
Ellram et al. [3] have developed a popular Services Supply Chain Management (SSCM) framework and identified key service processes/functions as information flow, capacity and skills management, demand management, supplier relationship management, customer relationship management, service delivery management and cash flow. Baltacioglu et al. [4] proposed a service supply chain framework by identifying following key activities: demand management; capacity and resources management; customer relationship management; supplier relationship management; order process management; service performance management; and information and technology management.
in performance of two companies in similar environment had been widely attributed to the difference in their resources and capabilities. They defined resources as the tangible and intangible elements or factors that are available with the organization and can be exploited as per its capabilities. Further, they defined capabilities as intangible elements or factors, which enable the organization to utilize its resources to achieve the desired results.
Khalil and Shankar [6] observed that increasingly technology firms are organizing themselves around projects and teams, and they went on to endorse project-based organizations as an enabling organizational designs for better execution, faster learning and organizational flexibility.
Based on current literature, it can be easily inferred that right project manager staffing is key success factor for organization’s success. However, there is not much work in this area. Patankul et al.[2] performed an inductive study to develop a theoretical framework for project assignments, including some significant assignment criteria and processes. They found that to be effective in project assignments, management should consider strategic elements of the organization, project requirements and competencies of project managers in project manager-to-project matching, and some organizational/personal limitations regarding the assignment. An optimization model was developed to apply this framework and to assist in assigning projects to project managers for the better performance of projects, project managers, and the organization.
Sivaramet al.[7] studied resource skill level estimation problem during hiring process. They evaluated clustering and classification techniques and proposed a decision tree constructed with C4.5 algorithm to be used as decision rule in recruitment context. Patanakul et al. [8] studied project manager assignment when a project manager already leads multiple, concurrent projects, e.g., a multiple-project manager of new product development projects in typical high-tech industries. They proposed a theoretical framework for understanding project assignments. They observed that in effective project assignment, management assigns projects based on three factors —a) project’s contribution to the organization’s strategic elements such as organizational mission and goals; b) alignment between project requirements and the competencies of multiple project managers; and c) any organizational or personal limitations.
3. PROJECT MANAGEMENT SKILL
PREDICTION
There have been some recent efforts in creating a framework /classification approach [9]. Most of these frameworks are rubrics to identify required skill level based on some of the project variables viz. priority, risk level, technology, project size etc. However, these frameworks, while being useful, are still driven by subjective judgment. Therefore, they are somewhat simplistic and mostly static (do not change automatically with the changing business environment). In this business context, there is a need to create a framework to automatically define the required project management skill, and ensure that the changing business and technology environment is appropriately taken into consideration. We formulate project management skill prediction task as a supervised learning problem: given instances of past projects and their trouble history (incorporating only project management related troubles), build a model that can predict what should be the project manager skill level for a project with no trouble. Data instances correspond to variables representing projects, which are described in detail below:
3.1 Target Variable - PM Skill Level
Each project is classified into one of two classes: skill level 1 and skill level 2. These two classes are used in the project manager assignment, where each class corresponds to the required PM expertise level1.
3.2 Independent/Explanatory Variables
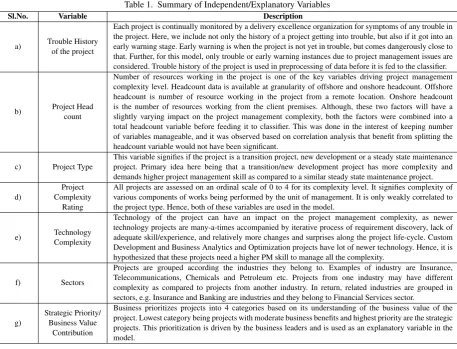
Independent/Explanatory variables /features are summarized in Table 1. These variables are used for predicting the required PM skill level needed for a trouble free project.
3.3 Data Preprocessing
As the first step of model training, data cleaning and data transformation steps are carried out to ensure that the model has the relevant data in the form best suited for good predictive performance:
a) To ensure that the classifier learns only from projects which have been in operation for a reasonable period of time, we include only those projects, which have been in operation for at least three months.
b) Some of the projects are very small and pure staff-augmentation work. There is not much project management required for these projects. These projects were classified as out of scope and removed from the analysis.
c) Project Management skills are classified into two groups. For the purpose of this analysis, these groups are coded as (1 and 2) on an ordinal scale.
d) For projects with past history of trouble, project management skill level is adjusted to be level 2 (unless it is already at level 2). e) Sectors are coded on a nominal scale, and sector code is used as
one of the independent variables for the classification model. f) Technology Complexity is on an ordinal scale of [0, 1]
—1 representing custom development projects and Business Analytics & Optimization project, and 0 represents rest of the projects.
g) Project Type signifies if the project is a transition project, new development or a steady state maintenance project. Project type information is converted to an ordinal scale [0, 1]. Steady state maintenance projects are represented by 0 and new development or transition projects are denoted by 1.
h) Strategic priority/business value contribution is coded from 1 to 4 on an ordinal scale.
4. APPROACH
The task formulated in this paper is a typical supervised classification problem: given a set of data instances (projects without any trouble) represented by a set of features and class labels(project manager skill), build a model that can classify a new instance into one of two target classes - skill level 1 and skill level 2. Further, it was decided to add troubled projects data with an adjustment to its class label as discussed in Section 3.3.
1It really helped that the organization, for which this prediction model was
Table 1. Summary of Independent/Explanatory Variables
Sl.No. Variable Description
a) Trouble History of the project
Each project is continually monitored by a delivery excellence organization for symptoms of any trouble in the project. Here, we include not only the history of a project getting into trouble, but also if it got into an early warning stage. Early warning is when the project is not yet in trouble, but comes dangerously close to that. Further, for this model, only trouble or early warning instances due to project management issues are considered. Trouble history of the project is used in preprocessing of data before it is fed to the classifier.
b) Project Head count
Number of resources working in the project is one of the key variables driving project management complexity level. Headcount data is available at granularity of offshore and onshore headcount. Offshore headcount is number of resource working in the project from a remote location. Onshore headcount is the number of resources working from the client premises. Although, these two factors will have a slightly varying impact on the project management complexity, both the factors were combined into a total headcount variable before feeding it to classifier. This was done in the interest of keeping number of variables manageable, and it was observed based on correlation analysis that benefit from splitting the headcount variable would not have been significant.
c) Project Type
This variable signifies if the project is a transition project, new development or a steady state maintenance project. Primary idea here being that a transition/new development project has more complexity and demands higher project management skill as compared to a similar steady state maintenance project.
d)
Project Complexity
Rating
All projects are assessed on an ordinal scale of 0 to 4 for its complexity level. It signifies complexity of various components of works being performed by the unit of management. It is only weakly correlated to the project type. Hence, both of these variables are used in the model.
e) Technology Complexity
Technology of the project can have an impact on the project management complexity, as newer technology projects are many-a-times accompanied by iterative process of requirement discovery, lack of adequate skill/experience, and relatively more changes and surprises along the project life-cycle. Custom Development and Business Analytics and Optimization projects have lot of newer technology. Hence, it is hypothesized that these projects need a higher PM skill to manage all the complexity.
f) Sectors
Projects are grouped according the industries they belong to. Examples of industry are Insurance, Telecommunications, Chemicals and Petroleum etc. Projects from one industry may have different complexity as compared to projects from another industry. In return, related industries are grouped in sectors, e.g. Insurance and Banking are industries and they belong to Financial Services sector.
g)
Strategic Priority/ Business Value
Contribution
Business prioritizes projects into 4 categories based on its understanding of the business value of the project. Lowest category being projects with moderate business benefits and highest priority are the strategic projects. This prioritization is driven by the business leaders and is used as an explanatory variable in the model.
In this section, different settings for the project management skill prediction .
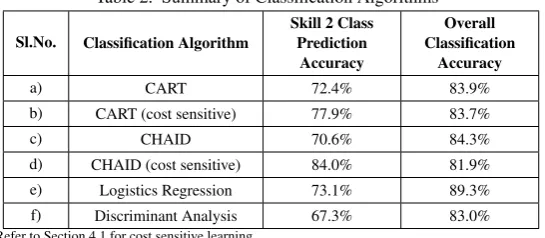
Following commonly used classification algorithms —CART decision tree induction [10, 11], CHAID decision tree induction [11] , Logistics Regression [12] and Discriminant Analysis [13] —for the domain are compared. In addition, misclassification cost is also introduced for the two decision tree induction algorithms. This section reports classification accuracy in predicting skill level 2 class and overall prediction. Table 2 summarizes our results on the comparison of different learning algorithms. Introduction of misclassification cost help the decision tree induction algorithms significantly outperform the competing methods. In addition to learning accurate classifiers, CHAID and CART are good choices for this domain, because they perform well at handling missing values, nominal values, and produce comprehensible models in the form of human-readable decision lists. Since CHAID produces better models than CART on both class 2 prediction accuracy and overall prediction accuracy criteria, it is used as the base algorithm for the remainder of this paper.
4.1 Cost-sensitive Learning
In project manager assignment, main reason for predicting required project management skill is to be able to reduce project risks and to customize monitoring activities in line with the gap between required and assigned PM skill for each project. While a PM skill classification model need to be overall accurate, primary concern is
to reduce project risk through right assignment and/or additional oversight, where project manager skill is not upto the required level. To achieve this objective, key focus is to build models that are focused on being able to predict accurately for skill 2 class. Default classification algorithms assume that all classes are equally important. However, the penalty for predicting a project will need lower PM skills, when in fact it will need higher skills , is usually higher than the reverse.
Authors use instance re-weighting[14] to handle different mis-classifications costs. A misclassification cost schema as shown in the Table 3 is provided as input. Each row and each column corresponds to target classes. Each cell corresponds to the cost of misclassifying the row class as the column class. The diagonal corresponds to correct classifications and hence are all zero. By default, all costs, other than the diagonal, are set to one. Instances belonging to particular class are re-weighted proportionally to the sum of its misclassification costs . These costs are used in node assignment and risk estimation, and also affect the tree-growing (through adjusted priors).
Table 2. Summary of Classification Algorithms
Sl.No. Classification Algorithm
Skill 2 Class Prediction
Accuracy
Overall Classification
Accuracy
a) CART 72.4% 83.9%
b) CART (cost sensitive) 77.9% 83.7%
c) CHAID 70.6% 84.3%
d) CHAID (cost sensitive) 84.0% 81.9%
e) Logistics Regression 73.1% 89.3%
f) Discriminant Analysis 67.3% 83.0% Refer to Section 4.1 for cost sensitive learning.
Table 3. Analysis of Various Misclassification Cost Schema
Standard Cost Schema 1 Cost Schema 2 Cost Schema 3
Predicted Class→ 1 2 1 2 1 2 1 2
Observed Class
1 0 1 0 1 0 1 0 1
2 1 0 2 0 5 0 10 0
Class 2 Accuracy 70.6% 84.0% 88.2% 92.8%
Overall Accuracy 84.3% 81.9% 79.5% 72.1%
since it results in classifier with high (>80%) prediction accuracy for both class 2 and overall.
5. CONCLUSION
In this paper, authors presented an automated analytics driven approach to estimate required project management skill based on data mining techniques. Analysis of troubled projects showed that projects with gap in project management skills are twice as likely to be in trouble that project with no PM skill level gap. In Section 4, it was demonstrated how one can effectively predict required project management skill level of a project in different settings. This will complement staffing decision process, and will improve organizational capability to staff right project manager for right project. Further, it will allow the organization to learn and derive insights from the results of its past staffing decisions, and will lead to better staffing recommendations over time. Moreover, it will help management to pro-actively identify projects with a gap in project management skill level and hence more prone to trouble.
Ability to staff right PM, pro-actively identify trouble-prone projects and undertake remediation steps enables organizations to mitigate project risks and improve success rate of projects. Further, a data-driven approach like the one outlined in this paper allows the skill management problem to be managed in a consistent manner based on fact and data-driven insights, and prevents pitfalls of subjective judgment. Most importantly, as the business environment changes, a data driven approach will learn of the changes and adjust the classifier accordingly. This will be especially valuable in larger organizations, where it is even more difficult for any manager to incorporate impact of all variables in PM staffing related decisions on her own.
6. FUTURE SCOPE
This work is primarily based in an environment, where there is a one-to-one mapping between project and project manager. It can be extended to an environment, where one project manager manages multiple projects. Then, the PM skill requirement will depend on the number of other projects (and their complexity) managed by
the project manager. On the other hand, we can also extend this model to incorporate skill level of the program manager (several projects report in a program). If we have a highly skilled program manager, project manager skill requirement can be relaxed.
7. REFERENCES
[1] Prasad, S.K., and Shankar, R., ”IT Services Supply Chain Coordination under risk and Revenue sharing”, Proceedings of XVIth International Conference on Supply Chain Management, Society of Operations Management, 2012.
[2] Patanakul, P., Milosevic, D.Z., and Anderson, T.R., ”A decision support model for project manager assignments”, IEEE Transactions on Engineering Management, Vol. 54, No.4, pp. 548-564, 2007.
[3] Ellram, L., Tate, W., and Billington, C., ”Understanding and Managing the services supply chain”, Journal of Supply Chain Management, Vol 40 , No. 4, pp. 17-32, 2004.
[4] Baltacioglu, T. , Ada, E. , Kaplan, M.D., Yurt, O. and Kaplan, Y.C. ”A new framework for service supply chains”, The Service Industries Journal, Vol. 27 No. 2, pp. 105-24, 2007. [5] Araya, S., Chaparo, J., Orero, A., and H. Joglar, ”An integrative
view of IS/IT and organizational resources and capabilities”, Issues in Informing Science and Information Technology, Vol. 4, pp. 629-639, 2007.
[6] Khalil, T., Shankar, R., and Barton, R.,”Management of Technology”, 2nd Indian Edition, Tata McGraw-Hill Education, 2012.
[7] Sivaram, N., and Ramar, K., ”Applicability of Clustering and Classification Algorithms for Recruitment Data Mining”, International Journal of Computer Applications (0975 - 8887), Vol. 4, No.5, pp.23-28, July 2010.
[9] Department of Information Resources. 2007, Project Classification Method, , State of Texas, US. [Online]. Available: http://www.dir.state.tx.us/ management/projectdelivery/practices/Pages/ ProjectClassificationMethod.aspx (accessed on 26th Apr 2013).
[10] Breiman, L., Friedman, J., Olshen, R., and Stone, C., ”Classification and Regression Trees”, Wadsworth International Group, 1984.
[11] Wilkinson, L. , ”Tree Structured Data Analysis: AID, CHAID and CART”, presented at the Sawtooth/SYSTAT Joint Software Conference, Sun Valley, ID, USA, 1992.
[12] Hastie, T., Tibshirani, R., and Friedman, J.,” The Elements of Statistical Learning”, Springer Verlag, New York, NY, 2001. [13] Gareth, J., Witten, D., Hastie, T., and Tibshirani, R.,”An
Introduction to Statistical Learning with Applications in R”, Springer Texts in Statistics No. 103, Springer, 2013.