A Cost Effective Cloud Datacenter Capacity Planning
Method Based on Modality Cost Analysis
Rabih Bashroush*
University of East London, England, UKE-mail: [email protected]
Moustafa Noureddine
Microsoft Corporation,Seattle, USA
Email: [email protected]
*Corresponding author
Abstract: In resource provisioning for datacenters, an important
Keywords: Cloud Performance, Capacity Planning, Datacenter Provisioning.
Bibliographical notes: Dr Rabih Bashroush is a Senior Lecturer
(Associate Prof) in Software Engineering at the School of Architecture, Computing and Engineering (ACE) at the University of East London (UEL) where he also leads the Software Architecture Research Group (SOAR). Before that, Dr. Bashroush was a Senior Engineer at the Institute of Electronics, Communications, and Information Technology and held a lectureship position at the Queens University of Belfast. He has over a decade experience in IT and software development. Rabih held a number of visiting scientist posts at a number of institutes including the Software Engineering Institute, SEI, Carnegie Mellon University, USA, and the Software Architecture Department, Philips Research Labs, Netherlands. He was also a visiting researcher at the Department of Information and Software Engineering, George Mason University, USA. Rabih has a PhD in Software Engineering from the Queens University Belfast; a BEng in Computer and Communications Engineering from the American University of Beirut; and a PGCert in Higher Education from the University of East London. He is a Fellow of the Higher Education Academy; Member of the IEEE since 1998; and elected committee member of the International Association of Software Architects, UK Chapter, since 2009.
Mr Moustafa Noureddine is a Senior Program Manager in Lync Server Group at Microsoft Corporation, Redmond, USA. Before Joining Microsoft in 2008, Moustafa worked at a number of blue-chip industries such as Mentor Graphics and Router Solutions Incorporated. Moustafa has an MBA from Pepperdine University, an MSc and a BSc in Computer Science from California State University, Fullerton.
1 Introduction and motivation
providers in the Cloud tend to over provision mainly due to the lack of capacity planning tools that guide such optimization of performance and cost, and SLA violations are costly for Cloud hosted applications. A quantitative measurement of the resource cost (CPU, memory, storage, and network bandwidth) imposed by each of the modalities of the product, in isolation, may allow organizations to make informed decisions with respect to the right level of resource provisioning. The objective of this paper is to illustrate a tested methodology to guide resource provisioning decisions. In this paper, we first present a systematic methodology to estimate the performance expected from each modality based on the representation of resource cost per modality. Subsequently, we discuss how the estimate of the expected application performance could guide resource provisioning decisions. We illustrate the methodology using a commercially available media application, the Microsoft Lync Server 2010. Then we validate the performance estimation and resource provisioning methodology using a validation software tool to simulate a realistic workload against a production datacenter with all the modalities working together. The layout of the paper is as follows: Section 2 provides an overview of media applications performance. Section 3 provides an overview of the Modality Cost Analysis, our capacity planning methodology. Sections 4 and 5 present the results of our performance analysis and our validation tool. Section 6 discusses hardware benchmarks, and Sections 7 and 8 summarize the related research and offer concluding remarks and directions for future research.
2 Media applications performance
important from a user’s perspective. On the other hand, metrics such as throughput, latency, and resource usage are important from a provider’s perspective since they can guide the capacity planning and affect total cost and SLA guarantees. In this paper, we consider the performance from a provider’s perspective since our focus is on capacity planning. Other research has considered the end user perceived performance with a focus on ecommerce applications [2], and provider’s perceived performance with the a focus on ecommerce applications [1].
3 Modality cost analysis (MCA)
Modality Cost Analysis is a methodology for assessing resource cost for each of the modalities of an application. In this methodology, the application is broken into a set of modalities and each is measured for resource cost (CPU, Network bandwidth, Storage, and Memory) in isolation. The first rationale behind using isolated cost analysis rather than the aggregated cost of the application in its entirety is that the workload for different modalities varies dramatically, and aggregation may not capture these variations. The second rational is that Cloud providers may need to allocate resources based on their customers’ user-profile. For example when hosting communication software on the Cloud, one customer may be a heavy instant messaging user, another may be a heavy video chat user, and a third one may be a very heavy voice customer such as a call center. Instant messaging is CPU intensive while video and voice calls are network bandwidth intensive. Using this methodology, the service provider will be able to allocate resources appropriately and accurately for these different user profiles according to what they are going to be using.
When using modality cost analysis, resource cost is calculated separately, namely, the CPU cost, the Network cost, and the memory cost, and any other cost that might be relevant to the provider such as storage in scenarios where the application storage requirements are significant.
In order to simplify our methodology, we consider N tenants with their distribution denoted by T1, T2. … Tn. We consider m modalities, and r
∑
( )
where N is the modality cost of resources r.
For our experiments, for example, the CPU cost for instant messaging modality using Office Lync Server 2010 [12] was found to be:
( )
where x is the number of concurrent users being provisioned.
The CPU cost for application sharing was found to be:
( )
where x is the number of concurrent provisioned user.
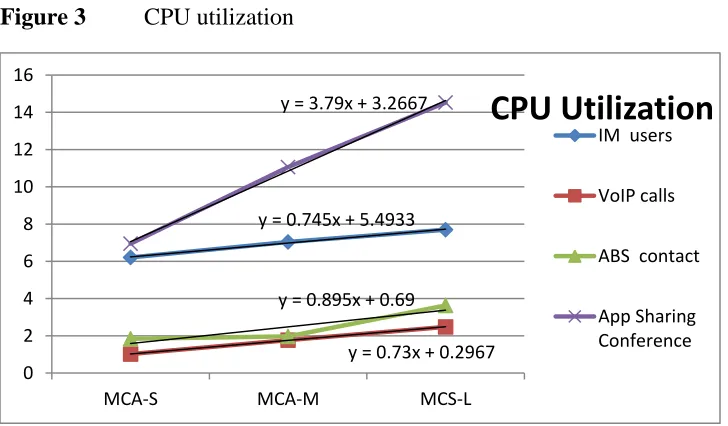
These equations were deduced by capturing CPU utilization while varying number of users (see Fig. 3 below for CPU trend lines and section 4 for further information). Therefore, a provider wanting to calculate the CPU cost with these two modalities can obtain it simply by summing the resource cost of each modality being provisioned, that is by simply adding Eq. (2) and Eq. (3) above:
(5.4933 + 0.74x) + (3.2667 + 3.79x) (4)
4 Experiments and results
scenario is named S for small load, the second one is named MCA-M for medium load, and the third one named MCA-MCA-L for large load.
We illustrate the performance estimation based on the following hardware: A server with dual processors quad-core 2.0 GHz (2,000 megacycles per second), 16 gigabytes of memory, 30GB disk space, and 2-port 1 gigabit per second network adapter. The hardware topology remains fixed during our experimentation.
We use Office Lync Server 2010 (OLS)[12] which is an enterprise real-time communications server, providing the infrastructure for enterprise instant messaging, data collaboration conferencing and multiparty Voice and Video calling. These features are enabled within an organization, between organizations, and with external users on the public internet. This product is also provided as a Cloud offering as part of Office 365.
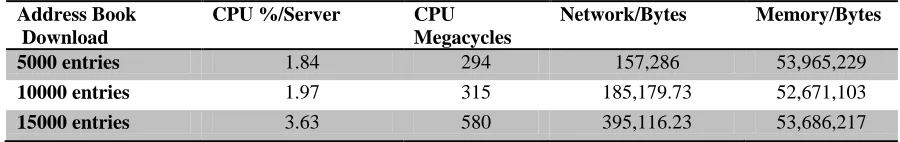
We ran OLS on the above described hardware server. In the first experiment, we simulated users using instant messaging modality only (in isolation where no other modality is running). In experiment 2, we simulated users making VoIP calls with no other modality running. In experiment 3, we simulated users joining a conference call and sharing a power point presentation. In experiment 4, we simulated users downloading an address book.
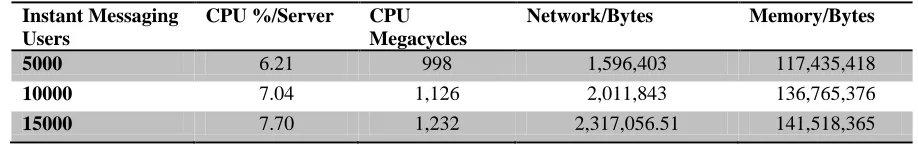
[image:6.594.66.525.624.696.2]For the first experiment, we simulated 5000 users sending IM messages to each other at the same time. We measured the CPU utilization over a period of 4 hours and obtained the average CPU utilization of the server. We also calculated the CPU utilization using megacycles. We obtained the megacycles by multiplying our experiment server megacycles (2,000) by the number of cores (8) or a total of 16,000 megacycles per server. For example, if a modality is utilizing 10% of server processors resources, we calculate that it is consuming 1,600 megacycles. In addition, we captured network bandwidth and memory utilization. Then, we increased the load and simulated 10,000 simultaneous users, and finally we simulated 15,000 simultaneous IM users. Table 1 below shows the result of our data collection.
Table 1 First Experiment Results
Instant Messaging Users
CPU %/Server CPU Megacycles
Network/Bytes Memory/Bytes
5000 6.21 998 1,596,403 117,435,418
10000 7.04 1,126 2,011,843 136,765,376
Table 2 Second Experiment Results
VoIP Users CPU %/Server CPU Megacycles
Network/Bytes Memory/Bytes
200 1.02 163 104,508 268,334,836
400 1.7 272 216,545 269,283,186
600 2.48 396 320,444.62 281,681,544
Table 3 Third Experiment Results
Application Sharing Conference
CPU %/Server CPU Megacycles
Network/Bytes Memory/Bytes
100 users 6.95 1,112 7,164,641 517,244,781
200 users 11.06 1,769 9,990,548.47 793,322,894
[image:7.594.71.521.399.470.2]250 users 14.53 2,324 13,589,203.86 991,254,808.25
Table 4 Fourth Experiment Results
Address Book Download
CPU %/Server CPU Megacycles
Network/Bytes Memory/Bytes
5000 entries 1.84 294 157,286 53,965,229
10000 entries 1.97 315 185,179.73 52,671,103
15000 entries 3.63 580 395,116.23 53,686,217
In the second experiment, we simulated 200, 400, and 600 users making VoIP calls simultaneously. Table 2 above shows the resource cost for each run.
In the third experiment, we simulated a conference call with application sharing and 100, 200, and 250 users connecting simultaneously. Table 3 above shows the resource cost for each run.
In the fourth experiment, we simulated 1000 simultaneous users downloading an address book with 5000, 10000, and 15000 contacts, respectively. Table 4 above shows the resource cost for each run.
needs without having to overprovision. Providers that want to utilize this methodology and apply it to a different hardware profile can benchmark the processor used in this experiment against existing or planned hardware. Section 6 discusses this method in more details.
5 Validation methodology
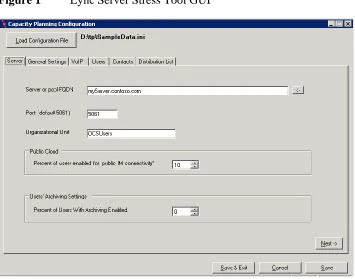
In the second set of experiments, we mixed the four modalities together to validate that measuring resources in isolation is an acceptable methodology for datacenter provisioning. In order to prove this hypothesis, we ran three experiments mixing IM, VoIP, Address Book download, and Application Sharing conference, using a tool called Office Lync Server Stress (LSS). LSS generates a simulated load on Office Lync Server. For example, when we set up IM users, the tool will send instant messages between different simulated users based on the load that we specify (in this case, 5000 users sending instant messages (at a rate of 4 instant messages per user per hour). This user profile remains constant across all the experiments.
[image:8.594.119.474.425.704.2]Fig. 1 shows a snapshot of the Lync Server Stress tool.
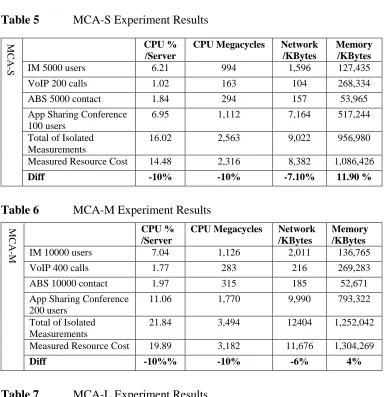
The first experiment, named MCA-S, simulates a user using all the four modalities in smaller quantities. To do this, we set up the same hardware that we used to run the modalities in isolation and then we used Lync Server Stress tool and simulated the server with 5000 Instant Messaging users sending messages to each other where each user is sending 4 IMs/hour (the same load as when we ran the modality in isolation). Then we loaded 200 VoIP calls, 1000 users downloading 5000 contact simultaneously, and 100 users sharing a power point presentation (5 MB size).
Table 5 below summarizes what we found.
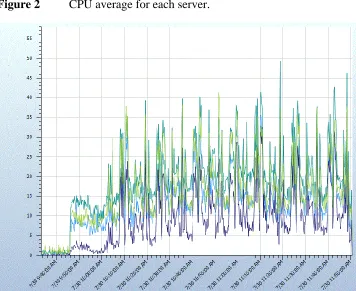
In order to calculate the average, we ran the experiment on 4 servers independently. The chart presented in Fig. 2 below shows the CPU average for each of the servers.
[image:9.594.120.476.410.701.2]As shown in Fig. 2, the averages for the four CPUs are 19.13%, 13.81%, 9.16%, and 15.82% or an aggregate average of 14.48%. Also it is important to note that we ran the experiment for 2 hours and collected the data every ten minutes as shown in Fig. 2.
Table 5 MCA-S Experiment Results M CA -S CPU % /Server
CPU Megacycles Network /KBytes
Memory /KBytes
IM 5000 users 6.21 994 1,596 127,435
VoIP 200 calls 1.02 163 104 268,334
ABS 5000 contact 1.84 294 157 53,965
App Sharing Conference 100 users
6.95 1,112 7,164 517,244
Total of Isolated Measurements
16.02 2,563 9,022 956,980
Measured Resource Cost 14.48 2,316 8,382 1,086,426
Diff -10% -10% -7.10% 11.90 %
Table 6 MCA-M Experiment Results
M
CA
-M
CPU % /Server
CPU Megacycles Network /KBytes
Memory /KBytes
IM 10000 users 7.04 1,126 2,011 136,765
VoIP 400 calls 1.77 283 216 269,283
ABS 10000 contact 1.97 315 185 52,671
App Sharing Conference 200 users
11.06 1,770 9,990 793,322
Total of Isolated Measurements
21.84 3,494 12404 1,252,042
Measured Resource Cost 19.89 3,182 11,676 1,304,269
Diff -10%% -10% -6% 4%
Table 7 MCA-L Experiment Results
M
CA
-L
CPU % /Server
CPU Megacycles Network /Kbytes
Memory /KBytes
IM 15000 users 7.70 1,232 2,317 141,518
VoIP 600 calls 2.48 454 320 281,681
ABS 15000 contact 3.63 580 395 53,686
App Sharing Conference 250 users
14.53 2,324 13,589 991,254
Total of Isolated Measurements
28.34 4,534 16,621 1,468,140 Measured Resource Cost 33.98 5,436 16,953 1,492,496
The second experiment, named MCA-M, simulates a user using all the four modalities in medium quantities. Table 6 above summarizes what we found.
The third experiment, named MCA-L, simulates a user using all the four modalities in large quantities. The outcome of that is summarized in Table 7 above.
The results show that measuring modalities in isolation and using the results to provision datacenter is an effective methodology. The variance between measuring in isolation and measuring the modalities running side by side is within ±16%. In order to better plan for such variance, we recommend adding an adequate buffer for covering variation in side-by-side versus aggregated execution. 10% to 30% buffer is conside-by-sidered a minor buffer compared to current hardware overprovisioning estimates of 200-300% in best cases, and 5% to 10% of server resource utilizations in some of the worse cases [6].
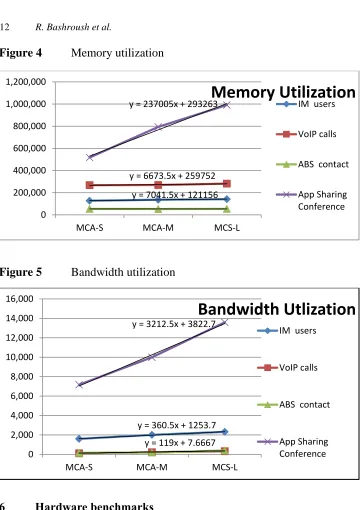
[image:11.594.117.481.461.674.2]The following figures, Fig. 3-5, summarize the results of the three experiments. By adding trend lines to the chart lines, we can see that the modalities grow linearly. Using the equations discussed in section 3 above, we can predict the utilization at any point. We expect each modality to hit a ceiling level which is not captured in these experiments.
Figure 3 CPU utilization
y = 0.745x + 5.4933
y = 0.73x + 0.2967 y = 0.895x + 0.69
y = 3.79x + 3.2667
0 2 4 6 8 10 12 14 16
MCA-S MCA-M MCS-L
CPU Utilization
IM users
VoIP calls
ABS contact
Figure 4 Memory utilization
Figure 5 Bandwidth utilization
6 Hardware benchmarks
Rapid change in hardware and the multitude of different hardware configurations available nowadays make it difficult for any provider wanting to adopt performance optimization or capacity planning methodologies. For example, a provider validating against existing hardware may find that the hardware is not available during procurement time. In order to ensure that our methodology is not hardware specific,
y = 7041.5x + 121156 y = 6673.5x + 259752 y = 237005x + 293263
0 200,000 400,000 600,000 800,000 1,000,000 1,200,000
MCA-S MCA-M MCS-L
Memory Utilization
IM users
VoIP calls
ABS contact
App Sharing Conference
y = 360.5x + 1253.7
y = 119x + 7.6667 y = 3212.5x + 3822.7
0 2,000 4,000 6,000 8,000 10,000 12,000 14,000 16,000
MCA-S MCA-M MCS-L
Bandwidth Utlization
IM users
VoIP calls
ABS contact
benchmarking techniques can be used to adapt the methodology and equations identified in this work to different hardware settings. For example, processor benchmarking tools such as SPECint [16] can be used. The SPECint processor benchmark for the hardware used in our methodology is 186 for eight cores or 23.25 per core. So, providers interested in using this performance validation methodology against a different hardware can use the following steps:
1. Visit the SPECint website [16] 2. Select SPECint2006 Rates
3. Find the server and processor they have deployed or intend to deploy, and look at the number in the Result column.
4. Dividing this value by the number of cores in the server returns the per-core value. For example, if the Result number is 240 on an eight-core server, the per-eight-core value is 30.
5. The following equation can then be used to determine the per-core megacycles for the server: (Per-core value) x 2,000/ 23.25
6. Finally, by multiplying the result above by the number of cores in the server, the total number of megacycles per server is obtained. This is then compared to the 16,000 megacycles for the baseline server used to produce the numbers in our experiments.
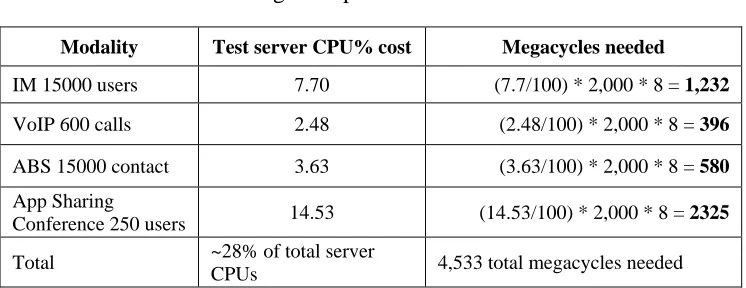
[image:13.594.117.490.518.662.2]In order to clarify this further, consider the following example. Assume a provider to provision the following modalities as summarized in Table 8 below.
Table 8 Benchmarking example modalities
Modality Test server CPU% cost Megacycles needed
IM 15000 users 7.70 (7.7/100) * 2,000 * 8 = 1,232
VoIP 600 calls 2.48 (2.48/100) * 2,000 * 8 = 396
ABS 15000 contact 3.63 (3.63/100) * 2,000 * 8 = 580
App Sharing
Conference 250 users 14.53 (14.53/100) * 2,000 * 8 = 2325 Total ~28% of total server
calculations explained in the previous sections, we can compute the megacycles of the servers, which would be 16,000 megacycles each in this case.
To determine the number of such servers required to provision the above modalities, the number of needed megacycles (4,533) can be divided by the number of megacycles per server (16,000 in this example). This can easily be replaced by the number of megacycles represented by the hardware being utilized.
Thus, in this example, we need circa 28% of total server CPU resources to run the modalities in the table above.
7 Related research
Datacenter provisioning and performance optimization has been an active research area for the past several years. Most of the research that we reviewed addresses dynamic provisioning [7-10] and virtualization [11]. Other research addressed resource provisioning in ecommerce applications [1],[2]. Our research focuses on static provisioning in datacenters where the provider understands the user model and performance expectations but lacks the tools to provision according to exact needs. The key factor that distinguishes our work form related efforts is that they consider all the application components in an aggregated manner while our research proposes and validates a methodology to measure each modality in isolation. Also, our research simulates the methodology in commercial media application in use today and is used to guide performance and capacity planning for Office Lync Server 2010. A published capacity planning calculator based on the methodology described in this work can now be downloaded from the Microsoft website [17].
8 Conclusion & future work
modalities in isolation and using the results to provision datacenters is an effective methodology. We also discussed a process for applying hardware benchmarks for scenarios where experimental hardware servers differ from deployment hardware or for upgrading hardware servers without invalidating experimental results. As one of the future research directions, we intend to address virtualization using modality cost analysis methodology and address any effects or limitations. This work can extensively benefit from virtualization to dynamically allocate resources based on usage profiles. In order to achieve this, we plan to look at Windows Azure as a virtualization platform where we can deploy MCA and provision dynamically in order to reduce the total cost of ownership while maintaining SLAs.
References
[1] Jijun Lu and Swapna S. Gokhale. “Resource Provisioning in an E-commerce
Application”, IEEE Joint Conference on E-Commerce Technology (CEC'08) and Enterprise Computing, E-Commerce and E-Services (EEE'08).
[2] S. S. Gokhale and J. Lu., “Performance and availability analysis of
e-commerce sites”, In Proc. 30th Annual Intl Computer Software and Applications Conference (COMPSAC’06), pages 495–502, 2006
[3] Ye Hu, Johnny Wong, Gabriel Iszlai and Marin Litoiu, “Resource
Provisioning for Cloud Computing,” Proceedings of CASCON 2009, November 2009.
[4] Alexander Lenk, Markus Klems, Jens Nimis, Stefan Tai, and Thomas
Sandholm. What’s inside the cloud? An architectural map of the cloud landscape. In Proc. of the ICSE Workshop on Software Engineering Challenges of Cloud Computing, pages 23–31, 2009.
[5] Alexandra Fedorova , Margo Seltzer , Michael D. Smith, Improving
Performance Isolation on Chip Multiprocessors via an Operating System Scheduler, Proceedings of the 16th International Conference on Parallel Architecture and Compilation Techniques, p.25-38, September 15-19, 2007
[6] Utilization and Datacenter productivity:
http://www.ca.com/files/technologybriefs/dca-manager-tech-brief-us.pdf
[7] Bradley Simmons, Angela McCloskey, Hanan Lutfiyya, Dynamic
Provisioning of Resources in Data Centers, Department of Computer Science, Proceedings of the third international conference on Autonomic and Autonomous Systems, 2007. ICAS07, June 2007.
[8] Peter Bodík, Rean Griffith, Charles Sutton, Armando Fox, Michael I.
Control for Datacenter and Clouds, (ACDC09), Barcelona, Spain, June 2009.
[9] Vladimir Stantchev, Performance Evaluation of Cloud Computing
Offerings, Proceedings of the 2009 Third International Conference on Advanced Engineering Computing and Applications in Sciences, pages 187-192.
[10] Truong Vinh Truong Duy; Sato, Y.; Inoguchi, Y.; Performance Evaluation
of a Green Scheduling Algorithm, for Energy Savings in Cloud Computing, Parallel & Distributed Processing Workshops and Phd Forum (IPDPSW), 2010 IEEE International Symposium, April 2010, pages 19-23
[11] Chris Matthews, Yvonne Coady, Virtualized recomposition: Cloudy or
Clear?, Software Engineering Challenges of Cloud Computing, 2009. CLOUD '09. ICSE Workshop, May 2009, pages 38-43.
[12] Microsoft. Microsoft Office Communications Server 2007 R2. URL:
http://www.microsoft.com/communicationsserver
[13] J. Allspaw. The Art of Capacity Planning: Scaling Web Resources. O’Reilly
Media, Inc., 2008.
[14] Microsoft. Capacity Planning Tool for Office Communications Server 2007 R2. URL:
http://www.microsoft.com/downloads/details.aspx?FamilyID=f8cbddd6-7608-4bbe-9246-16e96c62bef4&displaylang=en
[15] Armbrust M et al, “Above the Clouds: A Berkeley View of Cloud
Computing”, UC Berkeley Reliable Adaptive Distributed Systems Laboratory Technical Report, February 2009.
[16] SPECint Processor Benchmarking tool. URL: http://www.spec.org
[17] An Online Capacity Planning Tool based on the work discussed in this