0095-1137/11/$12.00
doi:10.1128/JCM.00182-11
Copyright © 2011, American Society for Microbiology. All Rights Reserved.
Phoenix 100 versus Vitek 2 in the Identification of Gram-Positive and
Gram-Negative Bacteria: a Comprehensive Meta-Analysis
䌤
†
Kalliopi-Stavroula Chatzigeorgiou,
1Theodoros N. Sergentanis,
2Sotirios Tsiodras,
3Stavros J. Hamodrakas,
1and Pantelis G. Bagos
4*
Department of Cell Biology and Biophysics, Faculty of Biology, University of Athens, Athens, Greece
1;
Department of Hygiene, Epidemiology, and Medical Statistics, Medical School, University of Athens,
Athens, Greece
2; Fourth Academic Department of Internal Medicine and Infectious Diseases,
University Hospital Attikon, Medical School, University of Athens, Athens, Greece
3; and
Department of Computer Science and Biomedical Informatics,
University of Central Greece, Lamia, Greece
4Received 28 January 2011/Returned for modification 9 March 2011/Accepted 29 June 2011
Phoenix 100 and Vitek 2 (operating with the current colorimetric cards) are commonly used in hospital
laboratories for rapid identification of microorganisms. The present meta-analysis aims to evaluate and
compare their performance on Gram-positive and Gram-negative bacteria. The MEDLINE database was
searched up to October 2010 for the retrieval of relevant articles. Pooled correct identification rates were
derived from random-effects models, using the arcsine transformation. Separate analyses were conducted at
the genus and species levels; subanalyses and meta-regression were undertaken to reveal meaningful
system-and study-related modifiers. A total of 29 (6,635 isolates) system-and 19 (4,363 isolates) articles were eligible for
Phoenix and colorimetric Vitek 2, respectively. No significant differences were observed between Phoenix and
Vitek 2 either at the genus (97.70% versus 97.59%,
P
ⴝ
0.919) or the species (92.51% versus 88.77%,
P
ⴝ
0.149)
level. Studies conducted with conventional comparator methods tended to report significantly better results
compared to those using molecular reference techniques. Speciation of
Staphylococcus aureus
was significantly
more accurate in comparison to coagulase-negative staphylococci by both Phoenix (99.78% versus 88.42%,
P
<
0.00001) and Vitek 2 (98.22% versus 91.89%,
P
ⴝ
0.043). Vitek 2 also reached higher correct identification rates
for Gram-negative fermenters versus nonfermenters at the genus (99.60% versus 95.90%,
P
ⴝ
0.004) and
the species (97.42% versus 84.85%,
P
ⴝ
0.003) level. In conclusion, the accuracy of both systems seems
modified by underlying sample- and comparator method-related parameters. Future simultaneous
assess-ment of the instruassess-ments against molecular comparator procedures may facilitate interpretation of the
current observations.
Early provision of microorganism identification and
suscep-tibility data permits efficient management of patients with
in-fectious diseases and is associated with significant clinical and
financial benefits, via the reduction of mortality rates and
over-all hospitalization costs (17). In view of this assumption,
iden-tification and antimicrobial susceptibility testing (AST) of
clin-ical isolates is mainly achieved by means of fully automated
systems in most medium- to high-throughput microbiology
lab-oratories. Apart from shortened turnaround times, improved
specimen handling, enhanced quality control, reproducibility,
accuracy, and the ability to track results are further advantages
prompting routine laboratories to adopt automated
technol-ogies for bacterial processing (18). Since the release of the
AutoMicrobic System, designed in the late 1960s by McDonnell
Douglas at the request of NASA, a plethora of products have
made their appearances in this extremely demanding
market-place. Two of the major competitors in the field are the
Phoe-nix 100, launched by Becton Dickinson in 2003, and the Vitek
2 system, introduced by bioMe
´rieux in 1997.
With regard to identification, Phoenix utilizes a series of
mod-ified conventional, fluorogenic and chromogenic, substrates to
cover a total of 145 Gram-positive and 161 Gram-negative taxa
within 3 to 4 h (4). Vitek 2, combined with the original
(Gram-positive) ID-GPC and (Gram-negative) ID-GNB identification
cards, using fluorescence reading technology, required up to
3 h to identify 52 Gram-positive and 98 Gram-negative taxa;
with the redesigned (Gram-positive) ID-GP and
(Gram-nega-tive) ID-GN formats, based on colorimetric detection, the
sys-tem covers a broadened database of 115 Gram-positive and
135 Gram-negative taxa in an approximate turnaround time of
10 h (6).
Speciation of an isolate provides essential information on its
pathogenic potential and is of utmost importance for the
cor-rect interpretation of AST results; therefore, the identification
performance of both Phoenix and Vitek 2 has already
under-gone numerous evaluations by laboratories having them
inte-grated in the routine diagnostic workflow. The design of
indi-vidual studies, with regard to the system being assessed, the
identification procedure used as the comparator method, and
the composition of the strain battery under investigation may
account for the heterogeneous conclusions inferred by various
researchers. A comprehensive quantitative synthesis of all
pub-* Corresponding author. Mailing address: University of Central
Greece, 2-4 Papasiopoulou Street, Lamia 35100, Greece. Phone: 302
2310-66914. Fax: 302 2310-66915. E-mail: [email protected].
† Supplemental material for this article may be found at http://jcm
.asm.org/.
䌤
Published ahead of print on 13 July 2011.
3284
on May 16, 2020 by guest
http://jcm.asm.org/
lished articles is necessary to shed light on the controversies of
the literature. This meta-analysis aims to estimate and
com-pare the accuracy of Phoenix and Vitek 2 for the identification
of Gram-positive and Gram-negative species.
MATERIALS AND METHODS
Search strategy.The present meta-analysis was performed in accordance
with the PRISMA guidelines (42). A systematic computerized search of MEDLINE bibliographical database was performed to identify relevant stud-ies (end-of-search date: 30 October 2010), using the search string “[Phoenix OR Vitek] AND identification”. Language restrictions were not applied, while the references of eligible articles were also checked. Two investigators (K.-S.C. and T.N.S.) working independently searched the literature and ex-tracted data from eligible studies. Disagreements were resolved by discussion and consensus.
Eligible studies and data abstraction.Articles evaluating Phoenix, Vitek 2, or
both systems concomitantly for their ability to identify Gram-positive and/or Gram-negative bacteria were considered eligible for the meta-analysis; the use of a comparator method had to be clearly stated by the authors.
The following exclusion criteria were adopted during selection of eligible trials and data abstraction.
(i) The present meta-analysis focused on common aerobic and facultative anaerobic pathogens, to which Phoenix panels for Gram-positive, Gram-nega-tive, and streptococcal taxa and Vitek 2 cards for Gram-positive (fluorescent ID-GPC and colorimetric ID-GP) and Gram-negative (fluorescent ID-GNB and colorimetric ID-GN) taxa are dedicated. Studies assessing the performance of
NH (forNeisseriaandHaemophilusspecies), ANC (for anaerobes and
coryne-bacteria), ID-YST, and YST (for yeasts) cards were excluded.
(ii) Both Phoenix and Vitek 2 are designed for inoculation with pure colonies grown on appropriate solid media. Studies performing direct inoculation of the systems with positive blood cultures were excluded from the analysis.
(iii) Only results of clinical isolates were of concern. Therefore, strains of environmental, veterinary, or unspecified origin were also excluded.
(iv) Strains representing species not included in the database of the system under evaluation were not considered for the calculations.
(v) Reference or type strains were also excluded from the calculations, to circumvent their inevitable overlapping and repetition among relevant studies.
(vi) Enough evidence has already accumulated in the literature regarding the suboptimal performance of Vitek 2 fluorescent cards to accurately identify
bac-teria; since 2004, bioMe´rieux exclusively markets the new colorimetric formats
designed to improve the accuracy and broaden the database of the previous fluorescent versions. In this context, studies evaluating Vitek 2 fluorescent iden-tification cards for Gram-positive (ID-GPC) and Gram-negative (ID-GNB) bac-teria were also excluded; nevertheless, a grand-total analysis on all studies (using either fluorescent or colorimetric cards) is secondarily presented in the supple-mental material to ensure the comprehensiveness of the meta-analytical ap-proach.
Data abstraction was conducted for the total number of isolates,
Gram-positive, and Gram-negative strains under investigation;Staphylococcus
au-reusstrains, coagulase-negative staphylococci (CoNS), enterococci, streptococci,
Gram-negative glucose fermenters, and nonfermenters were also considered separately. In addition, the following data were abstracted: first author name, publication year, type of comparator method, type of identification card (fluo-rescent or colorimetric) for Vitek 2, the genera and species under investigation,
and the proportions of Gram-positive, Gram-negative,S. aureusisolates, CoNS,
enterococci, streptococci, fermenters, and nonfermenters included in individual studies.
Definitions.The Phoenix system leads to an identification result when a
spe-cies or group of spespe-cies is identified with a⬎90% confidence level. For Vitek 2,
the confidence value is expressed by seven different categories of results: excel-lent, very good, good, acceptable identification (only one result is provided), low discrimination (more than one result is given, whereupon the software suggests additional tests), inconclusive identification, and unidentified.
Therefore, each identification result obtained by Phoenix and/or Vitek 2 in comparison to the reference method was classified as follows. (i) The first classification was “correct identification” at the species and/or genus level. For Phoenix, correct identification was defined as any result concordant with the reference method at the species and/or genus level; accordingly for Vitek 2 any excellent/very good/good/acceptable identification concordant with the reference method was referred to as correct identification at the species and/or genus level. A low discrimination result between species of the correct genus (including or
not the correct species) was considered correct identification at the genus level. (ii) The second classification was “misidentification.” For either system, misiden-tification was defined as any result discordant with the reference method at the genus and species level. (iii) The third classification was “no identification.” This category was allocated when either system was unable to provide any identifica-tion or yielded an “inconclusive” (in the case of Vitek 2) result. The “misiden-tification” and “no iden“misiden-tification” categories were merged for the purposes of this meta-analysis to establish a binary “correct/not correct” conceptual frame-work.
For low discrimination results suggesting the correct species among viable choices, an alternative (species level) analysis was undertaken, counting these results as correct identifications at the genus and species level. Of note, the resolution of multiple-choice identifications required the performance of sup-plemental tests, implying a significant delay in the definitive speciation of the respective isolates.
Of note, from a biostatistical point of view, correct identification rates should be interpreted as sensitivity rates, since they conceptually correspond to the number of true positives divided by the sum of true-positive and false-negative results.
Statistical analysis.For both Phoenix and Vitek 2, separate analyses were
performed regarding their identification performance at the genus and species levels.
Based on the appropriate numbers in each study, the correct identification rates at the genus and species levels (isolates with correct identification/total number of isolates) were calculated; importantly, given that in numerous studies these rates were very close or equal to unity the arcsine (Freeman-Tukey), transformation was implemented (25) and preferred over logistic regression (53). This transformation results in a roughly normally distributed variable (54, 63) and exhibits satisfactory properties in terms of variance stabilization, the latter representing a problem during the meta-analysis of rates (53).
The arcsine-transformed rates were subsequently pooled through random-effects models (16). Pooled correct identification rates were derived after back-transformation of the pooled arcsine-transformed summary estimates. Apart from the overall meta-analysis, subanalyses were undertaken in Gram-positive
(total,S. aureus, CoNS,Enterococcusspp., andStreptococcusspp.) and
Gram-negative (total, fermenters, and nonfermenters) bacteria. The appropriate z-tests were performed to estimate the level of statistical significance regarding (i) the difference in the respective correct identification rates between Phoenix and Vitek 2, as well as (ii) within-system differences (molecular versus conventional
comparator methods, Gram-positive versus Gram-negative isolates,S. aureus
versus CoNS strains and Gram-negative fermenters versus nonfermenters). Z-tests are univariate Z-tests, which were performed given that arcsine-transformed rates are normally distributed (3, 54, 63). Each z-value was appropriately calcu-lated as the difference in pooled arcsine-transformed rates divided by the stan-dard error of the difference. The level of statistical significance for z-tests was set
atP⬍0.05. Of note, a subanalysis on studies directly comparing Phoenix and
Vitek 2 on the same isolates was performed in order to minimize any con-founding.
To circumvent the effect of within-system multiple comparisons, as well as possible confounding at the numerous subanalyses, a multiple (multivariate) meta-regression adjustment algorithm (29) was performed for the items selected
as significant at the univariate analysis (thePvalue for entry was fixed at⬍0.05)
for both Phoenix and Vitek 2.
Meta-regression was performed to evaluate whether correct (arcsine-trans-formed) identification rates were modified by the proportion of Gram-positive,
Gram-negative,S. aureus, CoNS,Enterococcusspp.,Streptococcusspp.,
Gram-negative fermenters, and nonfermenters included in each study; the increment was set at increase by 1% in the proportion of each pathogen.
Between-study heterogeneity was quantified using theI2
measure (32). Pub-lication bias was evaluated by using the rank correlation method of Begg (5), the Egger’s regression method (20), and its random-effects analogue (61); for the
interpretation of publication bias, statistical significance was defined asP⬍0.1.
Statistical analyses were conducted with STATA 11.1 Intercooled (STATA Corp., College Station, TX). Forest plots were generated by StatsDirect statis-tical software Version 2.7.2 (StatsDirect, Ltd., Altrincham, Cheshire, United Kingdom).
RESULTS
Eligible studies.
Of the 624 abstracts retrieved through the
search criteria, 527 articles were excluded from the
meta-anal-ysis as irrelevant; these articles included studies assessing the
on May 16, 2020 by guest
http://jcm.asm.org/
AST performance of Phoenix or Vitek 2, reports evaluating the
AutoMicrobic or the first-generation Vitek system, other types
of publications employing Phoenix or any of the Vitek versions
for the processing of clinical isolates outside the context of an
evaluation (e.g., case reports, surveillance studies, etc.) and
nonmicrobiological papers. Among relevant articles, 19 studies
were excluded given that they reported on the accuracy of
Vitek 2 NH, ANC, ID-YST, and YST cards, nine studies were
excluded because inoculation of Phoenix or Vitek 2 was
per-formed directly from positive blood cultures, one study (using
the colorimetric Vitek 2 ID-GN card) was excluded since it was
carried out exclusively on environmental strains, four studies
(one using the colorimetric ID-GP and three using the
fluo-rescent ID-GPC Vitek 2 cards) were excluded due to reporting
reasons (clinical isolates were tested together with reference
and/or animal strains, while identification results for the
for-mer were not provided separately), two studies were excluded
because the type of Vitek 2 card was not specified, and 18
studies were excluded since they assessed exclusively the
iden-tification performance of Vitek 2 fluorescent ID-GPC and
ID-GNB cards. As a result, a total of 44 publications were
included in the meta-analysis: 29 (8–11, 13, 14, 18, 19, 21–24,
28, 31, 33, 35, 36, 39–41, 43–46, 48, 50, 56, 59, 60) reported on
the identification performance of Phoenix, and 19 (1, 2, 15, 19,
26, 27, 30, 34, 37, 38, 40, 41, 46, 47, 49, 51, 55, 62, 64) reported
on the identification performance of Vitek 2 operating with the
colorimetric ID-GP and ID-GN cards; among them four (19,
40, 41, 46) were direct-comparison studies (see Fig. S1 in the
supplemental material for the trial flow chart and Table S1 in
the supplemental material for the characteristics of eligible
studies).
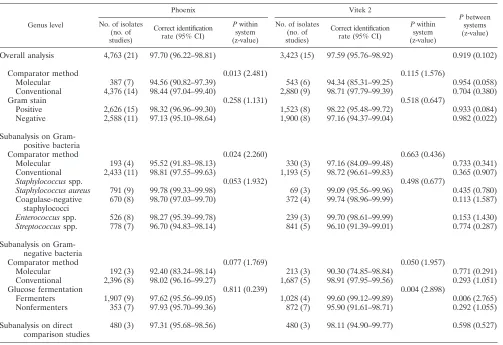
Comparison between Phoenix and Vitek 2.
Table 1, Table 2,
and Fig. 1 depict the results of the meta-analysis at the genus
and species levels (see Table S2 in the supplemental material
for the results of the alternative analysis).
Regarding the overall analyses, no significant differences
were observed between Phoenix and Vitek 2 either at the
genus (97.70% versus 97.59%,
P
⫽
0.919) or the species
(92.51% versus 88.77%,
P
⫽
0.149) level. The lack of
differ-ence persisted at the overall subanalyses on studies conducted
with conventional (
P
⫽
0.704 for genus and
P
⫽
0.645 for
species) or molecular reference methods (
P
⫽
0.954 and
P
⫽
0.770, respectively), as well as on Gram-positive (
P
⫽
0.933 and
P
⫽
0.253, respectively) and Gram-negative (
P
⫽
0.982 and
P
⫽
0.317, respectively) bacteria.
[image:3.585.43.546.79.424.2]Accordingly, the subanalyses on
S. aureus
, CoNS,
Enterococ-cus
spp,
Streptococcus
spp., and Gram-negative nonfermenters
did not reveal any significant finding at both genus and species
TABLE 1. Results of the meta-analysis at the genus level
aGenus level
Phoenix Vitek 2
Pbetween
systems (z-value) No. of isolates
(no. of studies)
Correct identification rate (95% CI)
Pwithin
system (z-value)
No. of isolates (no. of studies)
Correct identification rate (95% CI)
Pwithin
system (z-value)
Overall analysis
4,763 (21)
97.70 (96.22–98.81)
3,423 (15)
97.59 (95.76–98.92)
0.919 (0.102)
Comparator method
0.013 (2.481)
0.115 (1.576)
Molecular
387 (7)
94.56 (90.82–97.39)
543 (6)
94.34 (85.31–99.25)
0.954 (0.058)
Conventional
4,376 (14)
98.44 (97.04–99.40)
2,880 (9)
98.71 (97.79–99.39)
0.704 (0.380)
Gram stain
0.258 (1.131)
0.518 (0.647)
Positive
2,626 (15)
98.32 (96.96–99.30)
1,523 (8)
98.22 (95.48–99.72)
0.933 (0.084)
Negative
2,588 (11)
97.13 (95.10–98.64)
1,900 (8)
97.16 (94.37–99.04)
0.982 (0.022)
Subanalysis on
Gram-positive bacteria
Comparator method
0.024 (2.260)
0.663 (0.436)
Molecular
193 (4)
95.52 (91.83–98.13)
330 (3)
97.16 (84.09–99.48)
0.733 (0.341)
Conventional
2,433 (11)
98.81 (97.55–99.63)
1,193 (5)
98.72 (96.61–99.83)
0.365 (0.907)
Staphylococcus
spp.
0.053 (1.932)
0.498 (0.677)
Staphylococcus aureus
791 (9)
99.78 (99.33–99.98)
69 (3)
99.09 (95.56–99.96)
0.435 (0.780)
Coagulase-negative
staphylococci
670 (8)
98.70 (97.03–99.70)
372 (4)
99.74 (98.96–99.99)
0.113 (1.587)
Enterococcus
spp.
526 (8)
98.27 (95.39–99.78)
239 (3)
99.70 (98.61–99.99)
0.153 (1.430)
Streptococcus
spp.
778 (7)
96.70 (94.83–98.14)
841 (5)
96.10 (91.39–99.01)
0.774 (0.287)
Subanalysis on
Gram-negative bacteria
Comparator method
0.077 (1.769)
0.050 (1.957)
Molecular
192 (3)
92.40 (83.24–98.14)
213 (3)
90.30 (74.85–98.84)
0.771 (0.291)
Conventional
2,396 (8)
98.02 (96.16–99.27)
1,687 (5)
98.91 (97.95–99.56)
0.293 (1.051)
Glucose fermentation
0.811 (0.239)
0.004 (2.898)
Fermenters
1,907 (9)
97.62 (95.56–99.05)
1,028 (4)
99.60 (99.12–99.89)
0.006 (2.765)
Nonfermenters
353 (7)
97.93 (95.70–99.36)
872 (7)
95.90 (91.61–98.71)
0.292 (1.055)
Subanalysis on direct
comparison studies
480 (3)
97.31 (95.68–98.56)
480 (3)
98.11 (94.90–99.77)
0.598 (0.527)
aCI, confidence interval.
on May 16, 2020 by guest
http://jcm.asm.org/
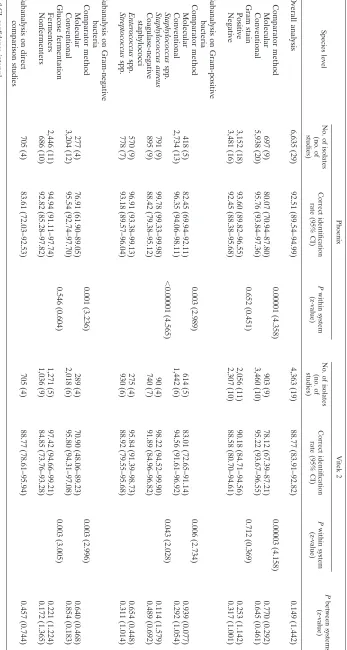
TABLE
2.
Results
of
the
meta-analysis
at
the
species
level
a Species level Phoenix Vitek 2 P between systems (z-value) No. of isolates (no. of studies) Correct identification rate (95% CI) P within system (z-value) No. of isolates (no. of studies) Correct identification rate (95% CI) P within system (z-value)Overall
analysis
6,635
(29)
92.51
(89.54–94.99)
4,363
(19)
88.77
(83.91–92.82)
0.149
(1.442)
Comparator
method
0.00001
(4.358)
0.00003
(4.158)
Molecular
697
(9)
80.07
(70.94–87.80)
903
(9)
78.12
(67.39–87.21)
0.770
(0.292)
Conventional
5,938
(20)
95.76
(93.84–97.36)
3,460
(10)
95.22
(93.67–96.55)
0.645
(0.461)
Gram
stain
0.652
(0.451)
0.712
(0.369)
Positive
3,152
(18)
93.60
(89.82–96.55)
2,056
(11)
90.18
(84.71–94.56)
0.253
(1.142)
Negative
3,481
(16)
92.45
(88.38–95.68)
2,307
(10)
88.58
(80.70–94.61)
0.317
(1.001)
Subanalysis
on
Gram-positive
bacteria
Comparator
method
0.003
(2.989)
0.006
(2.734)
Molecular
418
(5)
82.45
(69.94–92.11)
614
(5)
83.01
(72.65–91.14)
0.939
(0.077)
Conventional
2,734
(13)
96.35
(94.06–98.11)
1,442
(6)
94.56
(91.61–96.92)
0.292
(1.054)
Staphylococcus
spp.
⬍
0.00001
(4.565)
0.043
(2.028)
Staphylococcus
aureus
791
(9)
99.78
(99.33–99.98)
90
(4)
98.22
(94.52–99.90)
0.114
(1.579)
Coagulase-negative
staphylococci
895
(9)
88.42
(79.38–95.12)
740
(7)
91.89
(84.96–96.82)
0.489
(0.692)
Enterococcus
spp.
570
(9)
96.91
(93.38–99.13)
275
(4)
95.84
(91.39–98.73)
0.654
(0.448)
Streptococcus
spp.
778
(7)
93.18
(89.57–96.04)
930
(6)
88.92
(79.55–95.68)
0.311
(1.014)
Subanalysis
on
Gram-negative
bacteria
Comparator
method
0.001
(3.236)
0.003
(2.996)
Molecular
277
(4)
76.91
(61.90–89.05)
289
(4)
70.90
(48.06–89.23)
0.640
(0.468)
Conventional
3,204
(12)
95.54
(92.74–97.70)
2,018
(6)
95.80
(94.31–97.08)
0.854
(0.183)
Glucose
fermentation
0.546
(0.604)
0.003
(3.005)
Fermenters
2,446
(11)
94.94
(91.11–97.74)
1,271
(5)
97.42
(94.66–99.21)
0.221
(1.224)
Nonfermenters
686
(10)
92.82
(85.28–97.82)
1,036
(9)
84.85
(73.76–93.28)
0.172
(1.365)
Subanalysis
on
direct
comparison
studies
705
(4)
83.61
(72.03–92.53)
705
(4)
88.77
(78.61–95.94)
0.457
(0.744)
a CI, confidence interval.on May 16, 2020 by guest
http://jcm.asm.org/
[image:4.585.117.464.74.724.2]FIG. 1. Results of the meta-analysis for Phoenix and Vitek 2 at the genus (a and c, respectively) and species (b and d, respectively) levels. Each
study is shown by a point estimate of the effect size (correct identification rate) and its 95% confidence intervals derived from the arcsine
(Freeman-Tukey) transformation algorithm. The diamond represents the summary random-effects estimate from the meta-analysis.
on May 16, 2020 by guest
http://jcm.asm.org/
levels. The superiority of Vitek 2 over Phoenix in the
identifi-cation of Gram-negative fermenters was demonstrated at the
genus level (97.62% versus 99.60%,
P
⫽
0.006), albeit not
replicated at the species level.
The subanalysis on studies directly comparing the systems
did not demonstrate any significant difference (97.31% versus
98.11%,
P
⫽
0.598 for genus and 83.61% versus 88.77%,
P
⫽
0.457 for species identification).
Within-systems analyses.
With respect to Phoenix, correct
identification rates were higher in conventional compared to
molecular-based studies, as a rule. No significant difference
was observed between Gram-positive and Gram-negative
bac-teria at both genus and species levels. Species identification of
S. aureus
was significantly more accurate in comparison to
CoNS (99.78% versus 88.42%,
P
⬍
0.00001), with a borderline
significance obtained at the genus level (
P
⫽
0.053).
Regarding Vitek 2, studies conducted with conventional
comparator methods yielded significantly better results than
those using molecular techniques at the overall species analysis
(
P
⫽
0.00003), as well as at the subanalyses on Gram-positive
(
P
⫽
0.006) and Gram-negative (
P
⫽
0.003) bacteria; at the
genus level, this finding was confined to the latter (
P
⫽
0.050).
No significant difference was observed between Gram-positive
and Gram-negative bacteria regarding genus and species
tification. Vitek 2 was significantly more accurate in the
iden-tification of
S. aureus
versus CoNS at the species level (98.22%
versus 91.89%,
P
⫽
0.043), as well as in the identification of
fermenters versus nonfermenters at both genus (99.60% versus
95.90%,
P
⫽
0.004) and species (97.42% versus 84.85%,
P
⫽
0.003) levels.
Multiple meta-regression analysis, where applicable,
con-firmed the univariate associations on all occasions except for
one (see Table S3 in the supplemental material). Specifically,
the superior performance of Vitek 2 for species level
identifi-cation of
S. aureus
did not persist at the multiple
meta-regres-sion approach (
P
⫽
0.524 for
S. aureus
and
P
⫽
0.023 for the
comparator method). Importantly, it should be stressed that
only one study on
S. aureus
had used a molecular comparator
method (15); the accumulation of further studies using
molec-ular reference procedures for
S. aureus
speciation seems
man-datory, so as to elucidate the independence of the effects
me-diated by the comparator method and staphylococcal species
per se
.
Assessment of sample-related modifiers and publication bias.
Regarding Phoenix (see Fig. S2 in the supplemental material),
meta-regression revealed that correct identification rates
cor-related positively with the proportion of
S. aureus
isolates in
individual studies at the genus (
b
⫽ ⫹
0.004,
P
⫽
0.024) and
species (
b
[regression coefficient]
⫽ ⫹
0.0069,
P
⫽
0.012) levels.
Furthermore, the accuracy of the system at the species level
correlated marginally negatively with the proportion of CoNS
(
b
⫽ ⫺
0.0039,
P
⫽
0.053). No modifying effects were observed
regarding the proportions of Gram-positive, Gram-negative
bacteria, enterococci, streptococci, fermenters, and
nonfer-menters.
Concerning Vitek 2, meta-regression did not reveal any
sig-nificant effects mediated by the potential modifiers.
Significant publication bias emerged on numerous occasions
(see Tables S4 and S5 in the supplemental material). Close
inspection of Phoenix and Vitek 2 Begg’s plots (genus and
species level overall analyses) revealed that the missing,
hypo-thetically existing, studies were located in the upper right
quad-rant of the funnel plots in all cases, i.e., underestimation of
performance tended to emerge in smaller studies (see Fig. S3
and S4 in the supplemental material).
DISCUSSION
The present meta-analysis highlights the comparability in
the identification performance of Phoenix and Vitek 2 at both
genus and species levels. Subanalyses on Gram-positive and
Gram-negative bacteria, as well as on studies using
conven-tional or molecular comparator methods reproduced the lack
of significant differences between the instruments. The analysis
conducted exclusively on direct comparison studies, as well as
the alternative analysis for Vitek 2 (counting low
discrimina-tion results as correct species identificadiscrimina-tions) lent further
sup-port to the above observations, yielding no significant
differ-ences between Phoenix and Vitek 2.
Within-system analyses revealed that accuracy rates of both
instruments ranged widely depending on the type of method
adopted for reference identification; studies conducted with
conventional reference methods tended to report significantly
better results compared to those using molecular comparator
techniques, as a rule. Molecular evaluations of Phoenix and
Vitek 2 may be considered of higher quality than conventional
investigations. The majority of the latter reports, published to
date, have not used tedious and time-consuming reference
identification schemes; instead, the instruments were compared
to other phenotypic systems, most often the API galleries and
molecular confirmation was not undertaken in case of
concor-dant results. Theoretically, some of these “correctly identified”
strains might actually have been misidentified by both the
reference phenotypic system and the system under evaluation
(41), calling into question the accuracy of the results furnished
by such evaluations.
Apart from comparator method-related parameters, the
present meta-analysis uncovered meaningful sample-related
modifiers of the systems’ performance. Species identification
of
S. aureus
was significantly more accurate in comparison to
CoNS by both Phoenix and Vitek 2, this difference being well
explained by the variable phenotypic expression of the
coagu-lase negative species, as well as by their slow metabolic rates,
leading to ambiguous reactions within the short incubation
times used by automated instruments (31, 58). Furthermore,
Vitek 2 reached higher correct identification rates for
Gram-negative fermenters versus nonfermenters at both genus and
species levels, with the phenotypic variation, atypical
biochem-ical characteristics and slow growth rates of the latter most
probably accounting for this difference (7). Interestingly, the
results of the meta-regression confirmed the findings derived
from within-system analysis for Phoenix, whose accuracy
cor-related positively with
S. aureus
and negatively with CoNS
relative frequency. The smaller number of studies on Vitek 2
may have precluded the reproduction of within-system findings
by meta-regression, the latter yielding null associations.
An important measure of the value of a highly standardized
commercial system is the capability of the manufacturer to
maintain or even improve its performance over time. In this
context, bioMe
´rieux has converted fluorescent biochemicals
on May 16, 2020 by guest
http://jcm.asm.org/
and optics to colorimetric biochemicals and optics to broaden
the database and boost the accuracy of the system, particularly
for streptococci and Gram-negative nonfermenters (62). The
same meta-analytical approach encompassing all published
studies on Vitek 2 (see Tables S6 and S7 in the supplemental
material) corroborated the superiority of the current
colori-metric over the previous fluorescent identification cards.
Finally, several meaningful limitations of the present
meta-analysis, which nevertheless seem quite inherent in the current
literature, should be acknowledged. First, conference
proceed-ings were not included to ensure detailed reporting of data.
Moreover, the findings of the meta-analysis may have been
distorted, at a certain extent, due to the existence of significant
publication bias, which seems fairly common in the context of
meta-analyses on diagnostic accuracy (57). Nevertheless, visual
inspection of the relevant funnel plots revealed that the pattern
of asymmetry was essentially the same for both Phoenix and
Vitek 2, possibly affecting the results at the same direction for
each system and thus not substantially interfering with
poten-tial underlying differences.
At present, the application of more elaborate, bivariate
meta-analysis models was not feasible (52), as the number of
direct comparison studies was less than five (i.e., only four).
Forty of forty-four eligible articles evaluated separately
Phoe-nix or Vitek 2 in various laboratories, by different researchers,
on a wide range of bacterial species, recovered from variable
patient populations and clinical conditions; the synthesis of
such reports implied the existence of underlying confounding
and sizeable heterogeneity. In an attempt to overcome this
drawback, a subanalysis on the four direct comparison studies
was undertaken, although the generalization of the relevant
findings was precluded by the fact that these publications
fo-cused on particular genera, namely,
Staphylococcus
spp. (19,
41),
Streptococcus
spp. (46), and
Aeromonas
spp. (40).
According to the
Manual of Clinical Microbiology
,
auto-mated identification systems should ideally achieve an accuracy
rate of no less than 90% in comparison to reference methods
(12). Evidently, the present meta-analysis points to the
poten-tial for further improvement in the performance of both
Phoe-nix and Vitek 2. When interpreting individual studies, the
scientific audience should be aware of the underlying
mean-ingful system-, sample-, and comparator method-related
pa-rameters affecting the reported results. Future studies to
eval-uate the instruments should preferably use molecular methods
for reference identification, directly compare both systems
wherever feasible, and provide data for the less common
spe-cies, whose separate synthesis was not possible in this
meta-analysis.
REFERENCES
1.Abele-Horn, M., L. Hommers, R. Trabold, and M. Frosch.2006. Validation
of Vitek 2 version 4.01 software for detection, identification, and
classifica-tion of glycopeptide-resistant enterococci. J. Clin. Microbiol.44:71–76.
2.Abele-Horn, M., K. Stoy, M. Frosch, and R. R. Reinert.2006. Comparative
evaluation of a new Vitek 2 system for identification and antimicrobial
susceptibility testing ofStreptococcus pneumoniae. Eur. J. Clin. Microbiol.
Infect. Dis.25:55–57.
3.Altman, D. G., and J. M. Bland.2003. Interaction revisited: the difference
between two estimates. BMJ326:219.
4.Becton Dickinson. 2005. BD Phoenix system user’s manual, document
L003342(M). Becton Dickinson and Company, Sparks, MD.
5.Begg, C. B., and M. Mazumdar.1994. Operating characteristics of a rank
correlation test for publication bias. Biometrics50:1088–1101.
6.bioMe´rieux.2006. Vitek 2 product information, document 510769-4EN1.
bioMe´rieux, Inc., Durham, NC.
7.Bosshard, P. P., et al.2006. 16S rRNA gene sequencing versus the API 20
NE system and the Vitek 2 ID-GNB card for identification of nonfermenting
Gram-negative bacteria in the clinical laboratory. J. Clin. Microbiol. 44:
1359–1366.
8.Brigante, G., et al.2006. Use of the Phoenix automated system for
identifi-cation ofStreptococcusandEnterococcusspp. J. Clin. Microbiol.44:3263–
3267.
9.Brisse, S., et al.2002. Comparative evaluation of the BD Phoenix and Vitek
2 automated instruments for identification of isolates of theBurkholderia
cepaciacomplex. J. Clin. Microbiol.40:1743–1748.
10.Carroll, K. C., et al.2006. Evaluation of the BD Phoenix automated
micro-biology system for identification and antimicrobial susceptibility testing of
staphylococci and enterococci. J. Clin. Microbiol.44:2072–2077.
11.Carroll, K. C., et al.2006. Evaluation of the BD Phoenix automated
micro-biology system for identification and antimicrobial susceptibility testing of Enterobacteriaceae. J. Clin. Microbiol.44:3506–3509.
12.Carroll, K. C., and M. P. Weinstein.2007. Manual and automated systems
for detection and identification of microorganisms, p. 192–217. InP. R.
Murray (ed.), Manual of clinical microbiology, 9th ed., vol. 1. ASM Press, Washington, DC.
13.Cirkovic, I., et al.2008. Identification and antimicrobial susceptibility testing
ofStaphylococcus vitulinusby the BD Phoenix automated microbiology
sys-tem. Curr. Microbiol.57:158–160.
14.Colodner, R., et al.2004. Identification of the emerging pathogenVibrio
vulnificusbiotype 3 by commercially available phenotypic methods. J. Clin.
Microbiol.42:4137–4140.
15.Delmas, J., et al.2008. Evaluation of the Vitek 2 system with a variety of
Staphylococcusspecies. J. Clin. Microbiol.46:311–313.
16.DerSimonian, R., and N. Laird.1986. Meta-analysis in clinical trials. Control
Clin. Trials7:177–188.
17.Doern, G. V., R. Vautour, M. Gaudet, and B. Levy.1994. Clinical impact of
rapid in vitro susceptibility testing and bacterial identification. J. Clin.
Mi-crobiol.32:1757–1762.
18.Donay, J. L., et al.2004. Evaluation of the automated phoenix system for
potential routine use in the clinical microbiology laboratory. J. Clin.
Micro-biol.42:1542–1546.
19.Dupont, C., et al.2010. Identification of clinical coagulase-negative
staphy-lococci, isolated in microbiology laboratories, by matrix-assisted laser de-sorption/ionization-time of flight mass spectrometry and two automated
sys-tems. Clin. Microbiol. Infect.16:998–1004.
20.Egger, M., G. Davey Smith, M. Schneider, and C. Minder.1997. Bias in
meta-analysis detected by a simple, graphical test. BMJ315:629–634.
21.Eigner, U., A. Schmid, U. Wild, D. Bertsch, and A. M. Fahr.2005. Analysis
of the comparative workflow and performance characteristics of the Vitek 2
and Phoenix systems. J. Clin. Microbiol.43:3829–3834.
22.Endimiani, A., et al.2002. Identification and antimicrobial susceptibility
testing of clinical isolates of nonfermenting gram-negative bacteria by the
Phoenix automated microbiology system. New Microbiol.25:323–329.
23.Fahr, A. M., et al.2003. Two-center collaborative evaluation of the
perfor-mance of the BD Phoenix automated microbiology system for identification
and antimicrobial susceptibility testing ofEnterococcusspp. and
Staphylo-coccusspp. J. Clin. Microbiol.41:1135–1142.
24.Fontana, C., M. Favaro, M. Pelliccioni, E. S. Pistoia, and C. Favalli.2005.
Use of the MicroSeq 500 16S rRNA gene-based sequencing for identification of bacterial isolates that commercial automated systems failed to identify
correctly. J. Clin. Microbiol.43:615–619.
25.Freeman, M., and J. Tukey.1950. Transformations related to the angular
and the square root. Ann. Math. Statist.21:607–611.
26.Funke, G., and P. Funke-Kissling.2004. Evaluation of the new Vitek 2 card
for identification of clinically relevant gram-negative rods. J. Clin. Microbiol. 42:4067–4071.
27.Funke, G., and P. Funke-Kissling.2005. Performance of the new Vitek 2 GP
card for identification of medically relevant gram-positive cocci in a routine
clinical laboratory. J. Clin. Microbiol.43:84–88.
28.Funke, G., and P. Funke-Kissling.2004. Use of the BD Phoenix automated
microbiology system for direct identification and susceptibility testing of gram-negative rods from positive blood cultures in a three-phase trial.
J. Clin. Microbiol.42:1466–1470.
29.Greco, S., M. Rulli, E. Girardi, C. Piersimoni, and C. Saltini.2009.
Diag-nostic accuracy of in-house PCR for pulmonary tuberculosis in
smear-posi-tive patients: meta-analysis and meta-regression. J. Clin. Microbiol.47:569–
576.
30.Haanpera, M., J. Jalava, P. Huovinen, O. Meurman, and K.
Rantakokko-Jalava.2007. Identification of alpha-hemolytic streptococci by
pyrosequenc-ing the 16S rRNA gene and by use of Vitek 2. J. Clin. Microbiol.45:762–770.
31.Heikens, E., A. Fleer, A. Paauw, A. Florijn, and A. C. Fluit.2005.
Compar-ison of genotypic and phenotypic methods for species-level identification of
clinical isolates of coagulase-negative staphylococci. J. Clin. Microbiol.43:
2286–2290.
on May 16, 2020 by guest
http://jcm.asm.org/
32.Higgins, J. P., S. G. Thompson, J. J. Deeks, and D. G. Altman.2003.
Measuring inconsistency in meta-analyses. BMJ327:557–560.
33.Hirakata, Y., et al.2005. Evaluation of the BD Phoenix automated
micro-biology system SMIC/ID panel for identification and antimicrobial
suscep-tibility testing ofStreptococcusspp. Diagn. Microbiol. Infect. Dis.53:169–
173.
34.Hsieh, W. S., L. L. Sung, K. C. Tsai, and H. T. Ho.2009. Evaluation of the
Vitek 2 cards for identification and antimicrobial susceptibility testing of
non-glucose-fermenting Gram-negative bacilli. APMIS117:241–247.
35.Ishii, Y., et al.2006. Identification of biochemically atypicalStaphylococcus
aureusclinical isolates with three automated identification systems. J. Med.
Microbiol.55:387–392.
36.Kanemitsu, K., et al.2005. Evaluation of the BD Phoenix SMIC/ID, a new
streptococci identification and antimicrobial susceptibility panel, for poten-tial routine use in a university-based clinical microbiology laboratory. Diagn.
Microbiol. Infect. Dis.53:101–105.
37.Kim, M., et al.2008. Comparison of the MicroScan, Vitek 2, and Crystal GP
with 16S rRNA sequencing and MicroSeq 500 v2.0 analysis for
coagulase-negative staphylococci. BMC Microbiol.8:233.
38.Kiratisin, P., P. Santanirand, N. Chantratita, and S. Kaewdaeng.2007.
Accuracy of commercial systems for identification of Burkholderia
pseu-domalleiversusBurkholderia cepacia. Diagn. Microbiol. Infect. Dis.59:277– 281.
39.Kulah, C., et al.2009. Detecting imipenem resistance inAcinetobacter
bau-manniiby automated systems (BD Phoenix, Microscan WalkAway, Vitek 2):
high error rates with Microscan WalkAway. BMC Infect. Dis.9:30.
40.Lamy, B., et al.2010. Accuracy of 6 commercial systems for identifying
clinicalAeromonasisolates. Diagn. Microbiol. Infect. Dis.67:9–14.
41.Layer, F., B. Ghebremedhin, K. A. Moder, W. Konig, and B. Konig.2006.
Comparative study using various methods for identification of
Staphylococ-cusspecies in clinical specimens. J. Clin. Microbiol.44:2824–2830.
42.Liberati, A., et al.2009. The PRISMA statement for reporting systematic
reviews and meta-analyses of studies that evaluate health care interventions:
explanation and elaboration. J. Clin. Epidemiol.62:e1–e34.
43.Liu, Z. K., T. K. Ling, and A. F. Cheng.2005. Evaluation of the BD Phoenix
automated microbiology system for identification and antimicrobial
suscep-tibility testing of common clinical isolates. Med. Principles Pract.14:250–254.
44.Marco, F., A. Jurado, and M. T. Jimenez de Anta.2004. Evaluation of the
Phoenix system for identifying and determining the susceptibility of clinical isolates: comparative study with the Microscan system. Rev. Esp. Quimioter. 17:169–176. (In Spanish.)
45.Menozzi, M. G., et al.2006. Two-center collaborative evaluation of
perfor-mance of the BD Phoenix automated microbiology system for identification and antimicrobial susceptibility testing of gram-negative bacteria. J. Clin.
Microbiol.44:4085–4094.
46.Mittman, S. A., R. C. Huard, P. Della-Latta, and S. Whittier.2010.
Com-parison of the automated Phoenix with the Vitek 2 for the identification of Streptococcus pneumoniae. Can. J. Microbiol.56:326–332.
47.Nakasone, I., T. Kinjo, N. Yamane, K. Kisanuki, and C. M. Shiohira.2007.
Laboratory-based evaluation of the colorimetric Vitek-2 compact system for species identification and of the advanced expert system for detection of antimicrobial resistances: Vitek-2 compact system identification and
antimi-crobial susceptibility testing. Diagn. Microbiol. Infect. Dis.58:191–198.
48.O’Hara, C. M.2006. Evaluation of the Phoenix 100 ID/AST system and NID
panel for identification ofEnterobacteriaceae,Vibrionaceae, and commonly
isolated nonenteric gram-negative bacilli. J. Clin. Microbiol.44:928–933.
49.Otto-Karg, I., et al.2009. Validation of Vitek 2 nonfermenting
gram-nega-tive cards and Vitek 2 version 4.02 software for identification and antimi-crobial susceptibility testing of nonfermenting gram-negative rods from
pa-tients with cystic fibrosis. J. Clin. Microbiol.47:3283–3288.
50.Pendle, S., et al.2008. Difficulties in detection and identification of
Entero-coccus faeciumwith low-level inducible resistance to vancomycin, during a
hospital outbreak. Clin. Microbiol. Infect.14:853–857.
51.Renaud, F. N., et al.2005. Evaluation of the new Vitek 2 GN card for the
identification of gram-negative bacilli frequently encountered in clinical
lab-oratories. Eur. J. Clin. Microbiol. Infect. Dis.24:671–676.
52.Riley, R. D., J. R. Thompson, and K. R. Abrams.2008. An alternative model
for bivariate random-effects meta-analysis when the within-study
correla-tions are unknown. Biostatistics9:172–186.
53.Rucker, G., G. Schwarzer, J. Carpenter, and I. Olkin.2009. Why add
any-thing to noany-thing? The arcsine difference as a measure of treatment effect in
meta-analysis with zero cells. Stat. Med.28:721–738.
54.Ryu, T., C. H. Mavromatis, T. Bayer, C. R. Voolstra, and T. Ravasi.2011.
Unexpected complexity of the reef-building coralAcropora millepora
tran-scription factor network. BMC Syst. Biol.5:58.
55.Segonds, C., et al.2009. Microbiological and epidemiological features of
clinical respiratory isolates ofBurkholderia gladioli. J. Clin. Microbiol.47:
1510–1516.
56.Snyder, J. W., G. K. Munier, and C. L. Johnson.2008. Direct comparison of
the BD Phoenix system with the MicroScan WalkAway system for
identifi-cation and antimicrobial susceptibility testing ofEnterobacteriaceaeand
non-fermentative gram-negative organisms. J. Clin. Microbiol.46:2327–2333.
57.Song, F., K. S. Khan, J. Dinnes, and A. J. Sutton.2002. Asymmetric funnel
plots and publication bias in meta-analyses of diagnostic accuracy. Int. J.
Epidemiol.31:88–95.
58.Spanu, T., et al.2003. Use of the Vitek 2 system for rapid identification of
clinical isolates of staphylococci from bloodstream infections. J. Clin.
Micro-biol.41:4259–4263.
59.Spanu, T., et al.2004. Identification of methicillin-resistant isolates of
Staph-ylococcus aureusand coagulase-negative staphylococci responsible for blood-stream infections with the Phoenix system. Diagn. Microbiol. Infect. Dis. 48:221–227.
60.Stefaniuk, E., A. Baraniak, M. Gniadkowski, and W. Hryniewicz.2003.
Evaluation of the BD Phoenix automated identification and susceptibility testing system in clinical microbiology laboratory practice. Eur. J. Clin.
Microbiol. Infect. Dis.22:479–485.
61.Thompson, S. G., and S. J. Sharp.1999. Explaining heterogeneity in
meta-analysis: a comparison of methods. Stat Med.18:2693–2708.
62.Wallet, F., C. Loiez, E. Renaux, N. Lemaitre, and R. J. Courcol.2005.
Performances of Vitek 2 colorimetric cards for identification of
gram-posi-tive and gram-negagram-posi-tive bacteria. J. Clin. Microbiol.43:4402–4406.
63.Warton, D. I., and F. K. Hui.2011. The arcsine is asinine: the analysis of
proportions in ecology. Ecology92:3–10.
64.Zbinden, A., E. C. Bottger, P. P. Bosshard, and R. Zbinden.2007. Evaluation
of the colorimetric Vitek 2 card for identification of gram-negative nonfer-mentative rods: comparison to 16S rRNA gene sequencing. J. Clin.
Micro-biol.45:2270–2273.