Cleveland State University
EngagedScholarship@CSU
ETD Archive2018
Continuous Human Activity Tracking over a Large
Area with Multiple Kinect Sensors
Akshat C. Hans
Cleveland State University
Follow this and additional works at:https://engagedscholarship.csuohio.edu/etdarchive Part of theOther Computer Engineering Commons
How does access to this work benefit you? Let us know!
This Thesis is brought to you for free and open access by EngagedScholarship@CSU. It has been accepted for inclusion in ETD Archive by an authorized administrator of EngagedScholarship@CSU. For more information, please [email protected].
Recommended Citation
Hans, Akshat C., "Continuous Human Activity Tracking over a Large Area with Multiple Kinect Sensors" (2018).ETD Archive. 1079.
CONTINUOUS HUMAN ACTIVITY TRACKING OVER A LARGE AREA WITH MULTIPLE KINECT SENSORS
AKSHAT HANS
Bachelor of Engineering in Electronics and Telecommunication University of Mumbai
December 2012
Submitted in partial fulfillment of requirements for the degree MASTER OF SCIENCE IN ELECTRICAL ENGINEERING
at the
CLEVELAND STATE UNIVERSITY August 2018
We hereby approve this thesis For
AKSHAT HANS
Candidate for the Master of Science in Electrical Engineering degree Department of
Electrical Engineering and Computer Science And
CLEVELAND STATE UNIVERSITY’S College of Graduate Studies by
Committee Chairperson, Dr. Wenbing Zhao
Department & Date
Committee Member, Dr. Lili Dong
Department & Date
Committee Member, Dr. Yongjian Fu
Department & Date
June 21, 2018 Student’s
ACKNOWLEDGMENTS
Thanks go out to my thesis advisor and chairperson, Dr. Wenbing Zhao. I feel very fortunate to get a chance of taking his Computer Vision course which helped me to gain insight on one of the widely used camera sensor in computer vision research. I am incredibly thankful for his guidance, patience, perseverance and constant support during the completion of this thesis.
It is an honor for me to have Dr. Yongjian Fu and Dr. Lili Dong on my thesis committee. Finally, I would like to thank my friends and family for the unknowing sacrifice and moral support during the completion of this thesis.
iv
CONTINUOUS HUMAN ACTIVITY TRACKING OVER A LARGE AREA WITH MULTIPLE KINECT SENSORS
AKSHAT HANS
ABSTRACT
In recent years, researchers had been inquisitive about the use of technology to enhance the healthcare and wellness of patients with dementia. Dementia symptoms are associated with the decline in thinking skills and memory severe enough to reduce a person’s ability to pay attention and perform daily activities. Progression of dementia can be assessed by monitoring the daily activities of the patients.
This thesis encompasses continuous localization and behavioral analysis of patient’s motion pattern over a wide area indoor living space using multiple calibrated Kinect sensors connected over the network. The skeleton data from all the sensor is transferred to the host computer via TCP sockets into Unity software where it is integrated into a single world coordinate system using calibration technique. Multiple cameras are placed with some overlap in the field of view for the successful calibration of the cameras and continuous tracking of the patients. Localization and behavioral data are stored in CSV file for further analysis.
v
TABLE OF CONTENTS
Page
ABSTRACT ... iv
LIST OF TABLES ... viii
LIST OF FIGURES ... ix
CHAPTER I. INTRODUCTION ... 1
1.1 Thesis Organization ... 2
II. LITERATURE REVIEW ... 4
2.1 Human Detection ... 4
2.2 Human Tracking ... 7
2.3 Depth Cameras and Skeleton Tracking ... 8
2.4 Tracking with Multiple Sensors ... 10
2.5 Indoor Localization and Motion Monitoring ... 10
III. BACKGROUND ... 12
3.1 Kinect V1 vs Kinect V2 ... 12
3.2 Depth Camera Technology ... 14
3.2.1 Structured Light ... 14
3.2.2 Time-of-Flight... 16
vi
IV. CALIBRATION OF CAMERAS USING ROOMALIVE TOOLKIT ... 18
4.1 The ProCam Unit ... 19
4.2 Camera Calibration ... 20
4.2.1 The Pinhole Camera model ... 21
4.3 Calibration Process ... 24 4.3.1 Acquisition ... 25 4.3.2 Solving ... 27 4.4 Code Components ... 29 4.4.1 ProCamEnsembleCalibration.dll ... 29 4.4.2 KinectServer ... 30 4.4.3 ProjectorServer ... 30 4.4.4 CalibrateEnsemble ... 31 V. HARDWARE SETUP ... 32 5.1 Hardware Specification ... 32
5.2 ProCam Unit Placement ... 33
5.3 Configuring Calibration.xml ... 34
5.4 Practical Issues ... 36
VI. SOFTWARE IMPLEMENTATION ... 37
6.1 Environment Setup... 37
vii
6.3 User Interface ... 38
6.4 Creating 3D Model ... 39
6.5 World Coordinate System ... 40
6.6 User Tracking... 40
6.7 Recording Data ... 41
6.8 Activity Classification Model ... 43
6.9 Graphs ... 45
VII. EXPERIMENTAL RESULT ... 46
VIII. CONCLUSION ... 49
8.1 Conclusion ... 49
8.2 Future Work ... 50
viii
LIST OF TABLES
Table Page
ix
LIST OF FIGURES
Figure Page
1. Kinect v2 on the left, Kinect v1 on the right... 13
2. Infrared image of the dot emitted by the Kinect v1 to calculate depth [39] ... 15
3. Two discrete projector camera groups setup ... 19
4. Two projector camera groups connected by an overlapping camera ... 20
5. The pinhole camera model ... 22
6. Vertical gray code as seen by the first Kinect camera ... 25
7. Horizontal gray code as seen by the first Kinect camera ... 26
8. Vertical gray code as seen by the second Kinect camera ... 26
9. Horizontal gray code as seen by the second Kinect camera ... 27
10. Establishing global extrinsic by chaining together correspondences [36] ... 27
11. A unified 3D model of the room generated during calibration ... 28
12. ProCamEnsembleCalibration.dll UML class diagram ... 29
13. Hardware connection of ProCam unit ... 33
14. Kinect sensors and projector placement in the room ... 34
15. Calibration XML file showing the default pose matrix of the first Kinect camera ... 35
16. Kinect Trajectory Tracking GitHub repository... 38
17. The user interface of Kinect Tracker ... 39
18. Skeleton data overlaid on the 3D model ... 41
19. Code for tracking and recording head joint ... 42
20. CSV log file with timestamp and X, Y, Z world coordinate location of the tracked joints ... 42
21. Code for setting the threshold for Zones... 43
x
23. Code for total time calculation for standing category ... 44
24. Code for setting the value of pie chart ... 45
25. Trajectory of the tracked person in the world coordinate system ... 47
1
CHAPTER I INTRODUCTION
The importance of monitoring in the management of health and well-being is increasingly being emphasized nowadays. Diseases such as Alzheimer, the most common form of Dementia among the older population pose significant health threats. Dementia impairs the people’s ability to do routine work. One of the primary symptoms of dementia is memory loss. They may prepare a meal but might even forget that they cooked it. Dementia can also decrease the mobility of a person. Caregivers usually find themselves providing reminders to the patients. Family caregivers may sometimes find this embarrassing and upsetting, as it may invade the privacy of the patients. Allowing caregivers to monitor the patient’s status regarding motion behavior and position localization helps to better manage such patients by classifying episodes displayed by the patients.
Indoor localization in a smart scenario can significantly assist people suffering from dementia. A person’s location can indicate different activities being performed, for example; a person may have dinner at the dining table. Location information with respect to time can also help detect incidents such as freezing of gait in people who have Parkinson’s disease. It can also help identify specific events such as leaving or entering a
2
specific area such as a bathroom, kitchen or even recognizes when the person leaves home without notice.
The goal of this thesis is to develop a monitoring application for studying and recording the behavioral patterns of the patients by localization and classification of activities such as standing and sitting. The requirements of indoor monitoring system were to:
• Use multiple camera sensors to cover and monitor a large area.
• Record patient’s trajectory along with a timestamp.
• Classify activities and determine the total time spent in an area/room and sitting/standing.
• Provide a visual representation of classified activities.
This thesis uses RoomAlive toolkit, developed by Microsoft, which provides a platform for users to calibrate and create a 3D model of any room by using multiple Kinect cameras. RoomAlive toolkit utilizes a projector to display the gray codes for calibration of multiple Kinect sensors. The monitoring application records the head position of the tracked person with a timestamp in a CSV file. Unity game development engine is used to develop the application. Visual representation of classified activities is done using graphs.
1.1 Thesis Organization
Chapter II reviews previous work in human detection and tracking, it also reviews the latest related work using multiple depth cameras. Chapter III describes the background for selecting Kinect cameras. Chapter IV discusses the camera calibration
3
using the RoomAlive toolkit. Chapter V describes the hardware setup and chapter VI describes the software implementation of the application. Chapter VII discusses the
4
CHAPTER II LITERATURE REVIEW
Over the past years, the increase in computer vision research activities is tremendous. Partly because of the improvement in computer possessing power, facilitating technology such as autonomous driving, Face ID, and surveillance to become readily available. Many of the publication selected for this related work section contains multiple contributions, and few of them might be irrelevant to this thesis. Considering this, not all the papers will be discussed in totality but instead divided into sections that accompany the progression and relates to the idea of this thesis. The first section discusses the human detection followed by human tracking. The third section discuss research papers that use the skeleton model to detect and track people which are closely related to the idea of this thesis.
2.1 Human Detection
Background subtraction/separation is used to focus more on the foreground and eliminate the background clutter which usually creates ambiguity. Background subtraction extracts the foreground by calculating the difference between the sequence of images and the background model. Foreground can then be further processed to detect moving objects.
5
The most commonly used application of background subtracting is called ‘blue/green screening’. Current it is called chroma-keying [1]. Background separation is used to differentiate between foreground and background based on the color hue (chroma). Chroma-keying can be done using evenly lit, exposed and any distinct color surface as the background but the blue or green color are commonly used as the background surface, as it differs the most in hue from the human skin. Any part of the subject being recorded or captured cannot reuse the color of the background surface. Chroma-keying is commonly used in movies, games, and TV news programs. It can also be utilized in the immersive virtual environment [2]. Earlier, Special dedicated hardware was used for performing chroma-keying. Due to the availability of low-cost PCs and advancement in computer vision, software-based solutions are available that deliver far more superior background separation, and it turns out to be much cheaper than dedicated hardware [3].
Paul et al. [4] use frame differencing for moving objects. Here, the current image frame is subtracted from the suitable reference frame. After which appropriate threshold is selected based on the hysteresis thresholding algorithm and applied to the difference frame to detect the pixels that may correspond to the motion. There are some problems with these two approaches. If the foreground contains similar colors to that of the background, they will be removed. Shadows can be detected as foreground. Background subtraction for outdoor activities without controlled lighting and exposure can be complicated as compared to indoor. Adaptive background separation is used to overcome this shortcoming.
6
For classifying objects as human, feature descriptor such as scale-invariant feature transform (SIFT) [5] and a histogram of oriented gradients (HOG) [6] can be used on background subtracted images. HOG is often used along with machine learning algorithms such as linear support vector machine which requires the training of a classifier or Schapire’s AdaBoost [7]. The AdaBoost algorithm selects a small number of week classifiers from a large pool of possible week classifiers and constructs strong classifier as a linear combination of selected weak classifiers. Avidan [8] train a set of weak classifiers to distinguish between the background and an object and then ensemble of weak classifiers is combined into a strong classifier using AdaBoost.
Viola and Jones [9] [10] proposed a widely recognized face detection system. They introduced a new image representation called ‘Integral Image’ for fast computation. Once computed, based on the idea of Haar wavelets [11], Haar-like features are computed. The classifier is constructed by selecting a small number of essential features using AdaBoost. Lienhart and Maydt [12] extended this work by introducing a novel set of rotated Haar-like features for publicly available initially developed by Intel, Open Source Computer Vision Library, OpenCV [13].
Template matching is also widely used for detecting humans. In [14], a group of average normalized precomputed histogram template of people in different posture is compared with the current silhouette to detect humans. In [15], the binary head template is used to compare with edge image. Before matching, a distance transform is computed to increase the efficiency of the matching process. This distance transform is then used to create a distance map of the edge image. The template is then translated and positioned at various locations of the distance map and matching is done to determine head like object.
7
2.2 Human Tracking
Tracking is the essential component for surveillance applications. Many methodologies have been proposed for tracking humans based on variations of the same Bayesian framework [16], such as Kalman Filters [17], Particle Filters and Mean-Shift algorithm. Kalman Filters have been utilized widely to track in many domains. A large number of works [18], [19], [20], [21], [22], [23] have used Kalman filters for Tracking. In particle filtering, the posterior is at first approximated by the arrangement of discrete samples with related weights. The particle with smaller weight is disposed of in the following iteration, while those with the substantial weight is replicated to maintain the population size. The particle filter will converge on a hypothesis after several iterations. For tracking people in the cluttered scene, many papers make use of particle filtering. In [24], Breitenstein et al. proposed a multi-person tracking-by-detection in a particle filtering framework. Detection and detection confidence are used for propagating the particles. The method proposed by Comaniciu et al. [25] provides basic tracking framework based on a mean-shift algorithm. Tracking is done by finding the peak in the probability density function calculated on each pixel using color similarity.
Occlusion makes tracking difficult. In single camera systems, to cope with the occlusion, approaches such as the predicted position of the occluded person until the person re-appears [26] is common to find. In partial occlusion, the visible part of the person can still be used to track the person. The camera can also be placed higher facing downwards to reduce the effect of occlusion. With the continuous increase in computing power, many researchers are inclined towards the use of multiple overlapping cameras to reduce the effect of occlusion [27].
8
2.3 Depth Cameras and Skeleton Tracking
RGB-D cameras provide an additional stream of depth data along with the color stream. Human detection and tracking from color frames can be difficult due to a range of factors. Detection of humans using 2D color image can become difficult with the change in illumination, color, clutter, and occlusion as it becomes cumbersome to separate background and foreground. On the other hand, depth image greatly simplifies the problem of inconsistent color and illumination. Color frames represent the 3D world in a 2D image. This conversion of 3D space into the 2D image can be represented by a pinhole camera model. The depth image is a simple representation of the 3D space. Background separation is a lot easier in a depth image as compared to the 2D color image. Spinello and Arras [28] proposed people detection using a histogram of oriented depth (HOD), inspired by HOG but using depth information instead. Stereo cameras are also used for range (depth) imaging. Masuyama et al. [29] detect humans by using subtraction stereo to the images captured by a stereo camera to obtain foreground region and corresponding depth information.
During recent years, different types of depth cameras have emerged. However, earlier depth cameras were expensive. Microsoft Kinect [30] was launch by Microsoft back in 2010 and was initially developed for the Xbox gaming console. Later, many computer vision research communities and other less apparent communities such as Design, Materials Science, Robotics, Biology, and Medicine started using the Kinect because of its reasonable depth accuracy and affordability. Lun et al. [31] published a comprehensive survey on Kinect sensor’s application and technological front covering variety of areas, including healthcare, robotics, education and performing arts, retail
9
services, workplace safety training, sign language recognition and 3D reconstructions. In [32], Zhao et al. implemented, and field tested a Kinect based tracking system for bedside care in nursing homes while tackling the problem of invasion of privacy by implementing a unique novel privacy-aware compliance tracking system (PACTS). The Kinect sensor provides real-time 3D human skeleton data which used to be only possible with expensive computer vision systems, thereby extensively popularizing skeleton based human representation. In skeleton tracking, the human body is rendered by a number of joints representing different body parts, every joint being represents by its 3D coordinates.
3D skeleton based human representation also reveal promising performance in real-world applications such as Kinect based motion controller. 3D skeleton data from Kinect is also robust to illumination changes. Skeleton detection and processing are done in the Kinect device itself to offload the computing power required for skeleton processing from user’s computer and facilitate high frame rate, real-time, online applications using the skeleton data provided by Kinect. Zhao et al. [33] developed a Kinect-based rehabilitation exercise monitoring system which shows that the skeleton data provided by the Kinect can be successfully used in monitoring rehabilitation exercises. In [34], a rule-based human motion tracking framework is demonstrated by showing the detailed rules for hip abduction, bowling and sit to stand exercises commonly used in rehabilitation. In [35], Zhao et al. designed, implemented and evaluated a Kinect based system to increase the workers compliance to best practices and alert them discreetly on detection of noncompliant activities empowering healthier and more productive workplace.
10
2.4 Tracking with Multiple Sensors
Often in applications such as surveillance and activity tracking, large field of view is required to cover every part of the room or area being monitored. A standard solution to increase the field of view is to use camera networks along with sensor fusion. In [34], Caon et al. used a simple method of skeleton data fusion, using Kinect v1 cameras for their smart environments related application. They proposed a weighted averaging method for joints coordinate fusion. A weighting factor of the joint coordinates depends on the tracking state of the joints derived from Kinect SDK and a total number of joints tracked. In [35], multi-Kinect sensor setup is used for dismounted soldier training. Similar weighting approach of the joint coordinates based on the Kinect SDK provided tracking state but extended by depth-to-joint cross-validation. Cross-validation is done by comparing the joint depth (Z) with the point cloud’s depth measurement at the same X-Y coordinates. In [36], Two perpendicular Kinect sensors are used. One sensor is defined as the primary sensor. If the primary sensor does not track a joint, coordinates of the untracked joint are substituted by the one tracked by the second Kinect sensor.
2.5 Indoor Localization and Motion Monitoring
OpenPTrack [37], is an open source multi RGB-D camera person tracking software. While this does not detect the skeleton, it is possible to monitor the trajectory of more than six people as compared to the Kinect which can only track up to six people over a large area using calibrated networked cameras. Streaming of the tracking data is done using UDP and NDN in JSON format. The RoomAlive toolkit [38] uses multiple calibrated Kinect cameras for dynamic projection mapping to enable immersive
11
augmented experience using projectors. RoomAlive uses a distributed network for tracking touch detection and body movements using optical-flow based particle tracking.
Torres et al. [39] use a combination of computer vision and dead-reckoning for indoor localization. Their system is composed of wearables and fiducial markers for tracking. Klingbeil et al. [40] demonstrated a wireless sensor network for positioning and monitoring human motion in an indoor environment. They used an inertial sensor along with a mobile sensor node worn by the person moving inside the building. Motion data is processed on the onboard mobile node and transferred to a static network of seed nodes. Based on the person’s pedometric mapping, seed node position and indoor map information, location is calculated using a Monte Carlo based algorithm. Chen et al. [41] proposed an intelligent video monitoring system to improve the safety of old persons who have dementia. They used 23 cameras to record daily activity. Elopement activity is detected using a Hidden Markov Model (HMM).
Even though there are many multiple Kinect activity monitoring approaches, these systems mostly make use of Kinect v1 sensor because up to four sensors can be connected to the same PC reducing the complexity of the system. Our system, on the other hand, uses multiple Kinect v2 sensors using distributed network because of its reasonably high accuracy, low interference between multiple cameras and better occlusion handling. We do not use any wearable devices or fiducial markers for localization and monitoring as it has a significant impact on acceptability, especially for older people.
12
CHAPTER III BACKGROUND
Microsoft Kinect is 3D sensing device first launched in November 2010 as a motion sensing input device for Xbox 360 console. Kinect v1 was the first sensor that made 3D sensing accessible at low cost. Kinect features an RGB camera, depth sensor and multi-array microphone which provides capabilities such as facial recognition, 3D motion capture and voice recognition along with raw color, depth, skeleton and audio streams. Kinect’s skeleton data does not require users to wear markers, unlike other skeleton tracking systems. Even though the markerless skeleton tracking systems are not as accurate as tracking systems with a marker, it provides excellent flexibility and sufficient accuracy for most of the applications. The newer version of Kinect, Kinect v2 also provides raw infrared data. It became apparent that Kinect will not be limited to gaming applications.
3.1 Kinect V1 vs Kinect V2
Microsoft released the Kinect v2 in 2014 with significant improvements. Kinect v2 offers wide field-of-view, higher resolution, low latency with USB 3.0, better skeleton accuracy and new depth-sensing technology. Kinect v2 sensor also provides face
13
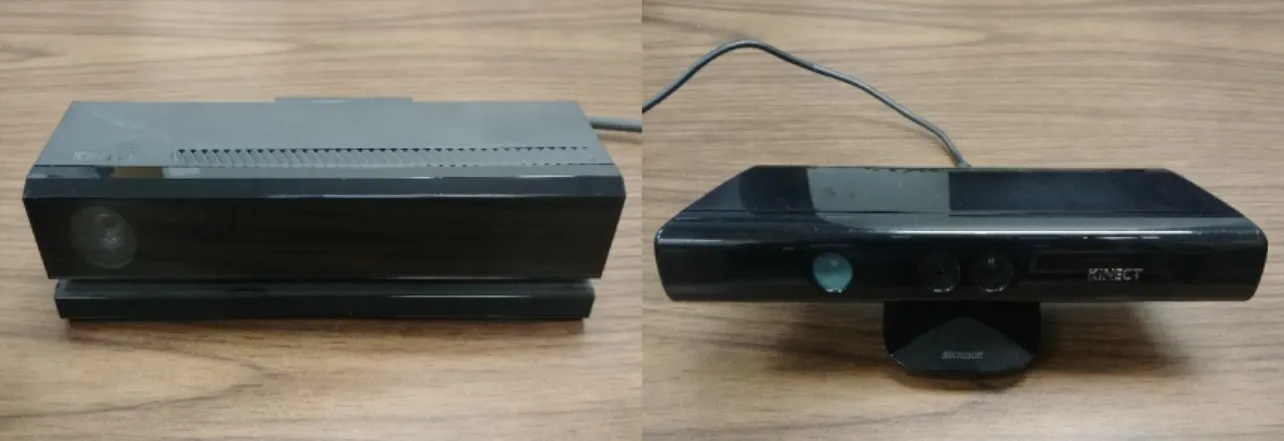
orientation of the tracked user such as pitch, yaw, and roll along with many other face details. Kinect v2 and Kinect v1 sensors are shown in Figure 1.
Figure 1: Kinect v2 on the left, Kinect v1 on the right
Apart from all the new specification, Kinect v2 can track six people with more number of joints and with greater precision as compared to Kinect v1 which can recognize six people but only able to track (full skeleton) two peoples. Table I shows a comparison of Kinect v1 and Kinect v2 specifications.
Table I : The specification for the Kinect v1 and v2
Feature Kinect V1 Kinect V2
Color Camera
- Horizontal Field of View - Vertical Field of View
640 x 480 @ 30 fps 57 degrees 43 degrees 1920 x 1080 @ 30 fps 84 degrees 54 degrees Depth Camera
- Horizontal Field of View - Vertical Field of View
320 x 240 @ 30 fps 57 degrees 43 degrees 512 x 424 @ 30 fps 70 degrees 60 degrees Infrared Camera 320 x 240 @ 30 fps 512 x 424 @ 30 fps Depth Sensing Technology Structured Light
(PrimeSense Light Coding)
Time of flight (ToF)
Minimum Latency 102 ms 20 - 60 ms
Skeleton Joints Defined 20 joints 25 joints
Full Skeleton Tracked 2 6
14
Many studies show that Kinect v2 is better than Kinect v1. Wasenmuller and Stricker [42] evaluated the depth image of both the sensors and concluded that the Kinect v1 sensor’s depth data accuracy and precision decrease exponentially with the increase in distance, whereas Kinect v2 accur acy and precision remains constant. Further, Wasenmuller recommends using Kinect v2 over Kinect v1 for 3D reconstruction applications. Wang et al. [43] gave the insight of skeleton data accuracy of Kinect v1 and v2 sensor. The overall results show that the Kinect v2 sensor has better accuracy in joint 3D position estimation and is more robust to body rotation and occlusions. However, possibly due to Time-of-Flight technology used in Kinect v2, the lower legs joint 3D positions were tracked with large offsets, which was not the case with the Kinect v1 which employs structured light technology for obtaining depth data.
3.2 Depth Camera Technology
This section will describe the structured light and Time-of-Flight depth sensing technology.
3.2.1 Structured Light
Kinect v1 uses PrimeSense’s patented Light Coding™ technology which is based on structured light technology for depth sensing. In this structured light technology, infrared light generated by infrared projectors is passed through a diffraction grating which projects the infrared laser beam as a set of semi-random dots. These infrared dots are projected on to the scene as seen in Figure 2. Relatively standard CMOS sensor with a bandpass filter centered at the infrared band wavelength is used to detect the infrared dot patterns. Infrared emitter and CMOS detector are placed at a known fix distance, and depth data is recovered by simple triangulation.
15
Figure 2: Infrared image of the dot emitted by the Kinect v1 to calculate depth [39]
The disadvantage of Structured light technology is that the fixed number of dots are projected on to the scene, irrespective of the distance of the objects. Therefore, the closer objects will be represented by more dots that than the object farther away from the sensor, resulting in decreased depth sensing precision with the increase in distance. Another disadvantage of this structured light technology is that if multiple overlapping Kinect cameras are used, Kinect v1 cannot differentiate between the dot pattern projected by itself and the dot pattern projected by the other Kinect cameras causing an interference issue. In this thesis research, multiple Kinect cameras are used to increase the field of view and requires at least 10% overlapping of the cameras for the camera calibration to work.
16
3.2.2 Time-of-Flight
Kinect v2 utilize Flight technology for depth measurements. Time-of-Flight technology works by measuring the time it takes for the modulated laser light pulse to travel from a laser projector to the object in the scene, and then back to an image sensor. Based on the modulation frequency and the speed of light, a distance of each pixel is calculated, resulting in a 3D image. Kinect v2 calculates the distance by dividing a pixel into two halves such that when the first half is on, it will absorb the light and the second half will reject the light. Similarly, when the second half is on, it will absorb the light and the first half will reject the light. The light source is being pulsed in phase with the first pixel half such that when the first pixel is on, the laser diode is also on. If the object is close to the sensor, a higher amount of laser light will be absorbed by the first half of the pixel than the second half. If the object is farther away from the sensor, the travel time of the light will increase, and more light will be absorbed by the second half of the pixel than the first half. The total amount of photons absorbed by both halves are compared and the round-trip distance of the light traveled is estimated. Hence maintaining the precision of depth data even if the object is far away, giving Kinect v2 depth-sensing technology an edge over Kinect v1’s structured light technology where the number of infrared dots shared among pixels get reduced with the increase in distance. Kinect v2 also works well for outdoor applications and rejects ambient lighting by resetting the pixel in the middle of exposure if the pixel is over saturated by the ambient light.
17
3.3 Disadvantage of Kinect V2
With the increase in the amount of data because of the higher resolution, Kinect v2 uses higher bandwidth USB 3.0 for data transmission and a maximum of one Kinect v2 can be connected to the same PC as compared to Kinect v1 which uses USB 2.0 and can connect up to four sensors to the same PC. In this thesis research, multiple Kinect v2 sensors are used because of all the advantage, new technology and to increase the field of view, but due to this limitation, a distributed network is used to transmit skeleton data to the server.
18
CHAPTER IV
CALIBRATION OF CAMERAS USING ROOMALIVE TOOLKIT
RoomAlive Toolkit [36] is an open source SDK developed by Microsoft for dynamic projection mapping research and has been in use at Microsoft Research for many years. RoomAlive Toolkit has been used by Microsoft for many interactive projection mapping and augmented reality projects. The basic building blocks of RoomAlive toolkit consist of an ensemble of projectors and cameras, or ‘ProCam’ unit and enables developers to calibrate multiple Kinect v2 sensors and video projectors connected over the network. RoomAlive captures and creates a unified 3D model of the geometry and appearance of the room. RoomAlive Toolkit consists of two separate projects developed in C# language.
• ProCamCalibration - This project consists of KinectServer, ProjectorServer and CalibrateEnsemble applications which are used to calibrate multiple projectors and Kinect v2 cameras.
• RoomAliveToolkitForUnity – RoomAlive Toolkit for Unity contains a set of scripts to enable dynamic projection mapping based on the Calibration data from ProCamCalibration. It also streams Kinect data to Unity. This thesis research only makes use of the streaming script from this project.
19
4.1 The ProCam Unit
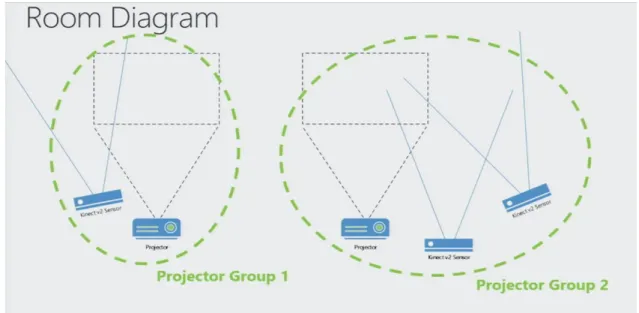
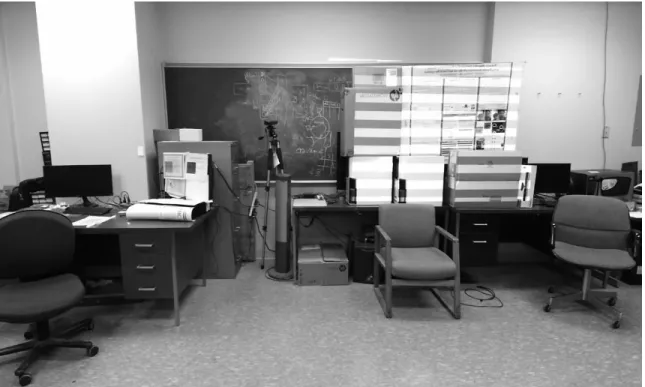
RoomAlive Consists of multiple projector-camera units called ProCam. Projector projects out on to the room and Kinect camera also looks out on to that room. Projector and all the depth camera that can see some part of the gray code that projector displays form a projector group. Multiple projector groups will be needed to create a full 3D model of a room. Another projector out someplace else in the room might have two more Kinect sensors next to it, and that would form another projector group, these two groups are a distinct group as seen in Figure 3 and there is no way to relate the geometry of both the groups.
Figure 3: Two discrete projector camera groups setup
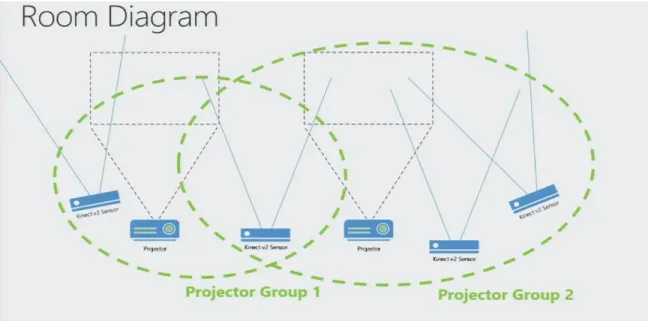
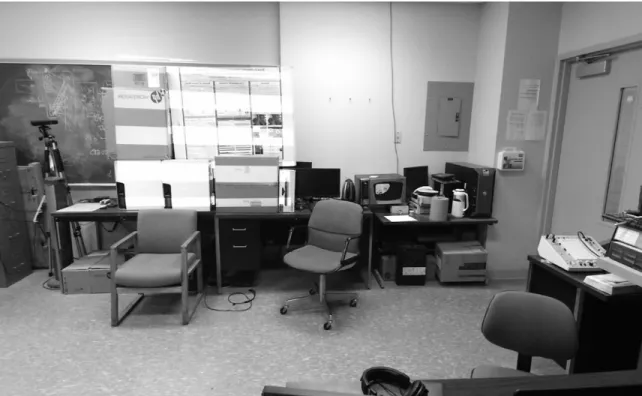
To relate the geometry of one group to the other, a third camera which will overlap both the groups is needed as seen in figure 4. This third camera belongs to both
20
the group will help establish the geometry of the two groups together. Overlap of multiple camera groups is referred as an ensemble.
Figure 4: Two projector camera groups connected by an overlapping camera
4.2 Camera Calibration
Geometric camera calibration estimates the intrinsic and extrinsic of all the cameras in the ensemble. Intrinsic camera parameters provide information about the camera focal length, optical center, and image sensor format. Extrinsic camera parameters describe the coordinate system transformations from 3D world coordinates to 3D camera coordinates such as position and orientation of the camera center in world coordinates. Using intrinsic and extrinsic parameters, complete camera matrix can be derived. Complete camera matrix can be used to associate 2D points on the image plane with 3D points in the world coordinate system. Complete camera matrix is used in application such as background blur (limited depth of field effect) seen in recent mobile phones equipped with two cameras which uses stereo vision to calculate the 3D world
21
coordinates of the point viewed by both cameras. Calibration is essential in computer vision systems where more than one cameras are used and where exact geometrical measurements are performed. In this thesis research, the first Kinect camera establishes the coordinate system for the entire ensemble. The pose of the first Kinect camera in the ensemble will become the origin of world coordinate system and every other camera will be calibrated to the first Kinect camera. A simple pinhole camera model can be used to describe the intrinsic, extrinsic and complete camera matrix.
4.2.1 The Pinhole Camera model
The mathematical relationship between the coordinates of the points in 3D space and its projection on to the image plane of a camera can be described by the pinhole camera model. In pinhole camera model, camera aperture is described as a point instead of lens used in cameras to focus light and hence, does not consider the geometric distortions such as radial distortion and tangential distortion caused by the lens. These distortions can be modeled using Brown’s distortion model for more accurate representation in complex camera systems. Images produced by ultra wide-angle lens tends to have a strong visual barrel distortion effect also known as a fisheye effect which can be corrected in software by modeling the distortion.
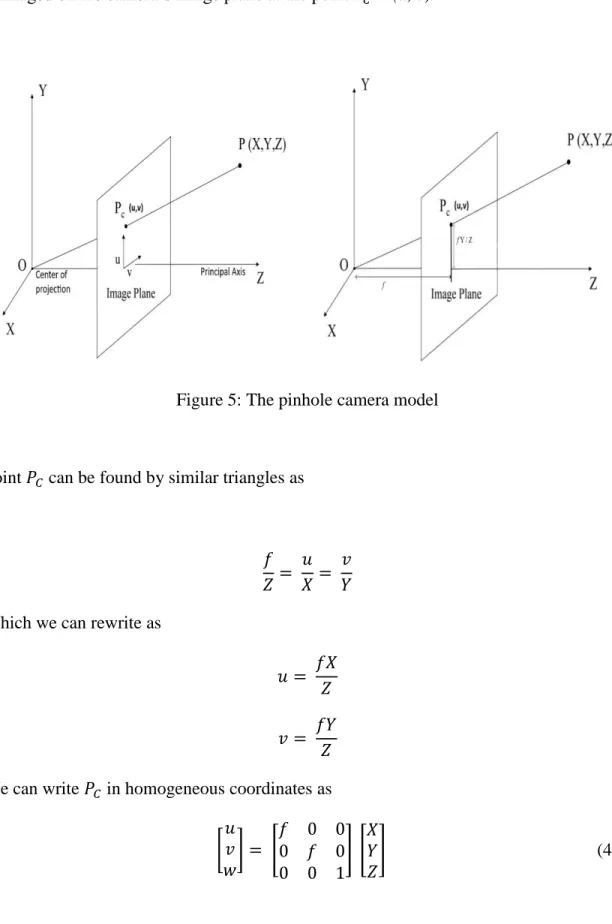
Figure 5 shows a camera with the center of projection O also called as camera center. The image plane is at focal length f from the center of projection O. In actual pinhole camera model; the image plane is behind the center of projection resulting in a mirrored image, it is much easier for calculations to assume the image plane at the focus in front of the center of projection. Principle axis is the line passing through the center is
22
projection perpendicular to the image plane. A 3D point P = (X, Y, Z) in the world space is imaged on the camera’s image plane at the point 𝑃𝐶 = (u, v).
Figure 5: The pinhole camera model
Point 𝑃𝐶 can be found by similar triangles as
𝑓 𝑍 = 𝑢 𝑋= 𝑣 𝑌 Which we can rewrite as
𝑢 = 𝑓𝑋 𝑍 𝑣 = 𝑓𝑌
𝑍 We can write 𝑃𝐶 in homogeneous coordinates as
[ 𝑢 𝑣 𝑤 ] = [ 𝑓 0 0 0 𝑓 0 0 0 1 ] [ 𝑋 𝑌 𝑍 ] (4.1)
23
If the 2D image coordinate system’s origin does not coincide with where the principal axis intersects the image plane (principal point), point 𝑃𝐶 needs to be translated to the
desired origin. Now (u, v) can be rewritten as 𝑢 = 𝑓𝑋
𝑍 + 𝑗𝑢 𝑣 = 𝑓𝑌
𝑍 + 𝑘𝑣 Where translation is defined by (𝑗𝑢, 𝑘𝑣).
Similarly, this can be expressed as Equation 1 as follows:
[ 𝑢 𝑣 𝑤 ] = [ 𝑓 0 𝑗𝑢 0 𝑓 𝑘𝑣 0 0 1 ] [ 𝑋 𝑌 𝑍 ] (4.2)
𝑃𝐶 is expressed in inches in Equation 2. To express it in pixels, camera resolution in pixel
per inches needed to be known. If the pixels are square, the resolution will be equal in each u and v directions. For rectangular pixel, we can denote the resolution in u direction by 𝑔𝑢 and in v direction by 𝑔𝑣 pixels/inch. To express 𝑃𝐶 in pixels, u and v coordinates
should be multiplied by 𝑔𝑢 and 𝑔𝑣 respectively. 𝑢 = 𝑔𝑢𝑓𝑋
𝑍 + 𝑔𝑢𝑗𝑢 𝑣 = 𝑔𝑣𝑓𝑌
𝑍 + 𝑔𝑣𝑘𝑣 𝑃𝐶 in pixels can be expressed in matrix form as follows
[ 𝑢 𝑣 𝑤 ] = [ 𝑔𝑢𝑓 0 𝑔𝑢𝑗𝑢 0 𝑔𝑣𝑓 𝑔𝑣𝑘𝑣 0 0 1 ] [ 𝑋 𝑌 𝑍 ] = [ 𝛼𝑥 0 𝑢𝑜 0 𝛼𝑦 𝑣𝑜 0 0 1 ] P = KP (4.3)
24 𝐾 = [ 𝛼𝑥 𝑠 𝑢𝑜 0 𝛼𝑦 𝑣𝑜 0 0 1 ]
K only depends on the intrinsic parameters of the camera such as focal length denoted by 𝛼𝑥 and 𝛼𝑦 which are different for x and y for the non-square pixels, offset of the origin of
the image plane and the principal point in pixels denoted by 𝑢𝑜 and 𝑣𝑜 and thus defines the intrinsic parameters of the camera and usually called as ‘intrinsic matrix’.
If the camera is oriented arbitrarily and does not have its center of projection at (0, 0, 0), we need a translation and rotation to make the camera coordinates system coincide with the world coordinate system. Let the rotation be given by a 3 × 3 rotation matrix R and translation by T(𝑇𝑋, 𝑇𝑌, 𝑇𝑍). The matrix formed by first applying translation and then rotation is given by the 3 × 4 matrix as follows
E = (R | RT)
E is the ‘extrinsic matrix’. The complete camera transformation is given by K (R | RT) = (KR | KRT) = KR (I | T)
Therefore 𝑃𝐶 is given by
𝑃𝐶 = KR (I | T) P = CP
Where C is a 3 × 4 matrix usually called the ‘camera matrix’. Because C is a 3 × 4 matrix, P needs to be in 4D homogeneous coordinates and resulting 𝑃𝐶 will be in 3D homogeneous coordinates. Exact 2D coordinates of the projection on the image plane can be obtained by dividing the first two coordinates of 𝑃𝐶 by the third coordinate.
4.3 Calibration Process
Calibration finds the pose and position of every Kinect camera in the ensemble along with lens distortion and focal length. Calibration process consists of two phases,
25
‘acquisition phase’ and ‘solve phase’. The calibration process is completely automatic and does not require user interventions. Cameras are placed in the room such that it will extend the field of view while still having ~10% overlap between the cameras.
4.3.1 Acquisition
In acquisition phase, the projector displays a series of gray codes which are observed by the all the color cameras and takes a snapshot as seen in Figure 6, 7, 8 and 9. These gray codes are used to establish the mapping from a pixel in the color camera to a pixel coordinate in the projected display. Camera intrinsic such as focal length and lens distortion is obtained and stored in the XML file. It also stores the depth image and mean depth image for the calibration process.
26
Figure 7: Horizontal gray code as seen by the first Kinect camera
27
Figure 9: Horizontal gray code as seen by the second Kinect camera
4.3.2 Solving
28
The calibration begins with transforming each correspondence into depth image using API provided by Kinect SDK. This results in 2D to 3D point correspondences. These correspondences between 3D points and their projections on the camera images are then passed to OpenCV’s calibrateCamera function to find intrinsic and extrinsic parameters of each unit. To increase the robustness RANSAC procedure is used. To find the global extrinsic between the two Kinect cameras, correspondence between two units is computed as shown in Figure 10. First the depth pixel in Unit 0 (𝑑0) is mapped to an
RGB pixel in Unit 0 (𝑟0), then the corresponding projector pixel (𝑝1) is mapped in Unit 1
by decoding the gray codes. Gray code correspondence is then inverted to look up the RGB pixel (𝑟1) in Unit 1. Finally, the correspondence between two units is found by inverting the transfer map resulting in depth pixel (𝑑1).
29
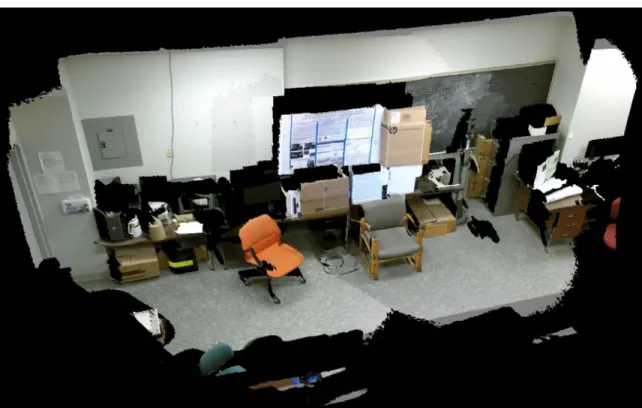
Solve phase also merge the color and the depth data collected from all the Kinect sensors and creates a unified 3D model of the room as seen in Figure 11. which helps the user to check the quality of registration. The model is also exported to an obj file which can be directly imported into Unity.
4.4 Code Components
The RoomAlive Toolkit code is completely written in C#. This section discusses four components used for the calibration process.
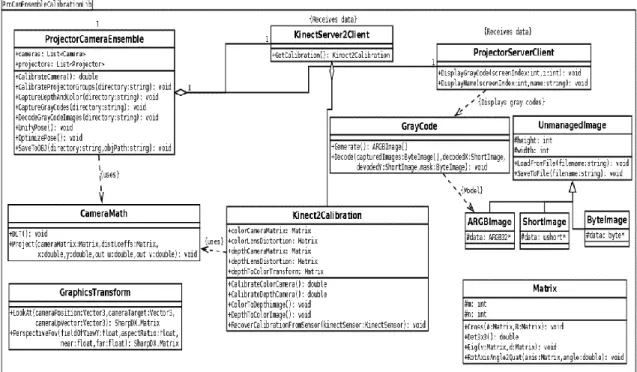
Figure 12: ProCamEnsembleCalibration.dll UML class diagram
4.4.1 ProCamEnsembleCalibration.dll
ProCamEnsembleCalibration.dll is the core of the project and has all the calibration code in it. It is used in the calibration step to:
• Acquire calibration patterns and calculate the camera parameters of Kinect and projector such as focal length, optical center and the dimensions of the camera.
30
• It calculates the pose, i.e. position and orientation of all the Kinect and the projectors.
• It provides ways to interact and pull out the calibration results at runtime.
Figure 12 shows the UML class diagram. ProjectorCameraEnsemble is the main class that uses other helper classes to checks for the connected cameras and projector, makes the projector display the gray code and captures them with Kinect’s color camera. Then it decodes the gray code and finds the pose of Kinects and projector. It also creates the unified 3D model of the room and saves it to .obj file.
The KinectServer2Client and ProjectorServerClient classes are used to
communicate with their relative servers. The Kinect2Calibration class does all the calibration of the Kinect sensor. GrayCode class is used to create gray code images using ARGBImage. The Matrix class handles the matrix calculation.
4.4.2 KinectServer
Single Kinect v2 sensor can be connected to a computer simultaneously, therefore KinectServer runs on every PC that has a Kinect sensor. KinectServer is a tool to distribute color data, depth data and camera intrinsic from each Kinect cameras around the network. It’s a standalone application with no user interface. It uses Windows Communication Foundation (WCF) and requires Kinect for Windows V2 SDK.
4.4.3 ProjectorServer
The ProjectorServer is analogous to KinectServer. It runs on every PC that has a projector connected to it. During the acquisition phase, each projector is assigned to an index specified in the XML file and displays the gray code from the projector. Projector server is only required during the acquisition phase of the calibration setup.
31
4.4.4 CalibrateEnsemble
The CalibrateEnsemble provides the GUI for the calibration process. It also assists in setup and configuring all the Kinect sensors and projectors for calibration. Creates an XML file to store the calibration information and allows the user to view the results.
32
CHAPTER V HARDWARE SETUP
This chapter discusses the overall hardware setup and necessary initialization of all the Kinect sensors and projectors used in the system.
5.1 Hardware Specification
In this thesis research, only one ProCam unit is used. ProCam unit was created using two Kinect sensors and one projector. Optoma TX536 projector was used to calibrate the two Kinects. Optoma TX536 projector does not have a wide field of view and only covers a small portion of the room, but it is sufficient for calculating the position and orientation of the Kinect. Wider field of view of the projector will result in more accurate intrinsic calculations of the Kinect cameras. The two Kinect v2 cameras were placed horizontally with a slight tilt of around 5°. The ProCam unit’s connection diagram can be seen in Figure 13.
The host computer was an Intel Core i7-6820HQ 2.7GHZ CPU with 8GB DDR3 RAM running Windows Server 2016. First Kinect v2 sensor is connected to the host PC via USB 3.0. Projection is also connected to the host PC because ProjectorServer.exe does not support distributed rendering framework. The second Kinect sensor is connected
33
to another PC with Intel Core i7 6600U 2.5GHZ CPU and 8GB DD3 RAM running Windows
10. At first, both the PCs were connected using Wi-Fi to the network switch which significantly slows down the data transfer rate between the PCs. Later we switched to a more stable and fast wired ethernet connection.
Figure 13: Hardware connection of ProCam unit
5.2 ProCam Unit Placement
The primary goal of Kinect placement is to increase the field of view. A different arrangement of Kinect sensors in the room has been tried for successful calibration. Requirements for proper room setup are as follows
• Kinect sensors should be placed such that both the sensors should view the gray codes projected by the projector. At least 10 % overlap should be there.
34
• Both the color camera and the depth camera of both the Kinect sensors must observe the projected gray code.
• The projector should be configured in ‘desktop front’ projection mode.
• Windows should be set to ‘Extend’ its desktop to the projector.
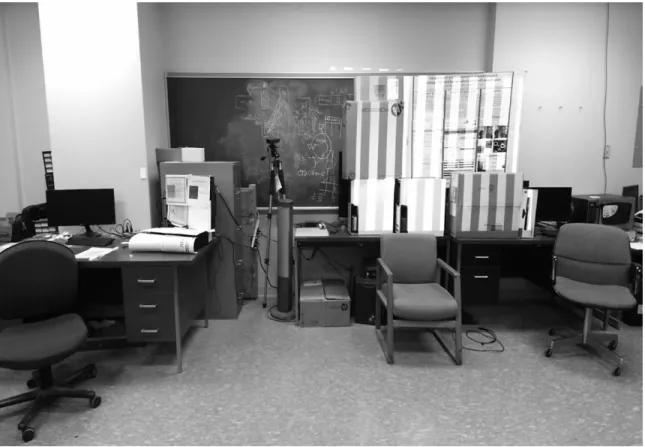
Figure 14: Kinect sensors and projector placement in the room
Figure 14 displays the position of the two Kinect sensors and projector in the room. Kinect SDK’s Color Basic and Depth Basic samples were used to make sure both the Kinect camera’s color and depth image observe the projected image.
5.3 Configuring Calibration.xml
CalibrateEnsemble.exe has a user interface which allows the user to select the number of cameras and projectors in the ensemble and automatically creates a new
35
calibration XML file with some of the information filled in. XML file has a number of cameras and projectors.
Figure 15: Calibration XML file showing the default pose matrix of the first Kinect
camera
The user can rename the cameras and projectors listed in the XML file. We have to manually enter the hostname or IP address for each Kinect cameras and projectors in the XML file. The pose information is a 4 × 4 matrix which is by default set to identity matrix for the first Kinect in the XML file listed as seen in Figure 15. That means the first camera is in that pose within the global coordinate frame. This default pose matrix of the first camera will not change post calibration. Alternatively, the user can establish a
36
different position for that camera manually. We also have to change the ‘displayindex’ value under the projector. For an external display such as a projector, the displayindex value should be set to ‘1’, ‘0’ being the main display.
5.4 Practical Issues
• When placing the objects in the scene for the projector to project on, we had to make sure there were no black objects in the scene. Kinect v2 sensor uses infrared Time of Flight technology to detect depth in the scene. Black objects absorb most of the infrared light and hence most of the infrared laser light transmitted by the Kinect sensor was getting absorbed by the black objects resulting in corrupted depth data and unsuccessful calibration.
• The best Kinect sensor placement to avoid occlusion is to place the sensor higher than the average human height or mount the sensors on the ceiling. In both of the cases, the sensor needs to be tilted downwards. If the first Kinect sensor is placed tilted, the global coordinate system will also have a tilt as it is aligned with the first sensor. The global coordinate system can be corrected, so the gravity points downwards by using Kinect’s accelerometer data. In our hardware setup, the tilt of the first sensor is kept close to 0°.
37
CHAPTER VI
SOFTWARE IMPLEMENTATION
In this chapter, we describe the implementation of human trajectory and activity tracking based on the Kinect skeleton data received by the host PC from two calibrated Kinect cameras. The system stores the skeleton data in a CSV file for further processing and categorizes the data based on the different area of the room and whether the person is sitting or standing. It calculates the total time spent by the person in each category. Finally, it displays the total time spent data in the form of a pie chart.
6.1 Environment Setup
The language used for programming is C# throughout the implementation. The application is developed in Unity 2017 game development engine using Microsoft Visual Studio Community version as an editor. Kinect for Windows SDK V2.0 color and depth samples were used for proper placement of Kinect sensors. Revision control is done using Git Revision Control
Revision control is used to manage all the iterative changes of program. GitHub is used for revision control of the software code. It allows the user to revert to any previous version of the code easily and to keep track of all the changes committed to the code. Figure 16 shows the preview of the repository on GitHub.
38
Figure 16: Kinect Trajectory Tracking GitHub repository
6.2 User Interface
The user interface includes a 3D model of the room with the two Kinect sensor 3D model placed at the exact locations in the room as determined by the calibration. ‘Start Recording’ button records full skeleton data into a CSV file. The user can stop the recording of skeleton data by clicking on ‘Stop Recording’ button. ‘Process data’ button in the UI once clicked reads back the stored skeleton data, classify the data and calculates the total time spent in each category and draws a pie graph using ‘Graph and Chart’ plugin [44]. It also displays the total time spent in each category. The user interface of the application can be seen in Figure 17.
39
Figure 17: The user interface of Kinect Tracker
6.3 Creating 3D Model
The calibration process generates .xml and .obj files which is used in Unity to create the 3D model of the room. Object file describes the geometric properties of the room and can be directed imported in Unity Engine. Photos captured by both the Kinect cameras are used to colorize the 3D model. Each Kinect sensor is linked to their respective empty game object. XML calibration file contains the pose matrix of the Kinect sensors which used to position the Kinect sensors game object in the 3D model. ‘RATCalibrationData’ script reads the XML file to extract pose information. ‘RATSceneSetup’ contains the helper functions that automate the connection and dependencies among many game objects. All the calibration files, ‘RATCalibrationData’ and ‘RATSceneSetup’ is linked to an empty game object and Build RoomAlive Scene button in ‘RATSceneSetup’ script will create a complete scene in that object.
40
6.4 World Coordinate System
As described earlier, the coordinate system of the 3D model is centered at the first Kinect sensor in the ensemble. The first sensor is positioned at (0, 0, 0) and every other object in the scene is translated from the first Kinect sensor. The calibration data provided by the RoomAlive toolkit uses a right-handed coordinate system similar to Kinect sensor, while Unity uses a left-handed coordinate system. Real world positions and the RoomAlive toolkit’s coordinate system are one to one.
6.5 User Tracking
Skeleton data from all the Kinect sensors is transferred to the host computer using Windows Communication Foundation where the main application runs. All the skeletons along with their tracking states are stored in RATKinectSkeleton data container. Each Kinect sensor can track up to six skeletons, for two Kinect sensors that are total of twelve tracked skeleton. RATKinectSkeleton merges the skeletons data from all the sensors making total tracked skeletons up to six. The skeleton data is in the coordinate system of the tracking Kinect sensor. All the skeleton data received by the host computer are assumed to be tracked by the main Kinect sensor. If the skeleton data is detected by the second Kinect sensor, to display the skeleton data in the 3D model, the 3D point needs to be converted into world coordinate system using the localToWorldMatrix. Where the localToWorldMatrix is derived from the pose of the second camera. Each tracked 3D point is multiplied with transform.localToWorldMatrix where the transform is attached to the game object of the respected Kinect camera. Kinect sensor v2 detects 25 joints and all the joint data is transferred to the host computer. In this thesis research even though all the tracked joints are used to display on the user interface, only 21 joints of the tracked
41
person are saved in the CSV file and to do all the data processing. We can also extract the height information of the tracked person to determine whether the person is sitting or standing. The Figure 18 shows the skeleton data overlaid on the 3D model using Gizmos.
Figure 18: Skeleton data overlaid on the 3D model
Gizmos are used to overlay the skeleton data on the 3Dmodel. Gizmos in Unity are used for visual debugging and can only be seen in scene view or by enabling Gizmos in game view. Gizmos contain many static methods to draw different shapes such as a cube, line, mesh, and sphere.
6.6 Recording Data
The application starts recording the skeleton data once ‘Start Recording’ button is clicked. The Figure 19 shows the code iterates through all the joints for every detected skeleton and checks the tracking state of the joint. If the joint is tracking state is tracked,
42
the world coordinates of the joint along with the current timestamp is passed to ‘Save’ method of CSV class which saves the data in CSV file. First 21 joints are saved in the CSV file. Figure 20 shows the CSV log file. The timestamp unit is in millisecond since midnight.
Figure 19: Code for tracking and recording head joint
Figure 20: CSV log file with timestamp and X, Y, Z world coordinate location of the tracked joints
43
6.7 Activity Classification Model
The raw skeleton data along with timestamp is stored in a CSV file. This data is read back and classified into two different categories as follows
• Zones
• Standing/Sitting
The first category classifies the data into two different zones defined in the 3D model. 3D model is created using two cameras, and each zone indicates area viewed by their respected camera. Zone0 is the area monitored by the first Kinect camera, and Zone1 is the area monitored by second Kinect camera in the ensemble. The total area being monitored is segmented into two zones by setting a threshold of X coordinate precisely at the center of both the cameras. The first camera’s X coordinate is 0 and the X coordinate of the second camera represent the horizontal distance between both the cameras. The threshold is set by dividing the X coordinate of the second camera by two as seen in Figure 21.
Figure 21: Code for setting the threshold for Zones
The application also classifies the data depending on whether the tracked human is standing or sitting based on the height of the head joint. The threshold which decides whether the person is sitting or standing is hardcoded in the code based on the room geometry and Kinect sensor placement. The raw data is read back from the CSV file after clicking ‘process data’ button on the UI and stored into ‘CompleteDataList’ List for classification. The code then iterates through all the elements in ‘CompleteDataList’ list,
44
segments the data according to two categories as described earlier and stores the data into respected CSV file and list of each activity. Figure 22 shows five lists, one for storing complete data and other four for activities based on two classifications.
Figure 22: List for each classified activity
The total time spent in each category is calculated and displayed on the user interface. Figure 23 shows the code snippet for total time calculation in the standing category. Total time is calculated by subtracting the current frame time from next frame time and adding it to ‘TotalTimeStanding’ variable. If the time difference between two consecutive frames is greater than 2 seconds, it is discarded.
45
6.8 Graphs
Graphs are used to compare the total time spent in two categories efficiently. Two pie charts are used to compare two categories, one for Zone 0 and Zone 1, and another pie chart for Standing and Sitting. ‘Graphs and Charts’ plugin is used to draw pie charts. Once ‘Graphs and Charts’ plugin is imported as an asset in the project, a pie chart can be easily added to the scene as a game object. Figure 24 shows the code for setting the value of the pie chart. Before setting values, the total time is converted into a percentage and rounded to the nearest value. The Categories for the pie chart is defined in the inspector window.
46
CHAPTER VII
EXPERIMENTAL RESULT
This chapter describes the qualitative results that demonstrate the performance of the system in a highly complex environment with occlusion. In addition, some of the practical scenarios where the dataset created by the system can be used are discussed.
The Figure 25 present the scatter plot of the projected path traveled in world coordinates over a period in the test room as recorded by our application. The origin of the world coordinate system is located at the first Kinect camera in the ensemble. The first Kinect sensor is positioned at 0 on the X-axis in the world coordinate system and the sensor Kinect sensor is positioned at -2.26 on the X-axis in the world coordinate system. The world coordinate system in the tracking application is the same as the coordinate system of Kinect SDK. The scatter plot represents the motion capture over the period of approximately 25 seconds. The second Kinect sensor is directly connected to the host computer where our application runs, and the first Kinect sensor is connected to another computer and sends the skeleton data over the network to the host computer. Due to this networked configuration, the frame rate of the skeleton data of first Kinect sensor is significantly lower than the frame rate of the skeleton data from the second Kinect
47
sensor. The difference in the frame rate between both the sensor can be noticed in the scatter plot as the area covered by the first Kinect sensor consists of less number of markers as compare to the area covered by the second Kinect sensor.
Figure 25: Trajectory of the tracked person in the world coordinate system
The current implementation consisting of tracking, logging and processing the skeleton data, operates at around 12 frames/second. Since the small motion of 60 seconds capture database of 720 examples, a linear search for the corresponding joint position is
48
conducted. For the considerably larger database, clustering would allow for faster processing.
Figure 26: Walking dataset as recorded by the application
Figure 26 shows the dataset of the person walking with respect to time across the room twice as represented by two peaks in the X coordinate position of the joint. The gaps in the dataset denote the time required by the second Kinect sensor to detect the skeleton. By the time the person walking across the room was in the field of view of the second Kinect, he was almost facing his back towards the second camera and got self-occluded. This occlusion problem can be eliminated by using multiple cameras to cover the same area.
The skeleton data recorded by this system can also be used for other applications such as gesture recognition, posture analysis, and gait analysis. Gait analysis can be done using angular kinematics on the skeleton data recorded by the application. This system provides continuous skeleton tracking data over a large area which is required to do a gait analysis on the dataset. Furthermore, machine learning can be applied to gait analysis data for disease identification.
49
CHAPTER VIII CONCLUSION
8.1 Conclusion
Assisted living technology is shifting from care facilities to patient’s home due to low-cost tracking solutions. Multiple inexpensive depth cameras such as Kinect connected over the network can cover every part of the house and provide the patient’s location and behavioral data, enabling better care for the patients.
I have presented a system to track and record the skeleton data of patients in the smart indoor environment. The system consists of multiple calibrated Kinect depth sensor for tracking and localization. The system was able to achieve real-time positioning, path recording and monitoring behavioral information using markerless computer vision tracking. It can detect humans in the dark, invariant to background lighting condition, clothing, and skin color. Finally, the behavioral data is stored in a CSV file and total time spent in each category is calculated and displayed on the user interface in text and graphical form.
50
8.2 Future Work
The classification model is designed to classify the activity of only one person. Future work involves creating a separate data container for every tracked person and storing the classification data of every tracked skeleton separately. Recording frame rate can be improved further by storing multiple frames data at once in CSV file. The behavior of the Kinect skeleton tracker is not always perfect, and hence the abrupt changes in skeleton data need to be filtered. Future work also includes tracking and reidentification of multiple users using weighted bone length and particle filtering. Furthermore, this system is designed to work in a single large area with numerous Kinects and a projector with an overlapping field of view creating an ensemble. For multiple rooms, multiple ensemble should be incorporated in a single application running on the host computer.
51
REFERENCES
[1] S. Wright, Digital Compositing for Film and Video, Focal Press, 2001. [2] J. Micheletti and M. Wurpts, "Applying chroma-keying techniques in a virtual
environment," in Proceedings of AeroSense Helmet and Head-Mounted Display, 2000.
[3] F. v. d. Bergh and V. Lalioti, "Software chroma keying in an immersive virtual environment," South African Computer Journal, no. 24, pp. 155-162, November 1999.
[4] P. L. Rosin and T. Ellis, "Image difference threshold strategies and shadow detection," in Proceedings of British Machine Vision Conference (BMVC), 1995. [5] D. G. Lowe, "Object Recognition from Local Scale-Invariant Features," in
Proceedings of the International Conference on Computer Vision, 1999.
[6] N. Dalal and B. Triggs, "Histograms of oriented gradients for human detection," CVPR, no. 1, pp. 886-893, 2005.
[7] R. E. Schapire, Y. Freund, P. Bartlet and W. S. Lee, "Boosting the margin: A new explanation for the effectiveness of voting methods," The Annals of Statistics, vol. 26, no. 5, pp. 1651-1686, 1998.
[8] S. Avidan, "Ensemble Tracking," in Pattern Analysis and Machine Intelligence, 2010.
[9] P. Viola and . M. J. Jones, "Robust Real-time Object Detection," in Proceedings of Statistical and Computational Theories of Vision Workshop, 2001.
52
[10] P. Viola and M. Jones, "Rapid object detection using a boosted cascade of simple features," in Proceedings of Computer Vision and Pattern Recognition (CVPR), 2001.
[11] S. G. Mallat, "A theory for multiresolution signal decomposition: The wavelet," IEEE Transactions on Pattern Recognition and Machine, vol. 11, no. 7, pp. 674-693, 1989.
[12] R. Lienhart and J. Maydt, "An Extended Set of Haar-like Features for Rapid Object Detection," in Proceedings of International Conference on Image Processing (ICIP), 2002.
[13] "Open Source Computer Vision Library," [Online]. Available: https://opencv.org/. [Accessed 2018].
[14] I. Haritaoglu, D. Harwood and L. S. Davis, "W4: real-time surveillance of people and their activities," IEEE Transactions on Pattern Analysis and Machine
Intelligence, vol. 22, no. 8, pp. 809-830, 2000.
[15] L. Xia, C.-C. Chen and J. K. Aggarwal, "Human detection using depth information by kinect," in Computer Vision and Pattern Recognition Workshops (CVPRW), Colorado Springs, CO, USA, 2011.
[16] A. Papoulis, Probability, Random Variables, and Stochastic Processes, second edition, New York: McGraw-Hill, 1984.
[17] R. E. Kalman, "A New Approach to Linear Filtering and Prediction Problems," Transactions of the ASME – Journal of Basic Engineering, no. 82 (Series D), pp. 35-45, 1960.
![Figure 2: Infrared image of the dot emitted by the Kinect v1 to calculate depth [39]](https://thumb-us.123doks.com/thumbv2/123dok_us/9238925.2808778/26.918.168.808.109.598/figure-infrared-image-dot-emitted-kinect-calculate-depth.webp)