Journal of Education and Practice www.iiste.org ISSN 2222-1735 (Paper) ISSN 2222-288X (Online)
Vol.4, No.19, 2013
Children’s Mathematics Performance and Drawing Activities: A
Constructive Correlation
Evelyn Lovelance Arhin1,2 Mavis Osei (PhD) 2*
1. Kwanwoma Boys Senior High School, Atwima Kwanwoma District PMB, Foase, Ashanti Region, Ghana
2. Department of General Art Studies, Faculty of Art, Kwame Nkrumah University of Science and Technology, UPO 50, Kumasi, Ghana
* E-mail of the corresponding author: [email protected] Abstract
There have been series of concerns raised on the general performance in mathematics in Ghana. This study, a mixed method research, looked into the use of drawings in mathematics teaching in improving 62 pupils’ performance at the Ayigya M/A Primary School A, where performance of pupils in mathematics is low. Observation, interviews, achievement test and pictorial likert scale were used to examine relationships between discovery learning and mathematics performance. Pupil performance was obtained by analysing the continuous assessment cards from the previous year. Pre- and post test assessments were administered to measure improvement in pupil performance. Data analysis revealed that drawing activities significantly improved pupil performance in mathematics. The interventions employed also heightened pupils’ interest in the learning of mathematics. Theory in the literature attests to the fact that the arts are very useful to education by establishing a relationship between thinking and the material with which teachers and their students work. This knowledge can be capitalized by professionals in curriculum research and development.
Keywords: Mathematics, drawing activities, discovery learning, pupil 1. Introduction
The general guiding principle on the delivery of the curriculum in the mathematics’ syllabus and teacher’s handbook in Ghana, encourage the use of investigational methods by the teachers to promote discovery learning. An analysis however, done by experts in the field of mathematics indicates that only few learning/teaching activities that would encourage the use of discovery methods were included in the syllabus (Mereku, 2003). According to Akanmu and Fajemidagba (2013), “…mathematics is not only a language and a subject in itself, but it is also critical in fostering logical and rigorous thinking; as such its influence is immense.”(p82). They also quote Aminu (1990) who maintain that mathematics goes beyond the language of sciences, it is a crucial nutrient for thought, logical reasoning and progress and it as well opens up the mind and gives individuals an assessment of the intellectual abilities.
Akanmu and Fajemidagba further point out that “mathematics is regarded as pillar of almost all the streams in academics given its importance in tertiary education and most careers” (p82), yet there are problems with its teaching as they noted in Fajemidagba’s study (1986) who had earlier identified problems of mathematics learning and the adoption of poor teaching methods by teachers in schools.
On a similar count, pupil attainment in mathematics in Ghana is generally low (Mereku, 2003). Results from the Trends in International Mathematics and Science Study (TIMSS), conducted by the International Association for the Evaluation of Educational Achievement (IEA) of the USA in 2003 and 2007 indicate that grade 8 children show poor mathematics achievement in Ghana. In the international study, Ghana’s eighth graders were ranked 43rd among 44 and 46th among 47 countries that participated in the study in the respective years (Agyei, 2010). Again, it was noted that teachers of mathematics adopt the expository method of teaching that induces rote learning (“chew and pour”). This way students do not necessarily grasp the concepts of mathematics to help them in their everyday lives but learn to pass their exams and forget what they have learnt soon afterwards (Agyei, 2010; Fajemidagba, 1986). They fail to recall the ancient Chinese proverb that “Tell me and I forget. Show me and I remember. Let me do and I understand” (as cited in Adu-Agyem, Enti and Peligah, 2009) Eisner (2004) points out that the arts teach students to act and to judge in the absence of rule, to rely on feel, to pay attention to nuance, to act and appraise the consequences of one’s choices and to revise and then to make other choices. Furthermore, arts integration supports the development of students’ motivations, interests, and pre-service relationships (Mello, 2004). In support of these, Andrea, Nancy & Welch (1995) found that 920 elementary school students in 52 classrooms in Boston, Cambridge and Los Angeles who were given visual and performing arts lessons for three years outscored non-program students, earning significantly higher report card grades in the core subject areas including mathematics.
Hanson (2002) identified at least three primary reasons for the lack of incorporating drawing activities in mathematics teaching. These include the lack of academic value placed on visual art instruction; pressure to
achieve and maintain higher standardized test scores in core curriculum areas; and the lack of identification and use of multiple talents and skills. It is with this backdrop that this article seeks to demonstrate how infusing drawing activities into the teaching of mathematics can improve primary pupils’ understanding of mathematics concepts, hence improving their score.
2. Methodology
Being a mixed method research, the quasi-experimental and action research approaches were adopted to find out how children’s mathematics’ performance could be enhanced using drawing activities. Both primary and secondary data were used for the study. A metaanalysis was made on some studies on integrated curricula, methods of mathematics teaching and learning, multiple intelligences, and teaching and learning theories. These formed the basis for the secondary data. Using purposive and convenience sampling, a public primary school in the Kumasi Metropolis was selected from whom a total of 69 respondents comprising 62 pupils and seven teachers of the school were selected for the in-depth study. It is from this sample the primary data was obtained. The pupils were divided into two groups, namely experimental and control. Pupil performance was obtained by analysing the continuous assessment cards from the previous year. Pre- and post-test assessments were administered to measure improvement in pupil performance.
2.1 Research Design 2.1.1 Observation
To gain insight into how teaching and learning of mathematics was done at the schools, we took on the role of observer-as-participant under non-participant method of observation Before the drawing intervention, it was observed that teachers seldom integrate practical activities to explain mathematics concepts, class participation was low, evaluation exercises were in the form of written quizzes only, pupils worked individually during class exercises, and teachers did not consider the different learning abilities of pupils when teaching.
2.1.2 Likert Scale
To understand the pupils’ reaction or feelings toward the intervention, we used the Pictorial Likert scale. The Pictorial Likert scale uses pictures in place of text in communicating levels of choice, with the most common set of pictures being the smiley face.
2.1.3 Drawing activities
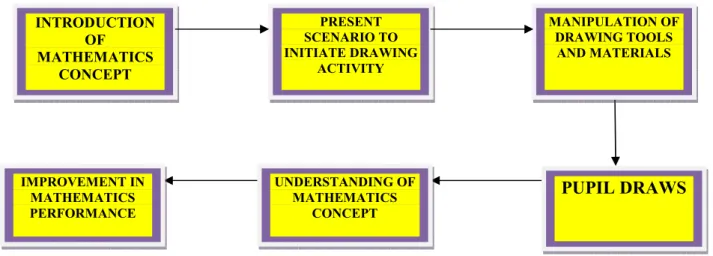
Various drawing activities were used alongside various teaching methods. These drawing activities were based on an adapted version of model of discovery learning as developed by Thomas and Switzer (2001) (Figure 1). The teaching methods included discussing the use of problem questions, manipulation of tools and materials for art, and identifying drawing relationships between mathematics and art. The pupils drew images and coloured them on the drawing sheets.
Figure 1: Adapted Model for Mathematics Teaching and Learning Source: Adapted from (Thomas & Switzer, 2001)
INTRODUCTION OF MATHEMATICS CONCEPT PRESENT SCENARIO TO INITIATE DRAWING ACTIVITY MANIPULATION OF DRAWING TOOLS AND MATERIALS IMPROVEMENT IN MATHEMATICS PERFORMANCE UNDERSTANDING OF MATHEMATICS CONCEPT
PUPIL DRAWS
Journal of Education and Practice ISSN 2222-1735 (Paper) ISSN 2222-288X (Online) Vol.4, No.19, 2013
Table 1. Explanationof Adapted Model for Mathematics Teaching and Learning Element
Introduction of Mathematics Concept Present Scenario to Initiate Drawing Activity Manipulation of Drawing Tools and Materials Pupil Draws
Understanding of Mathematics Concept Improvement in Mathematics Performance 2.1.4 Intervention
The teachers were contacted and informed of the intervention and when it would commence. The teachers were encouraged also to participate in the entire process. Nine weeks were used for the intervention activities for b the control and experimental groups. However, activities from weeks two to eight, and the Pictorial Likert scale activity in week nine were used with the experimental group only. Both the control group and experimental group learnt the same mathematical concepts. Achievement test was also used to measure the performance of the sampled pupils in mathematics before, during and after the intervention.
the experimental and control groups to get an idea of any prior kn
understood the concepts and their performance based on the standard test from Oforikrom sub test lasted 20 minutes for each of the group.
3. Results and Discussions
The intervention activities support t
learning, pupils’ interest in mathematics becomes greater (Ingram & Riedel, 2003; Andrea, Nancy & Welch, 1995). Moreover, the outcome of the drawing intervention activities confirms Go
the arts provide a stage for building self
expressive outlets, and provide a range of learning styles available to children. Also, the intervention results support the claim that arts integration supports the development of students’ motivations and interests (Melo, 2004; Eisner, 2004). Additionally, the submission by Potter (2007) in Adu
the arts offer essential opportunities f confirmed by the intervention activities 3.1 Pre-Test
Figure 2 shows the results of the pre
before the introduction of the drawing intervention to the experimental group.
Figure 2. Comparison of Pre
Except for 0%-20% range where four pupils in both groups showed same performance, those in the experimental group were fairly distributed across the mark range but fewer pupils scored between 81%
group however, there was an exponential increase in pupil performance up to the 61% the same for the 61%-80% and 81%
3.2 Post-Test 0 5 10 15 20 25 30 35 0-20 21 4 4 p u p il s W it h in M a rk R a n g e ( % )
Journal of Education and Practice 288X (Online)
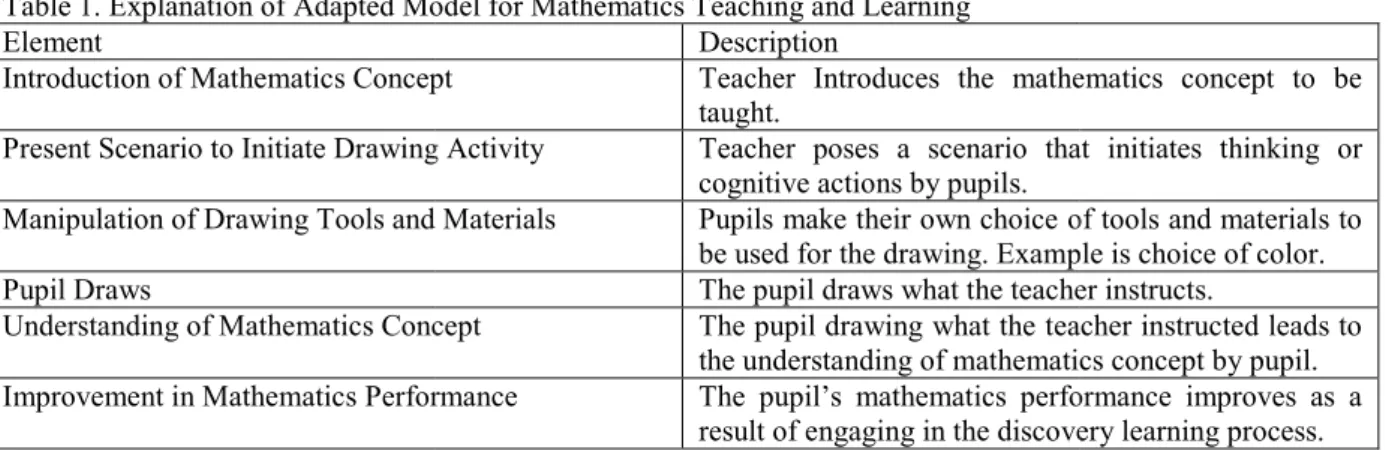
Model for Mathematics Teaching and Learning Description
Introduction of Mathematics Concept Teacher Introduces the mathematics concept to be taught.
Present Scenario to Initiate Drawing Activity Teacher poses a scenario that initiates thinking or cognitive actions by pupils.
Manipulation of Drawing Tools and Materials Pupils make their own choice of tools and materials to be used for the drawing. Example is choice of color. The pupil draws what the teacher instructs.
f Mathematics Concept The pupil drawing what the teacher instructed leads to the understanding of mathematics concept by pupil. Improvement in Mathematics Performance The pupil’s mathematics performance improves as a
result of engaging in the discovery le
The teachers were contacted and informed of the intervention and when it would commence. The teachers were encouraged also to participate in the entire process. Nine weeks were used for the intervention activities for b the control and experimental groups. However, activities from weeks two to eight, and the Pictorial Likert scale activity in week nine were used with the experimental group only. Both the control group and experimental l concepts. Achievement test was also used to measure the performance of the sampled pupils in mathematics before, during and after the intervention.In week one, pre
the experimental and control groups to get an idea of any prior knowledge of mathematics, how much they understood the concepts and their performance based on the standard test from Oforikrom sub
test lasted 20 minutes for each of the group.
The intervention activities support the idea that when drawings are integrated into mathematics teaching and learning, pupils’ interest in mathematics becomes greater (Ingram & Riedel, 2003; Andrea, Nancy & Welch, 1995). Moreover, the outcome of the drawing intervention activities confirms Goldberg’s (1997) conclusion that the arts provide a stage for building self-esteem, encourage collaboration and intergroup harmony, expand expressive outlets, and provide a range of learning styles available to children. Also, the intervention results rt the claim that arts integration supports the development of students’ motivations and interests (Melo, 2004; Eisner, 2004). Additionally, the submission by Potter (2007) in Adu-Agyem, Enti and Peligah (2009) that the arts offer essential opportunities for creative expression, problem solving and social development is confirmed by the intervention activities
Figure 2 shows the results of the pre-test conducted for the control and experimental groups in mathematics he drawing intervention to the experimental group.
Figure 2. Comparison of Pre-test between Control Group and Experimental Group
20% range where four pupils in both groups showed same performance, those in the experimental y distributed across the mark range but fewer pupils scored between 81%
group however, there was an exponential increase in pupil performance up to the 61%-80% range but remained 80% and 81%-100% mark ranges.
21-40 41-60 61-80 81-100 12 20 32 32 25 25 25 21 Mark Range (%) Control Group Experimental Group www.iiste.org
Teacher Introduces the mathematics concept to be Teacher poses a scenario that initiates thinking or Pupils make their own choice of tools and materials to be used for the drawing. Example is choice of color. The pupil draws what the teacher instructs.
The pupil drawing what the teacher instructed leads to the understanding of mathematics concept by pupil. The pupil’s mathematics performance improves as a result of engaging in the discovery learning process. The teachers were contacted and informed of the intervention and when it would commence. The teachers were encouraged also to participate in the entire process. Nine weeks were used for the intervention activities for both the control and experimental groups. However, activities from weeks two to eight, and the Pictorial Likert scale activity in week nine were used with the experimental group only. Both the control group and experimental l concepts. Achievement test was also used to measure the performance of the In week one, pre-test was taken by both owledge of mathematics, how much they understood the concepts and their performance based on the standard test from Oforikrom sub-metro. The
pre-he idea that wpre-hen drawings are integrated into matpre-hematics teaching and learning, pupils’ interest in mathematics becomes greater (Ingram & Riedel, 2003; Andrea, Nancy & Welch, ldberg’s (1997) conclusion that esteem, encourage collaboration and intergroup harmony, expand expressive outlets, and provide a range of learning styles available to children. Also, the intervention results rt the claim that arts integration supports the development of students’ motivations and interests (Melo, Agyem, Enti and Peligah (2009) that or creative expression, problem solving and social development is
test conducted for the control and experimental groups in mathematics
test between Control Group and Experimental Group
20% range where four pupils in both groups showed same performance, those in the experimental y distributed across the mark range but fewer pupils scored between 81%-100%. In the control 80% range but remained Control Group
During the post-test, no drawing intervention was introduced for the control group but for the experimental group there was a drawing intervention.
Figure 3. Comparison of Post
It is seen here that 56%, more than one half of the experimental group scored 81
the control group. The significance of this result is that the drawing intervention actually improved the mathematics performance of the experimental group over the p
drawing intervention during the post
mathematical performance improves after the integration of arts into mathematics teaching. 3.3 Comparison of Pre-test and Post
The comparison between the pre-test and post
test and post-test, no drawing intervention was introduced for the control group.
Figure 4. Pr
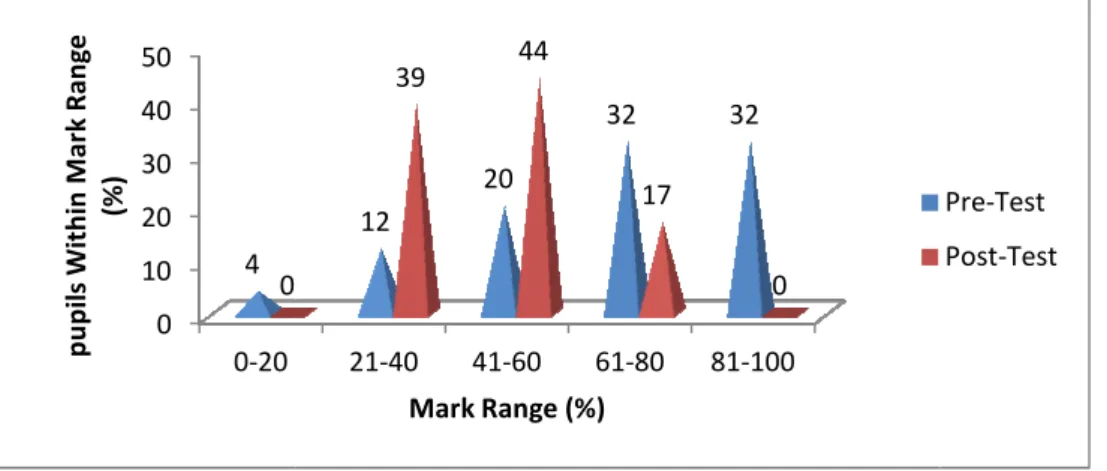
In figure 4, the pupils were fairly distributed across all the mark ranges during the pre
mark range which had 4% of the pupils scoring within that mark range. However, except for the 0
100% mark ranges which none of the pupils attained; the pupils also were fairly distributed across the various mark ranges during the post-test. Since no drawing intervention was introduced, the control group’s performance was not sustained or improved, rather their performance declined. This could suggest that if a drawing intervention was introduced, their mathematical performance could have improved (Eisner &Ecker, 1990; Gunn, 1998).
3.4 Comparing Pretest and Post-test for the Experimental Group There was a comparison made between the pre
This is shown in Figure 5. A drawing intervention was introduced during the post that except for the 0-20% mark range where
distributed across the various mark ranges during the pre within the 81-100% mark range during the post
(1995) that students’ mathematics performance improves after being given lessons in the arts. 0 10 20 30 40 50 60 0-20 21 0 39 4 p u p il s W it h in M a rk R a n g e ( % ) 0 10 20 30 40 50 0-20 4 0 p u p il s W it h in M a rk R a n g e (% )
test, no drawing intervention was introduced for the control group but for the experimental group there was a drawing intervention.
Figure 3. Comparison of Post-test between Control Group and Experimental Group
hat 56%, more than one half of the experimental group scored 81-100% compared to 33% from the control group. The significance of this result is that the drawing intervention actually improved the mathematics performance of the experimental group over the performance of the control group which had no drawing intervention during the post-test. This confirms Ingram & Riedel’s (2003) conclusion that pupils’ mathematical performance improves after the integration of arts into mathematics teaching.
test and Post-test for Control Group
test and post-test for the control group is presented in figure 4. During the pre test, no drawing intervention was introduced for the control group.
Figure 4. Pre-test and Post-test for Control Group
In figure 4, the pupils were fairly distributed across all the mark ranges during the pre-test except for the 0 mark range which had 4% of the pupils scoring within that mark range. However, except for the 0
100% mark ranges which none of the pupils attained; the pupils also were fairly distributed across the various test. Since no drawing intervention was introduced, the control group’s performance ed, rather their performance declined. This could suggest that if a drawing intervention was introduced, their mathematical performance could have improved (Eisner &Ecker, 1990; Gunn,
test for the Experimental Group
ere was a comparison made between the pre-test and post-test of mathematics for the experimental group. This is shown in Figure 5. A drawing intervention was introduced during the post-test phase. It was observed 20% mark range where four percent of the pupils scored, the rest of the pupils were fairly distributed across the various mark ranges during the pre-test. However, more than half of the pupils scored 100% mark range during the post-test. This corroborates the findings of Andrea, Nancy & Welch (1995) that students’ mathematics performance improves after being given lessons in the arts.
21-40 41-60 61-80 81-100 39 44 17 0 0 7 33 56 Mark Range (%) Control Group Experimental Group 21-40 41-60 61-80 81-100 12 20 32 32 39 44 17 0 Mark Range (%)
test, no drawing intervention was introduced for the control group but for the experimental
test between Control Group and Experimental Group
100% compared to 33% from the control group. The significance of this result is that the drawing intervention actually improved the erformance of the control group which had no test. This confirms Ingram & Riedel’s (2003) conclusion that pupils’ mathematical performance improves after the integration of arts into mathematics teaching.
test for the control group is presented in figure 4. During the
pre-test except for the 0-20% mark range which had 4% of the pupils scoring within that mark range. However, except for the 0-20% and 81-100% mark ranges which none of the pupils attained; the pupils also were fairly distributed across the various
test. Since no drawing intervention was introduced, the control group’s performance ed, rather their performance declined. This could suggest that if a drawing intervention was introduced, their mathematical performance could have improved (Eisner &Ecker, 1990; Gunn,
test of mathematics for the experimental group. test phase. It was observed four percent of the pupils scored, the rest of the pupils were fairly test. However, more than half of the pupils scored dings of Andrea, Nancy & Welch (1995) that students’ mathematics performance improves after being given lessons in the arts.
Control Group Experimental Group
Pre-Test Post-Test
Journal of Education and Practice ISSN 2222-1735 (Paper) ISSN 2222-288X (Online) Vol.4, No.19, 2013
Figure 5. Pre 3.5 Correlation Analysis of Pre-test and Post
The relationship between the use of drawings in Mathematics teaching (as measured by the Pre and Post marks for experimental group) and pupils’ academic performance (as measured by the Pre and Post was investigated using Spearman’s rho c
Pearson product moment correlation with more relaxed assumptions). Table 2: Comparing Pre-test and Post
Pre and Post Experimental Group Pre and Post-test marks
**. Correlation is significant at the 0.01 level (2 Source: Fieldwork, 2012
There was a strong, positive correlation between the two variables [ of drawings in Mathematics teaching associated with i
(Potter, 2007; Adu-Agyem, Enti and Peligah, 2009). 3.6 Relationships between the Pre
Descriptive Statistics
Table 3. Pre-test and Post-test of Control Group and Experimental Group Using Descriptive Statistics Pre-test Experimental Group Mean 57.4643 Std. Deviation 23.50805 Minimum 15.00 Maximum 100.00 Source: Fieldwork, 2012
Table 3 presents the mean marks, standard deviations, minimum and maximum marks for the pre test for the experimental and control gro
the experimental group over the mean value of the pre
intervention was in improving the pupils mathematics performance (Andrea 4. Summary of Findings
These are the major findings in this study 0 10 20 30 40 50 60 0-20 4 4 p u p il s W it h in M a rk R a n g e ( % )
Journal of Education and Practice 288X (Online)
Figure 5. Pre-test and Post-test for Experimental Group test and Post-test for Experimental Group
The relationship between the use of drawings in Mathematics teaching (as measured by the Pre and Post marks for experimental group) and pupils’ academic performance (as measured by the Pre and Post
was investigated using Spearman’s rho correlation coefficient (which is a non- parametric alternative to the Pearson product moment correlation with more relaxed assumptions).
test and Post-test for Experimental Group Using Correlation Analysis Pre and Post
test for
Experimental Group Pre and Post-test for
Experimental Group
Correlation Coefficient 1.000
Sig. (2-tailed) .
N 55
test marks Correlation Coefficient .533** Sig. (2-tailed) .000
N 55
**. Correlation is significant at the 0.01 level (2-tailed).
There was a strong, positive correlation between the two variables [r= .533, n=55, p<.0000] with increasing use of drawings in Mathematics teaching associated with improvement in pupils’ performance in Mathematics test
Agyem, Enti and Peligah, 2009).
3.6 Relationships between the Pre-test and Post-test of the Control Group and Experimental Group Using test of Control Group and Experimental Group Using Descriptive Statistics
test Experimental Group Post-test Experimental Group Pre-test Control Group 57.4643 82.9630 65.8400 23.50805 18.56689 23.55080 15.00 20.00 15.00 100.00 100.00 100.00
Table 3 presents the mean marks, standard deviations, minimum and maximum marks for the pre test for the experimental and control groups. There was an increase in the mean value of the post
the experimental group over the mean value of the pre-test (57.46) and this shows how effective the drawing intervention was in improving the pupils mathematics performance (Andrea et al, 1995; Ingram & Riedel, 2003).
These are the major findings in this study
21-40 41-60 61-80 81-100 25 25 25 21 0 7 33 56 Mark Range (%) www.iiste.org
The relationship between the use of drawings in Mathematics teaching (as measured by the Pre and Post-test marks for experimental group) and pupils’ academic performance (as measured by the Pre and Post-test marks) parametric alternative to the test for Experimental Group Using Correlation Analysis
Pre and Post-
test for
xperimental
Pre and Post- test marks .533** .000 55 1.000 . 55
<.0000] with increasing use mprovement in pupils’ performance in Mathematics test test of the Control Group and Experimental Group Using test of Control Group and Experimental Group Using Descriptive Statistics
test Control Post-test Control Group
50.8696 13.45465 30.00 80.00
Table 3 presents the mean marks, standard deviations, minimum and maximum marks for the pre-test and post-ups. There was an increase in the mean value of the post-test (82.96) for
test (57.46) and this shows how effective the drawing et al, 1995; Ingram & Riedel, 2003).
Pre-Test Post-Test
• The drawing activities helped reduced truancy among some pupils.
• They boosted pupil interest in mathematics,
• They helped improved class participation,
• They encouraged collaboration among pupils and built their intergroup harmony.
• There was an increase in the mean value of the post-test (82.96) for the experimental group over the mean value of the pre-test (57.46) and this shows how effective the drawing intervention was in improving the pupils mathematics performance.
• There was a strong, positive correlation between the two variables [r= .533, n=55, p<.0000] with increasing use of drawings in Mathematics teaching associated with improvement in pupils’ performance in Mathematics test
5. Conclusion
Drawing activities engage both teacher and learner, making them recognize the connections between mathematics and the arts, hence the use of drawing activities to explain mathematical concepts can improve the mathematical performance of pupils as well as make the studying of mathematics fun and interesting. (Mello, 2004). It can also be said that given extra time and considerations to multiple intelligences, the below average and average pupils can better their performance in mathematics.
6. Recommendations
To better integrate drawings into mathematics teaching and learning, mathematics teachers should acquaint themselves with the model of mathematics teaching which involves the introduction of mathematics concepts; presentation of scenario to initiate basic drawing activities (including use of matchstick drawings); manipulation of drawing tools and materials; and ensuring that the pupils draw; would enable them help their pupils to understand mathematics concepts and improve in mathematics performance. Although school supplies may not include art materials, they can use chalk, the chalkboard, pebbles, sticks and other objects to initiate such activities.
Also, teachers of arts should collaborate with mathematics teachers to align mathematics concepts to art in order to explain basic and complex concepts to the understanding of primary school pupils as well as to make mathematics learning enjoyable and stress free.
Again, Art Teachers Associations, Policy makers, Non-Governmental Organizations and stakeholders should organize seminars in art education for teachers in order to create awareness about what art education promises. References
Adu-Agyem, J., Enti, M. & Peligah, Y. (2009), Enhancing Children’s Learning: the Art Perspective. International Journal of Education through Art, 5(2,3), 143-155. doi:10.1386/eta.5.2 ,3.143/1
Agyei, D. (2010). Information Communication Technology use in Mathematics. [Online] Available: http//www.slideshare.net/ddagyei/ict-use-in-the-teaching-of mathematics (September 6, 2011)
Akanmu, M. Alex and 1Fajemidagba, M. Olubusuyi (2013), Guided-discovery Learning Strategy and Senior School Students Performance in Mathematics in Ejigbo, Nigeria, Journal of Education and Practice , 4(12), 82-89
Aminu, J. (1990). Address by the Honourable Minister of Education. Abacus 20 (1), 22-29.
Andrea, G., Nancy, C. & Welch, I. (1995), Schools, Communities and the Arts: A Research Compendium. Morrison Institute for Public Education.
Eisner, E. W. (2004), ‘What can Education Learn from the Arts about the practice of Education? International Journal of Education & the Arts, 5(4).[Online] Available http://ijea.asu.edu/v5n4 (September 7, 2011).
Eisner, E. W., & Eckner, D. W. (1970), “Some Historical Developments in Art Education”. In G. Pappas ] (Ed.), Concepts in Art education, Ontario: Macmillan ( pp. 12–25).
Fajemidagba, M. O. (1986). Theoretical basis for curriculum structuring. Its significance and implication for secondary school mathematics curriculum in Nigeria. Journal of Research in Curriculum (JORIC). 4 (2), 12-20.
Goldberg, M. (1997), Arts and Learning: An Integrated Approach to Teaching and Learning in ] Multicultural and Multilingual Settings. White Plains, New York: Longman.
Gunn, A. C. (1998), Visual Art Education in Early Childhood Centers: Teachers’ Beliefs and Practices. ] Canterbury: University of New Zealand.
Hanson, J. (2002), Improving Student Learning in Mathematics and Science through the Integration of Visual Art. Saint Xavier University.
Ingram, D. & Riedel, E. (2003), Integrating Mathematics and the Visual arts. Center for Applied Research and Educational Improvement College of Education and Human Development, University of Minnesota.
Journal of Education and Practice www.iiste.org ISSN 2222-1735 (Paper) ISSN 2222-288X (Online)
Vol.4, No.19, 2013
MacMillan, A., Preston, D., Wolfe J. & Yu, S. (2007), Basic Statistics: Mean, Median, Standard Deviation, Z-Scores, and P-Value. [Online] Available http://www.fourmilab.ch/rpkp/experiments/analysis/z Calc.html. (November 21, 2012).
Mello, R. (2004). When Pedagogy Meets Practice: Combining Arts Integration and Teacher Education in the College Classroom. In J. Russell & R. Murphy, (Eds.) Arts and Learning Research, 20(1),135-161.
Mereku, K. (2003). Methods in Ghanaian Primary Mathematics Textbooks and Teachers’ Classroom Practice. Learning, 23(June), 61-66.
Potter, J. (2007), Draw me a story, dance me a poem: Integrating expressive arts fosters emergent literacy [Online] Availale http://www.wiu.edu/thecenter/articles/draw2.html. (November 21, 2012.)