Walden Dissertations and Doctoral Studies Walden Dissertations and Doctoral Studies Collection
2018
Relationship Between Teachers' Concerns Toward
Data Meetings and Student Achievement
Nelson Brown
Walden University
Follow this and additional works at:https://scholarworks.waldenu.edu/dissertations Part of theEducational Administration and Supervision Commons
This Dissertation is brought to you for free and open access by the Walden Dissertations and Doctoral Studies Collection at ScholarWorks. It has been accepted for inclusion in Walden Dissertations and Doctoral Studies by an authorized administrator of ScholarWorks. For more information, please [email protected].
Walden University
College of Education
This is to certify that the doctoral study by Nelson Brown
has been found to be complete and satisfactory in all respects, and that any and all revisions required by
the review committee have been made. Review Committee
Dr. Markus Berndt, Committee Chairperson, Education Faculty Dr. Irene McAfee, Committee Member, Education Faculty
Dr. Beate Baltes, University Reviewer, Education Faculty
Chief Academic Officer Eric Riedel, Ph.D.
Walden University 2018
Abstract
Relationship Between Teachers’ Concerns Toward Data Meetings and Student
Achievement by Nelson Brown
Dissertation Submitted in Partial Fulfillment of the Requirements for the Degree of
Doctor of Education
Walden University June 2018
Abstract
Schools that employ data-driven instructional techniques and policies also tend to employ data meetings, in which teachers and other stakeholders exchange ideas, form agendas, and otherwise, apply data-derived insights that result in pedagogical action. The problem investigated in this study was that the local district has not yet measured the effectiveness of these data meetings. The purpose of this correlational study was to measure the
relationship between teachers’ concerns about data meetings and students’ performance
in math as measured by the change scores on the Standardized Test for the Assessment of Reading (STAR) test in a North Alabama school. The theoretical framework was Astin's student engagement theory, which hypothesizes that students’ academic improvements are caused by a link between higher levels of teacher concern related to key aspects of pedagogy and student engagement. A linear regression was conducted to measure the relationship between the concerns of 53 teachers regarding data meetings and the change scores of their students on the STAR math test from one year to the next. The results indicated a significant (p < .05) positive correlation between teachers’ concerns about
data meetings and STAR math test scores, with variation in readiness associated with 68% of variation in math scores. Therefore, more attention should be paid to increasing
teachers’ concerns toward data meetings. Doing so can produce positive change for
students who, because of improved math outcomes, will do better in school and in the employment market.
Relationship Between Teachers’ Concerns Toward Data Meetings and Student
Achievement by Nelson Brown
Dissertation Submitted in Partial Fulfillment of the Requirements for the Degree of
Doctor of Education
Walden University June 2018
Dedication
Acknowledgments
I would like to thank all of the faculty with whom I had the pleasure to work with during my study. Each member of my committee provided me with quality feedback and guidance during the process. I would especially like to thank the chairman of my
committee, Dr. Markus Berndt. His gentle yet probing questioning led me to learn a great deal about research.
Thanks to my entire family for their love and encouragement. To my wife, Suzie, for her wisdom, support, and patience. She is the love of my life. To my three wonderful children, Nelson Jr., Kobe, and Branden, who provided me with purpose to persevere through my study. To my parents, Jimmie and Vivian Brown, for their example, sacrifice, and for always believing in me. I would also like to thank my two siblings, Jimmie Jr. and Loretta, for being models of what it takes to achieve a doctoral degree.
Most importantly, I would like to thank my Lord and Savior, Jesus Christ. None of this is even remotely possible without Him. I am thankful for the strength and
resources that He constantly provides. I am also grateful for the timely reminders that I can do all things through Christ who strengthens me.
i
List of Tables ... iii
List of Figures ... iv
Chapter 1: Introduction to the Study ...1
Background ...2
Problem Statement ...2
Purpose of the Study ...3
Research Question and Hypotheses ...4
Theoretical Framework ...4
Nature of the Study ...5
Definitions...5
Assumptions ...6
Scope and Delimitations ...6
Limitations ...7
Significance...7
Summary ...8
Chapter 2: Literature Review ...9
Literature Search Strategy...10
Theoretical Foundation ...10
Literature Review Related to Key Concepts and Variable ...11
Summary and Conclusions ...28
ii
Research Design and Rationale ...30
Methodology ...30
Population ... 30
Sampling and Sampling Procedures ... 31
Archival Data ... 31
Instrumentation and Operationalization of Constructs ... 31
Data Analysis Plan ... 33
Threats to Validity ...38
Ethical Procedures ...38
Summary ...39
Chapter 4: Reflections and Conclusions ...40
Data Collection ...40
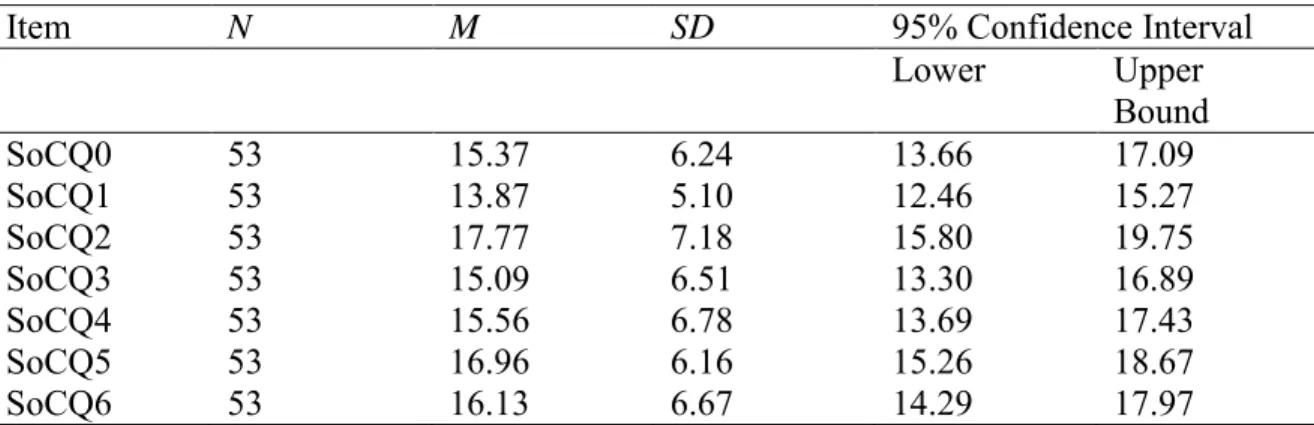
Descriptive Statistics ...41
Inferential Statistics ...43
Summary ...49
Chapter 5: Discussion, Conclusions, and Recommendations ...50
Interpretation of the Findings...50
Limitations of the Study...51
Recommendations ...52
Implications...53
Conclusion ...53
iii List of Tables
Table 1. Selected Descriptive Statistics, SoCQ ………....41
iv List of Figures
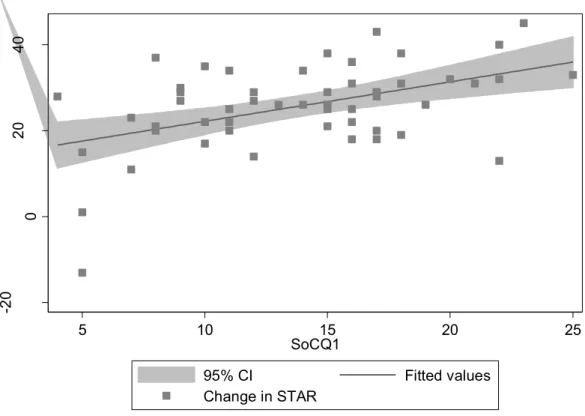
Figure 1. Scatterplot, change in STAR and SoCQ1 score...44
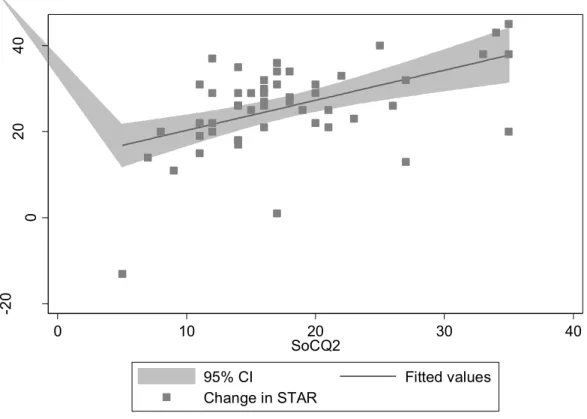
Figure 2. Scatterplot, change in STAR and SoCQ2 score...45
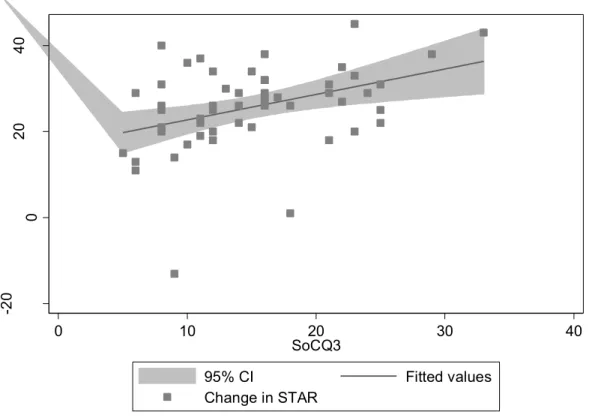
Figure 3. Scatterplot, change in STAR and SoCQ3 score...46
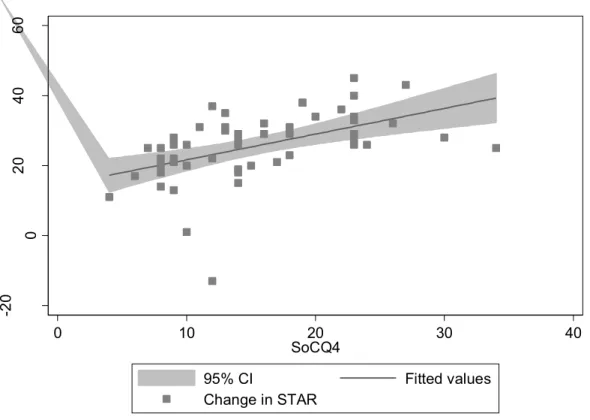
Figure 4. Scatterplot, change in STAR and SoCQ4 score...47
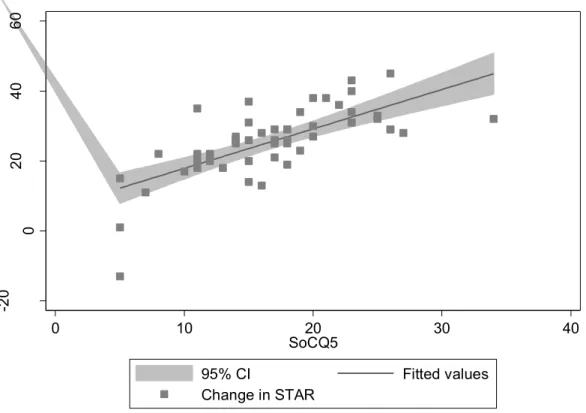
Figure 5. Scatterplot, change in STAR and SoCQ5 score...48
Chapter 1: Introduction to the Study
In the state of Alabama, as in other national and global contexts, data meetings are a means for teachers, administrators, and other school personnel to determine how best to apply findings from data analysis to new pedagogical and curricular practices (Bolhuis, Schildkamp, & Voogt, 2016; Johnson, Severance, Penuel, & Leary, 2016; Robinson, Myran, Strauss, & Reed, 2014). Data meetings are designed to identify strong and weak points in academic practices, typically on the basis of data analysis from past standardized tests (Bohuis et al., 2016). For data meetings to be successful, the individuals who participate in such meetings must be able to understand, feel positively towards, and act upon change directives and other guidance emerging from data meetings (Bolhuis et al., 2016).
In Alabama, data meetings are particularly relevant in the context of reading and
mathematics improvement (Atkinson, 2015). The Every Student Succeeds Act (ESSA) demands high levels of reading and mathematics performance from students. Alabama educators obtain substantial data from standardized test results which are the foundation of data meetings designed to guide pedagogical and curricular changes, which in turn are designed to improve students’ performance on standardized tests (Atkinson, 2015). To understand data meetings’
potential to improve student performance, it is necessary to understand the extent to which stakeholders who participate in such meetings can understand, feel positively towards, and act upon change management directives emerging from data meetings (Bolhuis et al., 2016; Johnson et al., 2016; Robinson et al., 2014). However, there is no existing organizational or academic research that addresses the way stakeholders from Alabama react to data meetings. The
following sections of this chapter concentrate on the literature about data meeting participants’
that presents reasons to answer questions pertaining to the extent to which data meeting
participants understand, feel positively towards, and act upon change management that emerges from data meetings, as well as the relationship between participants’ responses toward data
meetings and changes in standardized test scores. Background
Data meetings take place when schools wish to apply the results of data analysis to change the pedagogy, curricula, and other aspects of academic practice (Spillane, 2012). Data meetings are commonplace, especially after the passage of the No Child Left Behind law, which tied federal funding of public schools to baseline levels of performance and improvement in standardized testing (Lee & Reeves, 2012). The success of data meetings is tied to how
participants in such meetings think, act, and feel (Bolhuis et al., 2016). Specifically, attendants at data meetings need to understand, feel positively towards, and act upon change management outcomes emerging from data meetings. If, in fact, data meeting participants achieve these objectives, then the hypothesized result is an improvement in the standardized testing results from students (Bolhuis et al., 2016). Data meetings are designed to identify strong and weak points in academic practices, typically on the basis of data analysis from past standardized tests (Crone, Carlson, & Haack, 2016). However, data meetings are only as effective as the sum of actions taken by data meeting participants. It is important to be able to quantify the extent to
which participants’ responses toward data meetings are correlated to changes in standardized test
scores (Spillane, 2012).
Problem Statement
The problem addressed in the study is that data regarding the relationship between
analyzed in the local school district. Using data in instructional decisions can lead to improved student performance (Bolhuis et al., 2016; Johnson et al., 2016; Robinson et al., 2014).
However, policymakers and educational leaders in the state of Alabama cannot arrive at justifiable conclusions about the relationship between teachers’ concerns toward data meetings
and student performance. Thus, school leaders’ absence of knowledge within this local school district related to whether participants’ responses towards data meetings are positively correlated with standardized test performance has important implications for educational practice and policy in Alabama.
Purpose of the Study
The purpose of this correlational study is to measure the relationship between teachers’
concerns towards data meetings and changes in student performance in mathematics as measured by the change in test scores on the Standardized Test for the Assessment of Reading (STAR) from 2015-2016 and 2016-2017 in a North Alabama school. The independent variable of the study is teachers’ concerns about data meetings as reflected in the Stages of Concern
Questionnaire (SoCQ). The stages in SoCQ are as follows:
Unconcerned: The teacher has little concern or involvement with data meetings.
Informational: There is a general awareness and interest in learning more about data meetings.
Personal: The teacher is uncertain about the demands of data meetings,
Management: A focus on processes, tasks, and management of data meetings are most important to this teacher.
Consequence: A teacher’s focus is on how data meetings impact students in immediate sphere of influence.
Collaboration: The teacher is interested in coordinating and cooperating with others regarding the use of data meetings.
Refocusing: A teacher desires to explore ways to reap universal benefits and make changes to data meetings.
The dependent variable of the study is change in students’ mathematics standardized test
scores on the STAR assessment. Data for the study was collected from a single school within the North Alabama School System (NASS). The data received from both 7th and 8th grades, which are the two grade levels at the school.
Research Question and Hypotheses
RQ:What is the relationship between teachers’ SoCQscores and students’ change scores
on the STAR math assessment from the 2015-2016 and 2016-2017 school years?
Ho:There is no statistically significant relationship between teachers’ SoCQ scores and
student change scores on the STAR math assessment.
HA:There is a statistically significant relationship between teachers’ SoCQ scores and
student change scores on the STAR math assessment.
Theoretical Framework for the Study
The theoretical foundation of the study is Astin’s student engagement theory, in which the level of teacher engagement correlates positively with the level of student engagement (Astin, 1984). High levels of concern about data meetings represent a type of teacher engagement, specifically as it relates to pedagogy, curriculum design, and classroom
management (Marsh & Farrell, 2015). Therefore, Astin’s theory supports the prediction that higher levels of concern regarding data meetings will correlate with positive change in students’
Nature of the Study
The study is quantitative, correlational, and cross-sectional in nature. The study is quantitative because answering its research questions requires mathematical analysis of objectively defined variables. The study is correlational because its variables preexist and represent naturally present relationships (Keppel, Saufley, & Tokunaga, 1992). The study is cross-sectional because all data were collected at a single point in time. The independent
variable of the study is teachers’ concerns about data meetings as reflected in the SoCQ (George, Hall, & Stiegelbauer, 2006). The dependent variable of the study is change in students’
mathematics standardized test scores on the STAR math assessment. The archival data collected for this study included SoCQ scores from 53 teachers and STAR math test scores from 900 7th and 8th grade students over a 2-year period.
Definitions
Data meetings: Schools and districts are required to make pedagogical decisions based
on data, not opinions. Student achievement data, formative assessment data, and other relevant data are central to planning, professional development, and program improvements. Data are readily available and transmitted in easy-to-understand formats. Teams of teachers have regular face-to-face meetings to analyze student work and other classroom data sources to inform instruction (Gassenheimer, 2013).
Instructional coaching: Teachers are provided with intensive and focused support for
professional learning through dialogue, reflective practice, and feedback to ensure learning is transferred to practice in every classroom (Gassenheimer, 2013).
Professional development: The acquisition of skills and knowledge to help educators
improve student learning, especially in a collective goal-oriented setting (Stock & Duncan, 2010).
Stages of Concern Questionnaire (SoCQ): An assessment that gathers teachers’ concerns about new programs or practices (Hall, Wallace, & Dossett, 1973).
STAR Test: A standardized student assessment program that measures students’ math and
reading achievement. STAR provides information to help teachers tailor instruction, monitor
growth, and improve students’ performance. This computer adaptive test provides accurate math and reading scores for students in grades 1 through 12 (Renaissance Learning, 2012).
Assumptions
Due to the ongoing work and collaboration among teachers, it is assumed that teachers were honest in their responses and took the time to reflect upon the issues from the data meeting even though there is a tendency to provide socially acceptable responses, especially in the
context of one’s own workplace (Creswell, 2015). Therefore, the assumption is that the provided SoCQ scores reflect the teachers’ actual level of concerns.
Scope and Delimitations
This study will gather data solely from the teachers at a North Alabama school. Other schools were not considered because they are not implementing data meetings in the same manner as the local school. This type of study may not be relevant to other schools due to their various goals, designs, and needs. The unique and specific nature of this school’s implementation of data meetings provides the crucial delimitation regarding instructional goals.
Limitations
The variable STAR change score is a student measure, therefore, the SoCQ scores for a teacher are compared with students of their entire class. The subjective element of teacher response may also be a limitation since the study does aim at a quantitative evaluation of teacher and instructional development. However, this limitation is recognized as a necessary feature of this type of investigation (Creswell, 2012). Another limitation of the study is that confounding variables are only partially controlled by using change scores; however, there are many factors that influence student success that are difficult to measure and control in the analysis, such as student home environment, learning ability, and strengths. In relation to student home environment, it is possible that if the student has preoccupations (such as the parents are separating/divorcing, family illness/death, and/or a new sibling), he or she may not perform as well as expected. In relation to student learning ability, the results do not consider if the student receives special help, such as resources or special education. Finally, in relation to student strengths, the study does not consider if a student excels in one subject, yet struggles in another. All of these can influence the STAR test scores, which may influence the overall results of the study.
Significance
Answering the research questions of this study can inform educational leaders and policymakers in Alabama regarding the degree to which data meetings are achieving their intended purpose of facilitating improvements in student performance on standardized mathematics tests. Obtaining this information can assist leaders in determining whether data meetings need to be altered or retained in their current structure and approach. Taking such actions can assist educational leaders and policymakers in achieving the goal of achieving and
maintaining a minimum performance standard among students. Even more, potential positive social change could be an outcome of informing teachers about the importance of embracing the use of student test score data to help their students learn. Doing so can produce positive change for students who, because of improved math outcomes, will have necessary skills to perform better in school and in the employment market.
Summary
The purpose of this correlational study is to measure the relationship between teachers’
concerns towards data meetings and student performance in mathematics as measured by the change in test scores on the STAR from 2015-2016 and 2016-2017 in a North Alabama school. Many initiatives and programs have been implemented in schools across the nation to deal with the lack of student achievement. However, there is no apparent research within this local school district relating the relationship of teachers’ concerns toward the use of test score data via data meetings to increase student achievement. Astin (1984) suggested that higher levels of concerns will correlate with positive changes in students’ STAR scores. Testing this hypothesis is the main objective of the study.
Chapter 2: Literature Review
Before addressing whether data meetings are effective, I will review theoretical and current research in this chapter. This literature review encompasses distinct sections to help facilitate a thorough understanding of key topics and concepts related to the study purpose. More than one type of approach exists for constructing a doctoral level literature review. Thus, early identification of the organization strategy for the literature review is important to provide clarity and focus (Klein & Rozs, 2010; Torraco, 2005). The current study involves a culmination of phenomena related to professional development and school data analysis strategies, mathematics achievement, and instructional coaching practices.
The literature review strategy follows a thematic approach that parallels each of the aforementioned content areas. Teacher attitudes at data meetings and the relationship of those concerns with student achievement is the primary focus of my study. Following discussion of the literature review structure, I review theoretical findings and conceptual frameworks pertinent to the study. I will analyze studies that collectively involve key content areas, but also
incorporate studies that focus on each content area individually. Specifically, research involving data meetings and how schools use these meetings is worthy of analysis, as are studies that focus on mathematics achievement and existing educational practices in schools. Instructional
coaching practices and various models of instructional coaching also exist independently from data meeting strategies and mathematics achievement in the extant literature. Therefore, I examined all three content areas as cohesive and independent phenomena within the literature framework. I conclude with an examination of potential evaluation strategies to retrieve teacher attitudes related to data meetings.
Literature Search Strategy
I conducted a thorough review of available research in books, library databases, and online sources. Primary search terms in the ERIC database were: Data meetings, coaching, math, instruction, and partnering. Although significant amounts of information related to
instructional coaching, not much related to the term instructional partnering. Hence, this literature review does not contain specific research on correlating data meetings with student performance, which directly relates to the problem and question of this study.
Theoretical Foundation
In the context of academic performance, the main claims of student engagement theory are that some autonomous components of academic performance exist, student engagement is one such component, and student engagement can be increased through appropriate changes in pedagogy, curricula, and classroom management (Atkins, 1984). As a theory, student
engagement’s applicability to the current study can be expressed regarding how concerns about
data meetings are or not efficacious in terms of raising student scores. Shernoff,
Csikszentmihalyi, Schneider, and Shernoff (2003) said that students spend more than one-third of their time in school passively attending to information that is presented to the entire class.
More than half of their time is spent on independent work and 14% of students’ time in class is
spent on interactive activities, such as class discussions and group activities (Shernoff et al., 2003). These findings suggest that students are often in a passive state of learning and there are opportunities for engaging learning experiences.
Understood from the perspective of student engagement theory, data meetings are likely to be effective in raising student achievement. Data meetings motivate participants to understand, feel positively toward, and act on change management directives. A participant’s commitment to
changed pedagogical, curricula, and classroom management practices improve student engagement.
Literature Review Related to Key Concepts and Variable Mathematics Achievement and Assessment
Mathematical skills such as number sense, spatial awareness, patterning, and estimation are frequently incorporated and interconnected in daily life (Gersten et al., 2012). Early geometry experiences contribute to higher achievement in mathematics, improvement of writing skills, and increased IQ scores (Weiland & Yoshikawa, 2013). Developing mathematical skills will increase
a student’s confidence level; it also strengthens and helps to construct knowledge (Sarama, Lange, Clements, & Wolfe, 2012). In this sense, mathematics proficiency among students involves not only performance in mathematics, but also in language and literacy (Sarama et al., 2012). This is due to the fact that, for many students, neural links are created between
mathematical strategy and linguistic strategy, because different instructional methods can create different underlying neural pathways to mathematical knowledge, dependent on the student and the instructor (Sarama et al., 2012). Intentional practices should be developed by educators to determine ways to develop neural links between math and other content strategies.
Given these findings, mathematics is a universal cognitive skill set that needs to be developed to stimulate other areas of development, which include language, science, and music (Georgiou, Manolitsis, Zhang, Parrila, & Nurmi, 2013). The relationship between mathematics and other forms of learning can be reciprocal (Cobb & Jackson, 2011; Verdine et al., 2014). The priming of neural networks that process spatial information in the brain is proximal to
mathematics (Verdine et al., 2014). This means that the practice of mathematics and the repetition of mathematics tasks can begin to increase the strength of neural networks that may
also be used in other academic pursuits (Alloway & Passolunghi, 2011; Verdine et al., 2014). Therefore, math practice can have a holistic benefit to a student’s educational performance.
Although the study of mathematics is enhanced by early exposure to its concepts, students are always capable of learning new information because of the brain’s plasticity (Voss, Vivar, Kramer, & van Praag, 2013). Three key school-based factors that can affect student learning of mathematics are instructor quality, collaborative culture, and tracking student learning (Bonner, 2014; Bonner & Adams, 2012). In addition, external factors affect student achievement in mathematics such as socioeconomic factors, education level of parents, and the challenging home lives of some students (Hutto, Kirchhoff, & Abrahamson, 2015; Murayama, Pekrun, Lichtenfeld, & vom Hofe, 2013; Siegler et al., 2012; Tucker-Drob & Harden, 2012). However, there are also internal factors that affect student achievement, such as lack of motivation, cognitive, and metacognitive abilities (Clement, 2016).
Cobb and Jackson (2011) suggested that student achievement in math is affected by the inability of states to respond effectively to the mandates of the curriculum in developing high-quality standards and assessments that address the needs of all students. Assessments that many states have developed are not well aligned with their own standards, and many students are prone to fall behind (Cobb & Jackson, 2011). Furthermore, it is challenging to ensure that sufficient instructors qualify for supporting students with specific educational needs (including math anxiety), which adversely affects schools. Finally, widespread disagreement exists regarding whether traditional assessment, alternative assessment, or both forms of assessment ought to be used (Ashcraft & Moore, 2009; Glynn, 2012; Salvia, Ysseldyke, & Bolt, 2012). Direction and cohesiveness is needed from educators to have a positive effect on student achievement.
Scholars examine mathematics curricula, which are the bases of mathematics assessment, in two ways. One is to consider the content of the curriculum, and the other is to examine the method behind the content. Kaplan and Kaplan (2007) pointed out that mere content has come to outweigh method in math teaching: “It’s as if a teacher of English were to give a phonebook to students who enjoy reading. The action and learning is in the method, or what Kaplan and Kaplan (2007) referred to as steps that make math meaningful, not in the rote list of things that students need to be able to do.
In U.S. math education, the idea that math should be about exploration of concepts rather than practicing problems was defeated in the early 1900s. Dewey (1909) said to “treat laws as logical tools and weapons and their wonderful value becomes self-evident. Otherwise laws are
metaphysical puzzles” (p. 292). With the success and wholesale adoption of Dewey’s philosophy
of education came the birth of the word problem, whose purpose was to help students situate mathematical concepts in the context of everyday life. This happened for a brief time in the 1950s, when the U.S. was frightened that the Soviet space launch would be an indicator of Soviet supremacy in math and science. U.S. schools experimented with the so-called New Math, an attempt to introduce students precisely to those metaphysical puzzles (such as set theory) on which math is built (Herrera & Owens, 2001). Thus, New Math was born out of competition involving the space race.
The New Math was rejected for a number of reasons, with Kline (1973) summing up the
conventional wisdom as follows: “The new mathematics is taught to elementary and high school students who will ultimately enter into the full variety of professions, businesses, technical jobs,
and trades, or become primarily wives and mothers” (p. 56). This was essentially a reassertion of
most elementary school students would not go on to “use” math in the way mathematicians
would, the argument went, the curriculum should prepare them for practical applications. In the early 20th century, a math curriculum could include many materials designed to cover basic space calculation (e.g., how many bales of hay might fit in a barn) because many students were expected to be farmers (Kline, 1973). Today, the notion of practicality has changed, but the impulse to keep math relevant is still prevalent (Bonner, 2014). This search for relevancy is driving schools to seek ways to expose students to math that is relatable in their communities.
Attempts to improve young learners’ academic performance in one subject or another are
useful for multiple reasons. Grassroots studies led by faculty members and school administrators are crucial for enacting change and driving progress in elementary and secondary schools’
performance (Perry, 2014). However, in some cases, school, district, or state-led pilot studies may generate incomplete findings or produce semi-effective results without knowing why the results are lacking in reliability or validity (Oolbekkink-Marchand, van der Steen, & Nijveldt, 2014). Nonetheless, these efforts assist in shedding light on pervasive issues and potential academic improvement strategies worthy of further investigation. If juxtaposed and assimilated into a meaningful framework or information set, metadata and findings from multiple studies can be amalgamated into the collective capacity building that highlights stubborn educational issues (Mincu, 2015). Moreover, cross-analyzing data collected from more than one type of stakeholder group could help uncover perceptual biases or illuminate trends that would otherwise be invisible within the scope of a single study.
Improving student achievement in mathematics involves multiple layers of strategies, thoughts, and processes to be considered (Lai & Hwang, 2016). Continuous efforts to find
positive solutions should be embraced. One approach to improving math achievement is to conduct data meetings as part of school professional development.
Data Meetings
In data meetings, teachers use data to better understand and improve student
performance. According to Hutto et al. (2015), one of the main reasons that data meetings are effective is that they allow teachers to apply tracking and other means of addressing student problems. Tracking is the process whereby students are dividing into categories so that they can be assigned to groups of various kinds of classes (Hutto et al., 2015). In time, students who are identified, through data meetings, as being remedial can become more anxious about their performance (Reeves, 2006). Anxious students can confound assessment, because anxiety interferes with the validity of testing results (Siegler et al., 2012). Thus, student anxiety is a factor that must be considered when viewing data.
Blackwell, Galassi, Galassi, & Watson(1985) documented how data meetings allowed teachers to reach the conclusion that students were more anxious when confronted with a form of mathematics assessment in which they had to list the thoughts related to the test. The same students, when asked to think aloud with reference to the test items, reported less anxiety. One theoretical explanation of this phenomenon is that, when students feel that there is a narrow scope for performance (e.g., identifying a right answer in a multiple-choice test), they lose
self-efficacy if they have any doubt about the answer. On the other hand, based on Blackwell et al.’s
findings, it seems theoretically possible that the kind of open-ended exercises that are typically part of alternative assessments allow students to pursue their own trains of thought and thus present a wider scope for self-efficacy. Thus, self-efficacy is an important theme, because, in numerous data meetings, it has found to be an important predictor of student performance
(Tschannen-Moran & McMaster, 2009). A student’s self-efficacy cannot be ignored when discussing academic performance.
The reason that self-efficacy is so prominent in discussions of data meetings and mathematics performance is the ongoing scholarly controversy regarding the extent to which traditional assessment truly measures mathematics skill (Tschannen-Moran & McMaster, 2009). Bandura (1997) argued that the construct of skill is not as clear-cut as it might appear, because there are cases in which people possess a skill but cannot, usually due to a lack of self-efficacy. Typically, people lack self-efficacy either because (a) they do not believe they are capable of doing something, whether on the basis of previous evidence (e.g., trying and failing) or a negative self-concept (Tschannen-Moran & McMaster, 2009) or (b) they are particularly sensitive to performance-impeding stress (Liew et al., 2014). Therefore, results of a math assessment may not always be an absolute indicator of the skills students possess.
Thus, within the context of data meetings, teachers have found extensive theoretical as well as empirical support for the claim that mathematics testing is not a perfect measure of skill. The validity of mathematical testing is challenged by the fact that, for many people, performance is not actually an accurate measure of skill, because of the confounding effect of psychological variables such as self-efficacy, self-concept, and anxiety (Carmichael et al., 2010; Galla & Wood, 2012; Hoffman, 2010; Tariq et al., 2013; Usher & Pajares, 2009). Based on this
theoretical background, a pertinent question is whether alternative assessment is a more accurate measurement of mathematical skill than traditional assessment. This question is important within the context of data meetings, which are oriented toward generating results and applying changes based on the results of assessment (Bonner, 2014). It is important to ensure the assessment if valid prior to making instructional changes.
Documented findings of data meetings with respect to performance improvement. According to numerous articles on data meetings (Baki, Kosa, & Guven, 2011; Bouck, Satsangi, Doughty, & Courtney, 2014; Carbonneau, Marley, & Selig, 2013; Moyer-Packenham, Salkind, Bolyard, & Suh, 2013; Moyer-Packenham & Suh, 2012; Moyer-Packenham &
Westenskow, 2013), data meetings have allowed teachers to learn the usefulness of
manipulatives as a strategy for helping students learn mathematics. This method helps with explaining the why of the concept (Baki et al., 2011; Carbonneau et al., 2013; Moyer-Packenham & Westenskow, 2013). Engaging students in math exercises with manipulatives increases their mathematical understanding (Bouck et al., 2014; Carbonneau et al., 2013). Teachers also gain
insight into students’ cognitive representations by observing their actions on manipulatives (Baki et al., 2011). Using the manipulatives and having the students talk with peers about a concept enables them to retrieve and retain that knowledge (Baki et al., 2011; Bouck et al., 2014). Manipulatives are thus used as a means of improving performance for all levels of students and
can contribute to providing a cure for students’ anxiety about mathematics (Baki et al., 2011; Bouck et al., 2014; Carbonneau et al., 2013). These findings about manipulatives have arisen from data meetings and therefore provide a specific explanation of how and why data meetings could help teachers to improve student performance in mathematics.
Data meetings have also helped teachers identify how learning within and with social contexts through cooperative learning is another strategy for helping students to improve math performance through a reduction in math anxiety (Daneshamooz & Alamolhodaei, 2012; Kyndt et al., 2013; Nunnery, Chappell, & Arnold, 2013; Zakaria, Solfitri, Daud, & Abidin, 2013). Cooperative learning is the placement of students in small groups so that they can work together to maximize learning by sharing their own knowledge (Daneshamooz & Alamolhodaei, 2012;
Kyndt et al., 2013; Nunnery et al., 2013; Zakaria et al., 2013). Students who work in groups experience three features that enhance their cognitive reorganization of mathematics. First, the group experience forces the students to examine their own beliefs and strategies (Daneshamooz & Alamolhodaei, 2012; Kyndt et al., 2013; Nunnery et al., 2013; Zakaria et al., 2013). Second, the group can collectively use their prior knowledge, skills, and connections to help a student in the group who has a difficult time making a connection or grasping an understanding of the concept (Daneshamooz & Alamolhodaei, 2012; Kyndt et al., 2013; Nunnery et al., 2013; Zakaria et al., 2013). Third, the group experience benefits the student in that it introduces new problem-solving approaches and helps students to participate more fully in learning the topic and its applications (Daneshamooz & Alamolhodaei, 2012; Kyndt et al., 2013; Nunnery et al., 2013; Zakaria et al., 2013). These findings about cooperative learning have arisen from data meetings and therefore provide a specific explanation of how and why data meetings could help teachers to improve student performance in mathematics.
As a whole, students' motivation for learning is often higher in small-groups because it is a comfortable environment where the student can complete a task with others rather than by working individually (Daneshamooz & Alamolhodaei, 2012; Dworkin & Larson, 2006; Kyndt et al., 2013; Nunnery et al., 2013; Zakaria et al., 2013). Students achieve in a cooperative learning environment because they see various stages of mastery of cognitive tasks and receive peer support and assistance (Daneshamooz & Alamolhodaei, 2012; Kyndt et al., 2013; Nunnery et al., 2013; Zakaria et al., 2013). Students working together enjoy the experience and feel accepted by their peers who allow them to believe that they are successful academically (Daneshamooz & Alamolhodaei, 2012; Kyndt et al., 2013; Nunnery et al., 2013; Zakaria et al., 2013). This is a perception that increases their self-esteem over the long term.
Cognitive behavioral techniques have been shown to have a positive impact on
performance anxiety (Galla & Wood, 2012; Green et al., 2012; Tariq et al., 2013). Students who experience a high level of anxiety when they perform certain tasks are more likely to worry about making mistakes and therefore failing at their academic work (Galla & Wood, 2012; Green et al., 2012; Tariq et al., 2013). This may be connected with the fact that instrumental learning situations can create expectancies that some behaviors will lead to specific outcomes (Galla & Wood, 2012; Green et al., 2012; Tariq et al., 2013). By practicing behaviors which balance out the challenges of performance anxiety, a young person can become more resilient, and then reflect upon that resilience in order to balance out the negative thoughts that have dominated their academic performance in the past (Galla & Wood, 2012; Green et al., 2012; Tariq et al., 2013). These practices can be identified and discussed during data meetings.
Data meetings have also allowed teachers to identify other methods of improving student performance. One such finding arising from data meetings is that students are often able to solve performance anxiety problems on their own through emotion-focused and problem-focused coping techniques, linked to learning theory, rather than via the support of an adult leader such as an instructor, linked to cognitive behavioral techniques (Dworkin & Larson, 2006). In some performance anxiety situations, youth were able to focus better on solving their psychological challenges if they set aside the advice of their instructor. As Dworkin and Larson (2006) wrote,
“by confronting an emotion or solving the problem that created the negative experience, youth
sometimes learned a great deal. The experience provided the material for developmental change
and learning” (p. 12). What this means is that the remedy for math anxiety, according to these
authors, is often grounded in experiential learning that leads to personal development. Data meetings allowed teachers to understand the relevance of experiential learning and related
strategies, thus providing a specific explanation of how and why data meetings could help teachers to improve student performance in mathematics.
Reeves and Burt (2006) found that data meetings have a usefulness that goes beyond the measures outlined above. Teachers' workday and responsibilities need restructuring to gain the skills required to become problem solvers. Significant and targeted professional development on data collection and use are necessary for teachers and administrators (Reeves & Burt, 2006). Teachers must move from simply teaching the material and giving a grade, to finding out how much each student has learned and identifying what is necessary to improve students' skill levels (Bianco, 2010). It is then necessary to provide instruction and progress monitoring (Bianco, 2010). Teacher developments in these areas are critical in order to provide students with deeper learning.
There is an understanding that data use is an expectation in schools. However, teachers often lack the professional development associated with reflecting and evaluating assessment results (Young & Kim, 2010). This need is particularly evident among middle and high school teachers (Leithwood & Louis, 2012). To improve data use, Wayman, Jimerson, and Cho (2010) created a project called The Data-Informed District. Educators in the Data-Informed District are characterized by integration and collaboration and are trained at adapting their practices
appropriately by relying on their professional judgment (Wayman et al., 2010). It is important to note that not all efforts that lead to an increase in effective data use are formal in nature.
Informal interactions can be especially critical when it comes to the implementation of new approaches (Spillane, 2012). These observations can lead to school dialogue that provokes improved procedures or strategies. Staff interaction can often result in routines for data use in
practice as well (Spillane, 2012). There is not a scripted process that will benefit all educators in every school setting.
More than a few information sharing and collaboration strategies exist for teachers and administrators to choose from when determining how to implement professional development meetings. Creighton (2007) encourages teachers to approach meetings socially and openly because discussions regarding research findings and data do not have to be excessively
complicated. Be that as it may, teachers have historically expressed concerns about incorporating educational performance data into their classroom strategies, despite being open-minded to the idea (Ingram, Louis, & Schroeder, 2004). Marsh and Farrell (2015) contend that, although nowadays more accountability systems exist to corroborate student learning, teachers remain unaware and lack confidence regarding how to extrapolate meaning from data or act on it. Teachers may perceive the prospect of developing quantitative research and data analysis skills as an undertaking that is too daunting. Likewise, having already completed one or more levels of formal education, teachers may not be as familiar with the professional development of self-guided learning opportunities as a viable methodology for gaining new knowledge., to the contrary, Vygotsky (1934/1987) in his seminal work contends that adult learners are uniquely capable of engaging in cognitive self-regulation processes that allow them to form a linkage between diverse types of subject matter. Adults engaging in self-regulation become
conscientiously aware of their role as both a facilitator and learner. Also, while dually regulating their functions as learner-facilitators, adult learners simultaneously monitor their learning using social queues from other stakeholders in their environment (Gredler, 2009). Thus, in examining the use of data sets and teachers' willingness to become more familiar with data, it becomes necessary to explore how different learning theories apply to human learning processes over their
lifetime (Furtak, Morrison, & Kroog, 2014). This understanding by teachers will allow them to better facilitate the learning of their students.
A thorough understanding of data and how to use it can equip teachers with knowing the academic needs of students. Having this knowledge and skill set can lead to teachers' confidence in making informed decisions regarding instruction practices. A teacher's growth with
developing an understanding of how to best use data can be supported by an appropriate instructional coaching theory (Teemant, 2014). An instructional approach that is grounded in theory will provide a substantive pathway to assist students.
Data Meetings’ Contributions to Instructional Coaching Theory
During the 1980s and 1990s, coaching had limited implementation in schools. Federal Title I funding provided reading specialist to work directly with students that struggled
particularly in the area of reading. The Elementary and Secondary Act of 2000 updated the Title I legislation and placed emphasis on reading materials and instructional practices. The further legislation provided funding for the position of coach (Denton & Hasbrouck, 2009). Hartnett-Edwards (2011) stated that the purpose of literacy coaches is to raise student achievement by increasing teachers' skills.
Teachers are on a variety of levels. High performing teachers believe that learning is not static, and they make adjustments in their classrooms as needed on an annual, monthly, or even daily basis. On the other hand, low performing schools usually have teachers with a high level of teacher-directed activity giving students little opportunity to lead the class in any way (Peabody, 2011). Whether high performing or low performing, teachers need support in the form of an instructional partner or coach. A good reading coach knows a lot of strategies and best practices. However, before sharing plans, a good coach must first establish the trust to meet
the teacher's needs (Hartnett-Edwards, 2011). A study conducted by Coburn and Woulfin
(2012), helped to provide evidence of a link between coaching and change in teachers’ classroom
practice. This study took place over a two-year period with 40 interviews and observations of teachers and reading coaches involved with implementing a new policy called Reading First. This comprehensive initiative was part of the No Child Left Behind legislation and required schools to implement core reading programs, assessments, and professional development based on reading research (U.S. Department of Education, 2002). The Reading First communication or messages were communicated to teachers from a variety of sources: state and district
professional development, state monitors, the textbook, and their principal, among others. Reading coaches were only involved in 28% of the 192 messages that teachers encountered. However, the study found that teachers were more likely to accommodate the Reading First approaches when coaches were involved in presenting or reinforcing the Reading First messages. Coaches not only helped teachers make changes in their practice related to the new policy, but coaches also helped influence teachers' responses to the system.
The coaches provided advice on how to integrate instructional approaches, provided one-on-one assistance with instructional planning, assisted teachers with organizing the reading block, helped teachers rearrange the classroom, and assisted teachers to push past their first, more superficial responses. This allowed teachers to move toward deeper forms of implementation. (Coburn & Woulfin, 2012, p. 18)
Changes in teacher practice are often desirable, but an increase in student learning is the ultimate goal of educators. Atteberry and Bryk (2011) highlight three connections that must take place to link instructional coaching to student learning:
teachers must regularly participate in the professional development provided by the coach the participation must result in desired changes in teacher practice.
Models for training reading coaches have been developed to include a heavy emphasis on building relationships with teachers (Hartnett-Edwards, 2011). In a study conducted by Chester (2012), academic staff completed a two to three-hour training session that introduced the
fundamental principles of peer partnerships. Stage one is the preparation stage, which includes training. This stage also includes the pairing and briefing of partners and is also when attitudes toward and concern of the initiative should be uncovered and resolved. Stage two is where the observation itself takes place. The third stage is feedback and reflection. This includes written and face-to-face feedback. Planning is the fourth stage. During this stage, the participant thinks about the changes that are needed to be made and create a plan to enact those changes. The final stage is action. The plan is implemented, and data is collected to determine the effectiveness of the changes implemented. The staff then engaged in cross-disciplinary peer partnerships to reflect and improve teaching quality. The results from the teachers that completed the survey were very positive with 18 out of 24 answering positively about the confidence within their partner and themselves. There was a high level of agreement that the program provided benefits such as reflection, increasing self-efficacy and building relationships (Chester, 2012). Teachers were particularly motivated to partner with other teachers from the same discipline rather than cross-curricular partnerships (Chester, 2012). Gathering this teacher input is helpful in
developing appropriate instructional coaching strategies.
Denton & Hasbrouck (2009) explains various types of coaching that can take place in schools. Technical coaching is used to coach teachers to gain new instructional strategies and to implement programs with fidelity. Collaborative problem-solving coaching focuses on
equipping teachers with skills to solve problems such as struggling readers or a student's off-task behaviors. Another type of coaching is called reflective practice coaching. This kind of
coaching prompts colleagues to engage in reflective practices after implementing an instructional activity or after reading professional literature. Reflective practice coaching is also known as cognitive coaching. Team-building coaching is when a coach provides support to a team rather than with individual teachers. Teams are developed and supported by a community of learners focusing on common goals (Ke & Im, 2014). Schools can implement one or a combination of coaching methods that will help achieve their goals.
The Partnership Network has elements of each of the coaching mentioned above types. However, Focused Coaching is most closely aligned with the Network. In Student-Focused Coaching, the role of the coach is involved in three primary activities: assisting and supporting the work of teachers, providing professional development services and systematically addressing school-based concerns (Denton & Hasbrouck, 2009). Partnership principles such as teacher voice and choice (Knight, 2011) can be embedded into all three of these activities.
The Instructional Partner (IP) model, which was born out of the Instructional Partnership Network, is of particular importance due to the background of many IPs in this district. Many IPs have experience in literacy coaching. The shift to now working with math and other content area teachers presents a need to tap into existing teacher expertise through partnering. Rather than content specific training, the IP receives training on strategies to help adult learner with transitioning through models such as Kegan’s (1994) evolutionary consciousness theory.
Effective instructional coaching can assist teachers to grow in ways that best meet the needs of students. However, implementing a new program, like other innovations, has some
hurdles (Teemant, Leland, & Berghoff, 2014). One of which is how the implementers perceive the program.
Educational Innovation
It can be difficult to implement an educational innovation (Hall Wallace & Dossett, 1973). Extensive experience indicates that when evidence-based programs are attempted by a new organization, in a new setting, or by the new staff, they are not automatically reproduced or replicated with the quality intended by the program developers (Durlak, 2013). As an example, benefits demonstrated by students receiving programs associated with higher quality
implementation were compared to those participating in programs that were implemented with poorer quality (Durlak, Weissberg, Dymnicki, Taylor, & Schellinger, 2011). The students that received the higher quality implementation showed academic gains that were twice as high as the latter group. The students in the better-implemented programs also showed a reduction in
emotional distress that was more than double the reduction demonstrated by the latter group. Effective implementation can lead to larger gains for youth in several important domains of adjustment (Durlak, 2013). While the initial implementation of an innovation is important, it is also important to continue to assess the effectiveness of the innovation even after it is
implemented.
When implementing a new program, procedure, or initiative in schools, it is important to evaluate its effectiveness especially concerning the people that execute the program (Cooper et al., 2014). The core questions related to implementation research are: "What is happening?" "Is it what is expected or desired?" and "Why is it happening as it is?" The Concerns-Based
Adoption Model (CBAM), born out of the work of Frances Fuller (1969) and later developed by Hall and Hord (1987) provides techniques to help analyze and evaluate a newly implemented
program. CBAM has three primary dimensions – Self, Task, and Impact Stages. Innovation Configurations gives the big picture of what is included in the innovation. This viewpoint helps everyone involved to see what the goals are but at the same time is grouped in such a way that the steps can be taken in manageable increments. The Stages of Concern dimension gathers information related to the concerns of people implementing the innovation (Hall, Wallace, & Dossett, 1973). An originally developed 7-stage, 35-item Concerns Based Adoption Model suggested that educators in the change process would typically fall into one of seven stages of concerns: unconcerned, informational, personal, management, consequence, collaboration, and refocusing. They are called stages because there is usually developmental movement through them where particular concerns may rise and then subside when another concern emerges. Bailey and Palsha (1992) proposed a 5-stage, 35-item model that was found to be a more psychometrically consistent framework for conceptualizing needs. Shotsberger and Crawford (1996) later developed a five stage and 27-item model leading to higher reliability estimates.
The stages individuals progress through as outlined in the CBAM model are similar to the small group stages that teams often go through as pointed out by Bruce Tuckman's research. Tuckman (1965), states that groups progress through the stages of forming – orienting to the task, storming – intragroup conflict, norming – opinions expressed and new roles developed, performing – group energy directed to the task, and adjourning – termination and self-evaluation.
Fullan (2011) stated that the mixture of high expectations, relentless but supportive leadership, good standards, and assessment, investments in capacity building, transparency of results and practice is what produces better results, and better accountability. Furthermore, the concept of policy and strategy levers that has the least and best chance of driving successful reform as drivers (p. 4).
Fullan (2011) pointed out four main wrong drivers along with their matched alternatives: accountability vs. capacity building, individual teacher quality vs. group solutions, technology vs. instruction, and fragmented strategies vs. systemic strategies. Fullan states that in addition to leveraging instructional capacity, purposeful collaboration serves as the most efficient form of lateral accountability. When combined with transparency of results, the structure of educators working together fosters both collective ownership of educational practice and accountability to the public (Han & Newell, 2014). Teachers ability to see these connections will enhance the success of the innovation.
Successful adoption of innovations rests on the teachers' understanding and interpretation of the value of such innovations to facilitate and enhance their students' educational experiences (Avendano, Barrera-Osorio, Nieto-Parra, & Vever, 2016). Complex concerns must be
considered before an innovation spreads to a larger scale. It is critical that educators have the opportunity to communicate and consider various viewpoints which can help resolve any potential concerns (Hall & Hord, 2011). Gathering these concerns in an intentional, structured manner will allow for clarity on specific concerns.
For this study, the SoCQ would best capture the math teachers' concerns as related to data meetings. This questionnaire is part of a well-respected and reliable CBAM tool that has been used with federally sponsored research projects, dissertation research, evaluations, and many change programs (George et al., 2006). Understanding teacher change is an ongoing focus for teacher development which leads to student learning.
Summary and Conclusions
The literature clearly points to many factors that can lead to an increased student
to assisting students to make adequate academic gains. However, there is a gap in research related to gathering teacher attitudes related to data meetings. Data meetings are not as common in secondary school settings, and it is not common practice for teachers to give feedback on the implementation or practice of data meetings. Chapter 3 describes how this study fills the research gap by finding out the concerns of teachers and how those concerns are related to student achievement.
Chapter 3: Research Method
The purpose of this correlational study is to measure the relationship between teachers’
concerns regarding data meetings and students’ performance in mathematics as measured by the
gain scores on the STAR standardized test. The following sections of this chapter will describe the research method in greater detail and include research design and rationale, methodology, archival data, instrumentation and operationalization of constructs, data analysis plan, threats to validity, and ethical procedures.
Research Design and Rationale
The design for this study was correlational. Teachers’ stages of concern (as measured on the SoCQ instrument) and changes in students’ math STAR scores were variables in the
study. The remainder of the chapter offers further details on the implementation of the correlational design.
Methodology Population
The population for the study consisted of 900 students and 53 certified teachers from one school in the local district that participated in the data meetings. Seven are first-year teachers, 14 have been teaching between 2-10 years, 8 have been teaching between 10-15 years, 22 of the teachers have been teaching for more than 15 years, and two are national board-certified teachers with 25 years teaching experience. All of the teachers and students are contained in one school building.
Sampling and Sampling Procedures
The archival data collected for this study included the entire population of 900 7th and 8th grade students who had two consecutive years of designated STAR math test scores from the 2015-2016 and 2016-2017 school years. Originally there were 937 students, however, 37 students were not included in the study because they did not have the test scores over the two-year period. Teacher data were collected from 53 full time 7th and 8th grade core and elective faculty members who attended data meetings in a 2 year period. It is not known if any teachers were absent from a meeting, which might skew results.
An a priori study with linear regression as the chosen procedure was executed in G*Power
software. The standard inputs of a 0.30 effect size, 0.05 Alpha, and 0.80 Power were selected. As there was reason to assume a positive correlation, the level of significance was designated as two-tailed rather than one-tailed. Based on these inputs, G*Power calculated an a priori sample size requirement of N = 53 teachers for a linear regression based on correlation, which is the
number of teachers in the study. Archival Data
School district administrators collect student test score data and conduct the data meetings. Having received Walden University IRB approval #05-26-17-0185955, and school district approval, my access to de-identified data was on a secondary basis. The data meeting, which is a requirement of the school district, is used in this study as a basis to gather the teachers’ responses to the online SoCQ required by the district administration.
Instrumentation and Operationalization of Constructs
District administration collected teachers’ concerns about data meeting innovations with
stages of concern has a range from .64 - .83, indicating that it is sufficiently reliable for other researchers to use. SoCQ provides a way to understand how people develop through the stages of an innovation, and it is a suitable method for addressing the professional development aspect of this study.
The SoCQ has an ordinal scale but the mean is calculated as it is assumed that the intervals between the different ratings are equal (Creswell, 2012). The SoCQ provides a score per stage. The teachers rated each of the 35 items on a scale of 0-7 based upon the descriptors
very true of me now (6-7), somewhat true of me now (3-5), not true of me now (1-2), irrelevant
(0). The use of the score ranges is due to the degree of agreement with a particular descriptor. Scoring for the SoCQ was calculated by district administration. The scoring key partitions items according to the seven stages of concern inherent in the concerns design. Each of the stages of concern has five questions. These stages are as follows: (a) Unconcerned (the teacher has little concern or involvement with data meetings), (b) Informational (there is a general awareness and interest in learning more about data meetings), (c) Personal (the teacher is uncertain about the demands of data meetings), (d) management (a focus on processes, tasks, and management of data meetings that are most important to this teacher), (e) consequence (a teacher’s focus on how
data meetings impact students in immediate sphere of influence), (f) Collaboration (the teacher is interested in coordinating and cooperating with others regarding the use of data meetings), and (g) Refocusing (a teacher desires to explore ways to reap universal benefits and making changes to data meetings) (Southwest Educational Development Laboratory, 2014). Each teacher will have a score on each scale.
The students’ STAR math test scores were also used in the data analysis. STAR is a
standardized test for students in grades 1-12. The reliability by grade range from .78 - .88, with a median of .85 (Renaissance Learning, 2012).
Data Analysis Plan
The research questions and related hypotheses are as follows:
RQ:Is there a statistically significant positive relationship between teachers’ SoCQ
scores and student change scores on the STAR math assessment from the 2015-2016 and 2016-2017 school years?
Ho:There is no statistically significant positive relationship between teachers’ SoCQ
scores and student change scores on the STAR math assessment.
HA: There is a statistically significant positive relationship between teachers’ SoCQ
scores and student change scores on the STAR math assessment.
The questionnaire data from the instrument were organized in an Excel file. The
quantitative data resulting from the questionnaire instrument as well as the STAR data was then input into the Statistical Package for the Social Sciences (SPSS) for analysis. Ordinary least squares regression p value testing was used to test the hypotheses; ordinary least squares
regression is a specific technique for linear regression based on correlation regardless of the number of independent variables (Balnaves & Caputi, 2012). Pearson correlation regression coefficient p value testing was used to test the hypotheses based on the STAR and SoCQ data.
Stage 0. First, descriptive statistics were collected for stage 0 of the SoCQ. Stage 0 consisted of responses to the following statements:
1. I am more concerned about another innovation. 2. I am not concerned about data meetings at this time.
3. I am preoccupied with things other than data meetings. 4. I spend little time thinking about data meetings.
5. Other priorities currently prevent me from focusing my attention on data meetings. Thus, stage 0 was the lowest ranked stage of concern pertinent to data meetings; higher scores on stage 0 indicated teachers who were generally unready for data meetings.
Stage 1. Next, descriptive statistics were collected for stage 1 of the SoCQ. Stage 1 consisted of responses to the following statements:
1. I have a very limited knowledge of data meetings.
2. I would like to discuss the possibility of using data meetings.
3. I would like to know what resources are available if we decide to adopt data meetings.
4. I would like to know what the use of data meetings will require in the immediate future.
5. I would like to know how data meetings is better than what we have now. Thus, stage 1 was the second-lowest ranked stage of concern pertinent to data
meetings; higher scores on stage 1 indicated teachers who were generally unready for data meetings, although at a higher conceptual state of readiness than that represented by stage 0.
Stage 2. Next, descriptive statistics were collected for stage 2 of the SoCQ. Stage 2 consisted of responses to the following statements:
1. I would like to know the effect of reorganization on my professional status. 2. I would like to know who will make the decisions in the new system.
3. I would like to know how my teaching or administration is supposed to change. 4. I would like to have more information on time and energy commitments required by
data meetings.
5. I would like to know how my role will change when I am using data meetings. Thus, stage 2 was the third-lowest ranked stage of concern pertinent to data meetings; higher scores on stage 2 indicated teachers who were generally unready for data meetings, although at a higher conceptual state of readiness than that represented by stages 0 and 1.
Stage 3. Next, descriptive statistics were collected for stage 3 of the SoCQ. Stage 3 consisted of responses to the following statements:
1. I am concerned about not having enough time to organize myself each day. 2. I am concerned about conflict between my interests and my responsibilities. 3. I am concerned about my inability to manage all the data meetings require.
4. I am concerned about time spent working with nonacademic problems related to data meetings.
5. Coordination of tasks and people is taking too much of my time.
Thus, stage 3 was the fourth-lowest ranked stage of concern pertinent to data
meetings; higher scores on stage 3 indicated teachers who were generally unready for data meetings, although at a higher conceptual state of readiness than that represented by stages 0, 1, and 2.
Stage 4. Next, descriptive statistics were collected for stage 4 of the SoCQ. Stage 4 consisted of responses to the following statements:
2. I am concerned about how data meetings affect students. 3. I am concerned about evaluating my impact on students.
4. I would like to excite my students about their part in data meetings. 5. I would like to use feedback from students to change the data meetings.
Stage 4 differed from stages 0-3 in that stage 4 represented a state of readiness more so than a state of unreadiness, albeit not as high a state of readiness as that
represented by stages 5 and 6.
Stage 5. Next, descriptive statistics were collected for stage 5 of the SoCQ. Stage 5 consisted of responses to the following statements:
1. I would like to help other faculty in their use of data meetings.
2. I would like to develop working relationships with both our faculty and outside faculty using data meetings.
3. I would like to familiarize other departments or people with the progress of data meetings.
4. I would like to coordinate my effort with others to maximize the data meetings’
effects.
5. I would like to know what other faculty are doing in this area.
Stage 5 differed from stages 0-3 in that stage 5 represented a state of readiness more so than a state of unreadiness, albeit not as high a state of readiness as that
represented by stage 6, but higher than the state of readiness represented by stage 4. Stage 6. Next, descriptive statistics were collected for stage 6 of the SoCQ. Stage 6 consisted of responses to the following statements: