Worcester Polytechnic Institute
Digital WPI
Interactive Qualifying Projects (All Years) Interactive Qualifying Projects
December 2007
Stock Market Simulation
Chaoran XieWorcester Polytechnic Institute Haiying Liu
Worcester Polytechnic Institute Xiangyu Wang
Worcester Polytechnic Institute
Follow this and additional works at:https://digitalcommons.wpi.edu/iqp-all
This Unrestricted is brought to you for free and open access by the Interactive Qualifying Projects at Digital WPI. It has been accepted for inclusion in Interactive Qualifying Projects (All Years) by an authorized administrator of Digital WPI. For more information, please [email protected]. Repository Citation
Project Number: DZT-0701
STOCK MARKET SIMULATION
An Interactive Qualifying Project Report
Submitted to the faculty
of the
WORCESTER POLYTECHNIC INSTITUTE
In partial fulfillment of the requirements for the
Degree of Bachelor of Science
by
___________________ __________________ _________________
Haiying Liu
Xiangyu Wang
Chaoran Xie
Date: 15 December 2007
Approved:
______________________________
Abstract
The goal of this project was to achieve a basic understanding of the stock market through research and trading simulation. By using proper investment and technical analysis strategies in addition to online simulation tools, investment theories were put into practice. During the simulation, stock trades were made based on different strategies. Results from several trading strategies were compared and contrasted according on their profitability. Effectiveness of each strategy was also discussed.
Acknowledgement
We would like to thank Professor Dalin Tang of Worcester Polytechnic Institute for his guidance to this project. His time, effort, and constant contributions lead to our accomplishing such a comprehensive and challenging project. Also we would like to thanks to our friend Ting Ting for her technical help.
Table of Contents
Abstract………... I Acknowledgement……….. II Table of Contents………... III
Chapter 1: Introduction……… 1
1.1 Objectives…... 1
1.2 Stock Market in General………... 1
1.3 History of Stock Market………... 2
1.4 Major Stock Indices in the USA……….………... 5
1.5 Overall Plan of IQP……….………... 6
Chapter 2: Other Types of Investment……….... 8
2.1 Cash……….………. 8
2.2 Bond……….………. 9
2.3 Mutual Funds……… 11
2.4 Real Estates………... 12
Chapter 3: Investment Strategies………... 13
3.1 Introduction to Investment Strategies……….. 13
3.2 Descriptions of Common Strategies……… 15
Chapter 4: Fundamental Analysis VS. Technical Analysis……….. 22
4.1 Introduction to Fundamental Analysis………. 22
4.2 Problems with Fundamental Analysis………. 23
4.3 Fundamental Analysis Tools and Tactics………..……….. 25
4.5 Problems with Technical Analysis………….………. 29
4.6 Technical Analysis Tools and Tactics……….……… 29
Chapter 5: Portfolio One by Haiying Liu……….. 31
5.1 Types of Companies to Invest……….. 31
5.2 Backgrounds of Selected Companies……….. 32
5.3 Weekly Reports of Actual Trading……….. 39
5.4 Summary………... 47
Chapter 6: Portfolio Two by Xiangyu Wang………... 52
6.1 Types of Companies to Invest………. 52
6.2 Backgrounds of Selected Companies………... 53
6.3 Weekly Reports of Actual Trading……….. 59
6.4 Summary……….. 66
Chapter 7: Portfolio Three by Chaoran Xie………..……… 68
7.1 Types of Companies to Invest………... 68
7.2 Backgrounds of Selected Companies……….. 69
7.3 Weekly Reports of Actual Trading……….. 76
7.4 Summary………... 86
Chapter 8: Effectiveness of Each Strategy……….……… 88
Chapter 9: Conclusion... 93
1
Chapter 1 Introduction
1.1 Objectives
During the 14 weeks of this IQP, we would like to accomplish the following goals. First of all, we will conduct research to gain a deeper understanding of the stock market, such as its history, evolution and how it functions. Secondly, we want to acquire skills in company research because this skill is essential to the success of stock investment. Thirdly, we would like to put all the theories we gather through research into practice by implementing different strategies in actual trading (real time, real price, hypothetic money). This will help us to acquire in depth understanding of each trading strategy and the conditions/assumptions in which each strategy is most helpful. Fourthly, we would like to acquire skill in making immediate investment decision based on the limited information we get during actual trading. Lastly, in the end of the virtual trading period, we would like to study the effectiveness of each strategy using the experimental results. From the analysis of the result, we would like to gain experience in investing. This would benefit us in the future and improve our chance of finding god jobs in the financial sector.
1.2 Stock Market in General
Stock market is obviously one of the most popular topics for people nowadays, but what is it anyway? It is not always clear what it is referring to. Is the stock market a place? Or is it something different? To many people it is just a totally abstract concept. Many people think of Wall Street and the stock market as the same thing. However, Wall Street is one place where people trade and where the world's largest financial market was
2
born and prospered. The term “stock market” is actually a concept for the mechanism that enables the trading of company stocks, other securities, and derivatives. Commodities are traded in commodities markets, and derivatives are traded in a variety of markets.
The size of the stock market is estimated at about $51 trillion. The world derivatives market has been estimated at about $480 trillion nominal value. The stocks are listed and traded on stock exchanges which are entities specialized in the business. It brings buyers and sellers of stocks together. The stock market in the United States includes the trading on the NYSE, the NASDAQ, the Amex, as well as on the many regional exchanges such as the OTCBB and Pink Sheets. European stock exchanges include the Paris Bourse, the London Stock Exchange and the Deutsche Börse [6].
1.3 The History of the Stock Market
Historian Fernand Braudel suggests that in Cairo in the 11th century Muslim and Jewish merchants had already established all forms of trade association and were knowledgeable of every method of credit and payment, against the belief that these were invented later by Italians. In 12th century France the courratiers de change were concerned with managing and regulating the debts of agricultural communities on behalf of the banks. They might be called the first brokers. In the mid-13th century Venetian bankers began to trade in government securities. In 1351 the Venetian government outlawed spreading rumors intended to lower the price of government funds. During the 14th century Bankers in Pisa, Verona, Genoa and Florence also began trading in
3
government securities. This was only possible since these were independent city states not ruled by a duke instead of a council of influential citizens. The Dutch later started joint stock companies, which let shareholders invest in business ventures and get a share of their profits - or losses. In 1602, the Dutch East India Company, first company to issuing stocks and bonds, did the first shares on the Amsterdam Stock Exchange.
The Amsterdam Stock Exchange is also said to have been the first stock exchange to introduce continuous trade in the early 17th century. The Dutch "pioneered short selling, option trading, debt-equity swaps, merchant banking, unit trusts and other speculative instruments, much as we know them" (Murray Sayle, "Japan Goes Dutch", London Review of Books XXIII.7, April 5, 2001).
Wall Street can trace its name back to 1653. Settlers of Dutch descent, who were always on the lookout from attacks by Native Americans and the British, built a 12 foot stockade fence. It was beyond their wildest guess that this fence would go on to become the center of financial activities in the world. The wall was torn down and a new street was built. The British called it Wall Street. What helped Wall Street rise was the appearance of two great Stock Exchanges, which gave order to the chaotic trading and gave birth to the financial markets as known today.
The founding of the first stock exchange in America was in Philadelphia in 1790. Two years later a group of New York merchants met to discuss how to take command of the securities business. Those 24 men founded what is now known as the New York Stock Exchange. But in early 1817, the merchant group from New York sent a representative to Philadelphia to observe how things were being done. Upon arriving with
4
news about the robust exchange in Philadelphia, the New York Stock and Exchange Board was soon organized formally.
As for the New York Stock Exchange, it has since moved past its humble beginnings to the point where its system now facilitates billions of dollars worth of trades each day. But there was a gradual build up to this status. In the early 1900s massive amounts of money were made on Wall Street. But the boom period could not be sustained indefinitely. And in 1929 there comes the Great Depression.
But the crash of 1929 was just the beginning of sorrows for Wall Street. For while the economy eventually recovered from its catastrophic losses, the market excesses that had factored into the crash in the late 1920s seeped back into the picture. The result was the stock market crash of 1987, which saw the Dow Jones suffer what marketed largest single-day loss in the stock market’s history. Since then, the government and the industry have tried to have influence on place to curtail, if not entirely eliminate, the possibility of such a large-scale crash. The stock markets are now a whole part of the global economy.
The current "stock market" consists of 300,000 computers situated on pro trader's desks. These computers are networked together using sophisticated protocols. This level of information sharing makes pricing an almost exact science. These 300,000 computers are further linked to another 26 million computers worldwide. They are located in banks, small businesses, and large corporations. These computers comprise the banking networks which make computerized transactions possible. Finally, these computers are connected to another 300 million+ computers which connect and disconnect from the
5
financial markets daily. In New York City alone, these transactions amount to over $2.2 trillion dollars daily [6].
1.4 Major Stock Indices in USA
There are many major stock indexes in USA. Each of them represents the performance of a certain number of stocks by indicating the characteristics of its component stocks. All stocks in a market index bear some common features. The trading takes place on the same stock market exchange. They belong to the same industry. They have close market capitalizations [17].
There are some major market indexes in USA today such as Dow Jones Industrial Average (DJIA), NYSE Composite Index, S&P 500 Composite Index, and Nasdaq-100 Index. Below we will give a brief description of each of them [17].
Dow Jones Industrial Average (DJIA)
Created in nineteenth century by Wall Street Journal Editor Dow Jones and Company Co-founder Charles Jones, DJIA is the oldest continuing US market index of 30 “blue chip” stocks of US “industrial” Companies: from financial services firms to computer companies, to retail companies. Different from many other indexes, DJIA is not a “weighted” index [17].
6 NYSE Composite Index
NYSE Composite Index tracks the performance of all common stocks listed in New York Stock Exchange. Among 2000 stocks covered in this index, 1600 are from US corporations. Each stock’s weight in this index is proportional to the stock’s market capitalization, making the Index “capitalization-weighted” [17].
S&P 500 Composite Index
Formally created in 1957, S& P Composite Index is a capitalization-weighted index of 500 large-cap corporations intended to be a representative sample of leading firms in leading industries [17].
Nasdaq-100 Index
As a way for the NASDAQ Stock Market to support enhanced media coverage for itself, The Nasdaq-100 Index began in 1985. Being a “modified capitalization-weighted”, this index was designed to cover 100 largest and most actively traded non-financial domestic and international securities listed on The NASDAQ Stock Market [17].
1.5 Overall Plan of IQP
First of all, we plan to spend two weeks on researching the stock market in general. This would require us to use resources online as well as written materials in the library. After getting the general idea of the stock market, we would select sectors of the market which we found to be most likely to profit during the near future. After we
7
identify the sectors, we would select 15 to 20 companies from various sectors which we will conduct an in depth background research on. These background researches would include studying the companies’ income statements, stock price charts for past year and their recent news. In addition to our own research, we would find out if the companies receive any higher rate or recommendation from any brokerage firm or financial newspaper like Investor's Business Daily. Recent status changes of these companies’ rating would be noted and invest farther before actual investing.
Once the selection of the 15 best companies is accomplished, our team will start the actual online trading. The actual trading would be considered of 3 portfolios for easier monitoring. Each person would be in charge of one portfolio with $100,000 to invest. Each portfolio would initially contain 5 companies to invest in. During each of the 5 weeks, we would have report on the changes in the stock quantity purchased or sold as well as the profitability for each stock in that week. Furthermore, we would make the buying and selling decision each week based on the actually market itself. Group discussion will also be held weekly to report our findings and help each other with their problem.
At the end of the trading period, we would calculate the amount we gain/loss for each of the portfolio and the simulation as whole. More importantly, we would analyze each strategy and decision in detail. By doing so, we hope to find out the effectiveness of each strategy with its pairing company.
8
Chapter 2 Other Types of Investment
From the view of financial concept, investment can also be interpreted as in the act of changing cash into another form in order to increase the principle amount over a period of time. According to the risk, return, and duration of investment, there are other different useful ways in investing besides stock. The following pyramid gives a concrete image of the level of risk and return for different types of investment [11]. If you want to be a knowledgeable investor, you need to be very familiar with those types of investment. After comparing those different types of investments, you will be able to select the one that provides more benefit to you. There are four main other types of investments: Cash, bonds, mutual funds, and Real estate [11].
Figure 2.0.1: Risk Chart [3]
2.1 Cash
Cash investment is at the bottom of the pyramid, which has the least risk and probably the lowest return. It can be represented by several forms, such as bank saving
9
account, money market funds, certificates of deposit (CDs), and etc, and usually earns excess money through interest. Bank saving account usually guaranties the return of full principle and pays some low interest. Certificate of Deposit (CDs) has a specified period (called CD term) during which fund cannot be withdrawn without penalty. CD terms can vary from three months up to twenty years. CDs normally earn higher interest rate compared to bank savings or money market accounts. However, if you withdraw money before the maturity date of a CD, you will receive considerable penalty depending on the conditions of the CD amount. Money market fund pays a little more than a bank saving account, and invests in short-term securities as CDs, commercial paper, and Treasury bills. You may lose money since the money market fund is not FDIC insured. However, the chance is almost zero because the money market fund is relatively safe. Most investors invest in cash because of its liquidity, security and short –term period. Risky is not the main concern for cash investment. Cash positions reduce the risk of the total portfolio for the investors. Cash investment investors often know how much money they can get, and when they can get that money [11].
2.2 Bonds
Technically, a bond is issued by a corporation or the government in a specific period when a regular or fixed rate of interest was paid to the bondholder. It can be said that the corporation or government own you money and promise to pay you back in full with interest when you buy their issued bonds. The fixed interest rate is also called coupon rate. You are guaranteed to receive the interest during the bondholding period. At
10
the end of the period, which is also called the maturity date, the corporation or the government, will repay you the par or face value of the bond, which is the original loan. For example, you buy a bond whose face value is $1000 from AGCO corp. with a 10 percent coupon rate now (11/01/2007), and matures on 11/01/2017. It can be explained this way: you lend AGCO corp. $1000 in a period of 10 years. AGCO corp. will pay you $100 annually per $1000 of face value until the maturity (11/01/2017) under 10 percent coupon rate ($1000*10%=$100). At maturity, $1000 will be repaid to you in cash by AGCO corp [3].
Bond investment is the second level of the pyramid, and has a higher risk and return than cash investment. Because of the promise of the bond issuers and guaranteed interest, bond investment can be considered stable and conservative. However, there still exists some major risks whey you buy the bonds, including credit risk, inflation risk, and rate risk. For example, the corporation may run out of business, and has a difficult to pay you back either interest or original loan. Rising of price could reduce the purchase power of an investment. The bond value could goes down if the market interest rate is higher than the coupon rate, vice versa [11 P20].
Base on the risk level and your investment goal, there are there main types of bonds: Treasuries, municipal bond or munis, and corporate. Treasuries are issued by the U.S. government. They are considered the safest bond investment. Munis are issued by state and local governments and are usually tax-free. Corporate bonds have the most risk but also provide the highest returns [3].
11 2.3 Mutual Funds
Mutual funds have become more popular in the recent years. It is special for those investor, who do not prefer to invest individual cash, stock or bond, or have little time or knowledge to research individual companies. Mutual funds are an ideal investment, which are the combination of cash, stock and bond investment. An investment company creates mutual fund by pooling investor’s money and using it to invest in an assortment of stocks, bonds, or cash. A professional money manager, who manages the mutual fund in an investment objective and styles, can make buying and selling decision for you. Mutual funds can achieve the investors’ portfolio diversification even though the investors have less investment amount. For example, you can buy a mutual fund that invests in stocks, technology, or bonds. There are well over 7000 mutual funds with its own style and strategy, so you need to take your time to choose a mutual fund that can match up your financial goals. Instead of investing all your money in only one stock, mutual funds allow you to buy a slice of hundreds of stocks, thus it reduce the risky and the commission of the specific stock can be divided among all the mutual fund shareholders [11 P22].
Mutual funds are the third level of the pyramid, which has higher risk and return than cash and bond investment. They are not as perfect as you thought. If the overall stock market goes down, the mutual funds also decrease since they contain various stocks. Many mutual funds went down a lot during the recent bear market; however do well in bull markets [11 P24].
12 2.4 Real Estate
Investing in real estate, such as buying your own single-family home, a residential property, or townhouse, has been considered to be the smartest investments. The real estate investors can get extra income from renting the house or the increased value of the house over time. Real estate is considered to be a long-term wealth investment. The main benefit from the real estate is that you can break your tax, and feel wonderful to become a property owner.
Real estate is the fourth level of the pyramid; and has much higher risks than those cash, bond and mutual fund investment. Real estate is inequity, unlike stock or mutual fund, so that you can not sell it immediately. Usually, real estate investors pay mortgage monthly. If they can not afford the payments, the bank will try to take over their property. Due to the decline of economy or some other reasons, the value of property could goes down. You need to spend your time to do some research or ask some experts when you invest in real estate, in order to predict the future value of the selected property [11].
13
Chapter 3 Investment Strategies
3.1 Introduction to Investment StrategyInvestment strategy is a set of rules, behaviors, or procedures used to invest in the market. It is designed not only to guide an investor’s selection of an investment portfolio, but also help an investor make decision of what kind of stock to buy or sell. There are four kinds of risk. First, the outside events, such as war, recession or terrorism can make stock price go down. Second, even if entire stock market goes up, there are some reasons that your stocks can still go down. Third, even if you put the money in the bank instead of investing in the stock market, there is a risk that your money will be worthless because of inflation. Fourth, if you do not invest in the market, there is a risk that you will miss some profit from buying opportunities. Usually the strategy will be designed around the investor’s risk-return tradeoff: some investors will invest in risky assets in order to maximize returns (profit), others will rather to minimize risk regard of less return. However, most investors will select a strategy somewhere in between [11].
Investment strategy involves evaluating a stock by examining the company, especially its operations and its financial condition. There are several evaluation methods, such as factoring in price/earnings ratio, PEG, dividend yields, book value, price/sales ratio, and return on equity. If you have little knowledge about stock market, it is important that you do research before you attend to buy r sell stock. If there is any particular strategy that suits you, you had better do more research before you actually use it. It usually takes a long time for you to make sense of investment strategies, and efficiently use it to increase the value of your portfolio. Since there are many different
14
investment strategies, you are usually not limited to only one. Some investors and traders prefer to apply various strategies while others feel comfortable to use only one. No matter what kind strategies that you use, you still need to pay attention [11].
• An investment strategy is only as good as person using it. It means that you can still lose money no matter how brilliant and ingenious the strategy is.
• Not all the strategies during all market conditions. It means that you’d better match up the strategy and the market condition; do not choose any one without considering the market.
• Don’t be devoted to a strategy if you find that it does not work as you expected. It means that when you lose money for a long time by applying the strategy, you need to give up immediately.
There are two main types of investment: long-term investment and short-term investment. People who are involved in long-term investment are called investors. Investors buy stocks in corporation that they believe in and plan to hold the stocks for the long term (usually a year or longer). Purchasing the stocks as long-term is like purchasing a stake in a company and its future performance. Investors do not care about the day-to-day fluctuations of the stock price, and do not require a deep understanding how the market affects the stock. They can use business perspective to get good returns through research, analysis and patience. People who are involved in short-term investment are called traders. They buy and then sell the stock within five minutes, a few hours, or a few days, or even a month. Traders focus on the price of a stock instead of caring about the
15
future of a corporation. Their goal is to take advantage of the short-term movements in a stock or the market [11].
3.2 Descriptions of Common Strategies
Stock market investing is considered a difficult and risky way to make money, but using some common strategies, investors can reduce the risk and maximize potential profit. These strategies spread around a wide range. Some of which tell investors how to evaluate a company based its background information. Some of which tell investors the best time to invest and what to watch out for during trading. Some of which tell especially under what circumstances should investors sell the stock. The following paragraphs describe some of these strategies which might benefit investors.
Buy and Hold
The investors buy stock in a fundamentally sound company and hold it for the long term (a least a year). The reasons behind the buy and hold strategy are that the investors assume the economy will grow up over the time. The stock price will go up as the company becomes stronger. They usually ignore the day-to-day fluctuation of the stock price, since these will be smoothed out in the long term and the market as a whole will rise. There are some additional benefits. For example, the investors can pay less commission and tax. Also they just need to hold the stock as long as they assume the stock will rise instead of paying too much attention to the market [13].
16 Market Timing
The investors focus on the outlook of the entire market or economic conditions by using different methods, such as technical analysis, fundamental analysis, or even intuition. Market timers believe that they can predict when the market or some certain stocks can rise or fall. They usually buy the stock at the low price and sell it at the high price in order to maximize profit. Market timing seems dangerous since it is possible to over or under valued a stock. Unfortunately, sometimes the movement of stock price does not follow the logically predicted price. The market timer also spends a lot commission since they usually trade frequently, especially on small transition [13].
Growth
The investors prefer to pay attention on the background of the company when they buy the stock. They usually focus on the potential earning growth of the company, such as changes of earning per share every year, revenue growth. By comparing price/earning ratio with earning, the growth investor can get the sense of how much the market is willing to pay for a given rate of earning growth. Growth stocks are risky, since they usually grow from young company, which means growth investors have chance of gaining or losing a lot [13].
Value
The investors always focus on a stock that can be sold at an attractive price which is usually under the book value. It means that the value investors can identify stocks purchased less money than they are worth by measuring a company’s value. They usually tend to look at the traditional valuation metrics such as low PE stocks, low
price-to-cash-17
flow ratio stocks, or low price-book-ratio stocks, which is not found in the growth investment. However, the value investment is not favored by many investors, since discount rates of some stocks are only assumption [13].
GARP
The investors focus on the growth potential company whose stock is undervalued. GARP investment strategy is considered to be the combination of both growth and value investment. It stands for “growth at a reasonable price”. Most investors think that it is difficult to follow GARP strategy, since growth and value strategies have opposite characteristics. That is the reason that most GARP investors look at the price-to-earnings-growth (PEG) ratio [13].
Warren Buffett and Quality
On contrary to some complicated and fancy investing skills, a few investors would more likely to consider a “safe” way of investing: neither cheap and questionable companies nor exceptional and expensive companies: just good companies with good prices.
An outstanding character in stock market, Warren Buffet is referred to be a classic example. Different from people’s normal assumption, he applies simple investment strategies to benefit investors at identifying good values. He just searches for great stocks, then purchases them and holds for years. Such a long term investor like him thinks of his investment not only as sharing the stock but also as buying part of a business. The way Buffet defines the value of a business is to calculate the total net cash flows of the company and discount them by the proper interest rate. His focuses are the return on
18
equity, the operation margins, the debt levels, and the expenditures of capital, by which he identifies the best investments.
To one’s most interest, Buffett Challenges a few classic notions about diversification. He regards it less essential for people who are very confident to find a number of stocks that will extraordinarily outperform the market. For him, it is far more important to identify the good values than investing money across a typical diverse portfolio.
Income
Income investors apply a straight forward strategy: purchasing them with the highest dividends. Their primary focus is to secure a stable income, rather than worrying about the earnings of capital. Obviously, the stocks of large companies normally fall in their preference. As one of the most conservative strategies, yet there are still risks involved in income investing in equities. For many reasons, this strategy is pretty much close to bond investing than stock investing [13].
Dollar Cost Averaging
Dollar cost averaging is fairly good for amateurs which contains regular and fixed amount to certain investment. At each period, people invest the chosen amount and remove any emotion-based motivation in order to react to short-term changes. As any strategy, the dollar cost averaging does not guarantee anything. However, it does make sure consecutive investing and protect from harming their long-term strategy. Since people buy it at a certain range of prices, changes in price are evened and the initial price has a much smaller influence on the future returns when the investment is sold.
19
Consequently, there come significant decreases of the gap between the value of money paid in and the current value. Nevertheless, the speed of the average price does not go fast enough to reduce the possibility of loss or profit. So dollar cost averaging can help prevent a huge negative gap, but it also constraints the potentiality of a positive gap.
As a matter of fact, dollar cost averaging is an ideal skill for conservative investors wishing to get rid of the risk involved timing the price and reacting to short-term results. When the market is underperforming, the dollar cost averaging is both safe and effective due to the acquisition of more shares for the same regular amount. But we should also realize better performance is not guaranteed and that part should not be the target motivation for applying this strategy [13].
DRIPs and DSPs
Direct Stock Purchase (DSP) and Dividend Reinvestment Plan (DRIP) are two methods which investors can increase profit by cutting down the cost toward the commission for the brokerage firms. DSP let buy stock directly from the company without use of a broker. The drawback to DSP is that a fee might be imposed to open a stock purchase account with the company. DRIP on the other hand, let you purchase the first shares through a broker but then the company use the dividend from the shares to reinvest back to the company without using brokers which also save the commission. The drawback for this method is that you don’t have control over when the dividends will be reinvested. Also for both methods, not all companies offer these program but many blue chip companies do [13].
20 Dogs of the DOW
This is a method in which you buy stocks from companies with highest dividend yield. The method is simple because those companies tend to have lower prices than other companies. This means they have potential in increase in price for next year. Also historically, this approach has been successful. For example, “Dogs” of DOW for 2006 such as GE, AT&T and Verizon all have great yield for the year [11].
CANSLIM
CANSLIM is a mixture of fundamental analysis and technical analysis. C stands for current earnings, which stated that we should buy stock with earning growth at least in 20%-25% range. A stands for average earnings which say stock we buy should have average annual earning around 25% for the past five years. N stands for new things which say the company should be in process of developing new service or products. S stands for shares outstanding which stated the company should have less than 30 million shares outstanding so that it has the potential for good growth. L stands for leading stocks which means the company should be the industry leader. I stand for institutional ownership which say the stock should have at least a couple of institutional shareholders. M stands for market conditions which said market should be going upward. CANSLIM method provides general guideline on what kind of company we should invest in [13].
Trailing Stops
Trailing stops is a stop-loss order that investor actively manage by moving up along with the stock price. The idea is that invest set the order to sell at a given percentage drop to minimize farther loss. For example if investor buy a stock at price of
21
$100, and he set a trailing stop at 25%, this means when the price drop to 75 dollars, he need to sell the stock to minimize the loss. But because it’s trailing stop, if the price first increases to $150 then with 25%, the investor will sell the stock once it drop to $112.5(=150*0.75) rather than the previous 75 dollars. The percentage might change depend on the type and trend of the stock, for example if the stock tend to fluctuate significantly every time, then the percentage should be higher [13].
22
Chapter 4 Fundamental Analysis VS Technical Analysis
4.1 Introduction to Fundamental AnalysisFundamental analysis is the study of the underlying data that affect a corporation. Technical analysis on the other hand, is the study of a stock’s price. Fundamental analysis includes looking at a number of factors, including the company’s assets and liabilities, its earnings, the managers who are running thru company, the competition, the kind of business the company is in and the amount of debt it has.
Learning everything you can about the company. An investor should first determine the type of industry to invest based on the current economic of the country. For example during a recession periods, the safe industry would be food, oil and retail because they are recession-proof. While during good times, you should look into industry like technology because they have higher potential.
Once the type of company is found, investors should identify the leading companies. It is because leading companies are stronger, and more profitable than the competitions. A good resource for identify the industry leaders would be the financial newspaper Investor’s Business Daily rates. In the newspaper, a company with score of 90 or higher is considered excellent.
After identify the leading companies, investors should talk to the managers of the companies. Much investors talk to the managers of the company to find out the how the corporation is being run. This gives investor an insight on the company. But due to the unlikeness of general investor meeting the CEO or upper management, as well as the
23
truthfulness of their words, interviewing companies’ manager might not be the best way to find out how a company is working.
Besides talking to the company’s officials, closely watching their activity is another way to get to know how the company is doing. This is because they are more knowledge and have inside information which we don’t have access to. Insider activity can be found in business newspaper as well as government website. A drawback to watching insider’s activity is that the activities were not report immediate, investors often found out about them weeks later.
In addition to above, the most important thing in fundamental analysis is the study of the balance sheet. Balance sheet includes company’s annual report which listed company’s asset as well as its debt. One thing investors need to be careful is that some information there might be misleading purposely [11].
4.2 Fundamental Analysis Tools and Tactics
The first tool is the income statement which record a company’s sale, operating expense, and earnings. This gives a general idea about whether investor should put money into the company. For example, if the sale of the company increases by 15 percent or more each year then the growth investor should invest in this. Also investor should watch out for companies with negative net income because they are losing money that year.
24
Secondly, an important value to look at about a company is the EPS, which is the earning per share. EPS is calculated by dividing a company’s after-tax profit by the company’s outstanding shares. The quarterly or annually EPS of a company could be found on web site such as Yahoo Finance. Also the finance newspaper Investor’s Business Daily also ranks the relative strength of EPS on a scale of 1 to 99, 99 being the best. Stock investor should invest in stock with increase in value of EPS from quarter to quarter and year to year. The drawback to EPS as an indication is that sometime the CEO or the company is not truthful about the actually earning. For example WorldCom restated its earnings by billions of dollars which mislead the investors.
Another indicator is P/E, which is the price to earnings ratio. It tells whether the stock prince given the company’s earning is reasonable. This ratio basically tells the amount of money in dollars you need to invest to get a dollar in the earning. Bargain hunters looking for stocks of high quality companies that are selling at P/E fewer than 15. Example worth noticing is that Warren Buffet buys only company with trailing P/Es of 10 or less. On the other hand growth investors do buy stock with high P/Es because they believe that company’s earnings would improve in the future. This means the P/E would eventually decrease.
P/E stand alone is not the best indicator to see whether a stock is good to buy. So in addition to P/E there is the PEG, price to earnings to growth ratio. PEG takes the P/E a step farther, it takes into account future earning potential of the company. The guideline for PEG is that a stock with a PEG of less than 0.05 is desirable; a stock with a peg
25
between 0.50 and 1 is good. A stock with PEG higher than 1 is not recommended, especially when the PEG is over 2.
Like stated before, CEO of a company may fake earnings to make P/E and PEG not accurate. Because of this, another helpful indicator is P/S, price to sales ratio. It is effective for uncovering revenue. It is good indicator in way that although CEO can play with the earning of the company they cannot play with revenue. P/S compare price with sales revenue. Many value investors will look for stocks with a P/S of less than 1 [11].
4.3 Problem with Fundamental Analysis
The major problem with the fundamental analysis is that investor must rely on the information provided by the company. But this information might not be entirely truthful. One trick a company might do to the income statement is that they might spend or make loans to executives but classifying these as income rather than expense. Investors using fundamental analysis need to have some skill in uncover accounting irregularities in the company, so that they do not be fooled by the company.
The second problem with the fundamental analysis is that company’s future prospects are hard to prove. And it doesn’t take into account the psychological reasons that people drive stock price up. For example, even if the value and the price of a company are going down, investors would sometime blindly hold on to the stock in hope of it bouncing back.
26
Finally, the major problem with fundamental analysis is that it is extremely time consuming. Professional money managers hire teams of analysts to do fundamental research on individual companies. On the other hand, individual investors have to rely on the biased research that is passed down from Wall Street or the Internet [11].
4.4 Technical Analysis
Technical analysis might sound harder to understand or master but some people believed that it is exactly the opposite. That technical analysis is sometime not technical at all. Technical analysis relies on charts and graphs to helped investors determine what stocks to buy or sell. It relies on mechanical tool like indicators and oscillators. Technical analysis is used to forecast the future based on how the stock has reacted in the past. It is the study of the data that affect a company. Short term trader tends to use technical analysis to help them make buying or selling decision.
The major key to technical analysis is the stock chart. The one of the reason looking at the chart is good because it keeps our emotion out of the decision-making process. Also the stock chart for a company is very easy to find online. The basic stock charts include the line chart, bar chart and the candlestick charts.
Line chart is the simplest chart which is a line connecting the closing price of a stock in a period of time.
27
Figure 4.4.1: NGG Line Chart
Bar chart on the other hand gives more information. It uses a bar to represent the range of the stock price in a given day. While in that bar there is two stick extend out while the stick extends to the left represent the opening market price for the stock while the stick extends to the right represent the closing price of the stock in that day.
Figure 4.4.2: WBD Bar Chart
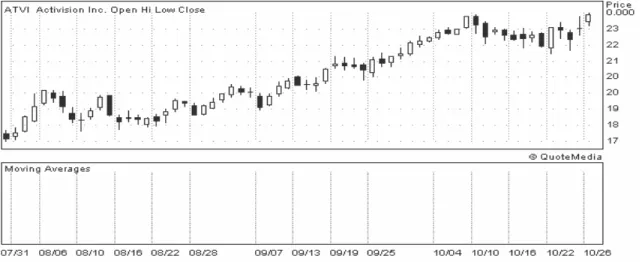
Finally the candlestick chart which was originally developed by a Japanese rice seller. It makes the two sticks in the bar charts into a rectangle. It then color the rectangular in white or black depend on the open and close price of the stock. If the
28
closing price is higher than opening the box is white while if open price is lower than closing price, the box is colored black.
Figure 4.4.3: ATVI Candlestick Chart
There are many patterns and features on the charts. Two of them are the support and resistance. Support is often a barrel given by some outside force such as a large company. It is a price line to which the stock price cannot drop farther. Support is often at an exact value. The use of support can be an indicator for continuous drop in stock price. For example, if a company is in such bad condition, it will try to break the support couple times. But once the support line is broke, the stock is likely to continue dropping. Most investors at that point would sell their stock which contributes to farther drop in price. Resistance on the other hand, is a barrel to which the stock price cannot rise above. Force within the stock market creates this price ceiling to prevent stock price from increasing unreasonably. In conclusion, when company’s stock price increase or decrease significantly, support given by large company helps the buyer while the resistance given by large company helps the seller.
29 4.5 Problem with Technical Analysis
Even though technical analysis is helpful but there are problem to it as well. Some critics of technical analysis said that it is impossible to make predictions about the future based on what happened in the past. But just like the fundamental analysis, technical analysis is as much an art as a science. Investors must try and decide themselves if that technical analysis is helpful or not [11].
4.6 Technical Analysis’s Tools and Tactics
The very first tool on technical analysis is the volume being exchange of the stock in the given day. Amount of volume indicate the liquidness of the stock, the more liquidity of the stock, the easier it is to get into and out of it.
Secondly, technical indicator and oscillators are also used by short term trader to make decision on buying or selling. One of the most valuable technical indicators for investors and traders is the moving average (MA). A moving average is the average price of a stock for a specified period. Many technical analysts use moving averages as support and resistance. If the stock price rises above the company moving average is it a bullish sign. While if the price drop below it is a bearish sign and is a signal to sell. Short term traders tend to use the 40- or 50-day MA to determine support and resistance levels.
In addition to the MA, there is the On-balance Volume (OBV). It is a measure of volume. It is one of the most underutilized but important indicators. It basically measures how much money is flowing into or out of a security. If the OBV line is dropping, it tells
30
you that people are selling. While if it is rising it tells people are buying. OBA is often a method traders use to confirm what is happening with stock. An example would be if a stock is increase while OBV is dropping. This says that stock is temporarily going up but it’s not going to last.
One other indicator is the relative strength indicator (TSI). It is a measure of whether stocks are overbought or oversold. TSI measures the strength or weakness of a stock when it is compared to itself over a specified period. It is an oscillator with an upper and lower band that ranges from 0 to 100 on a vertical scale. Relative strength means that a stock is strong compare to another stock or to an index. For example if NASDAQ is falling while the company is rising, then the company is strong relative to the NASDAQ. Relative weakness is the exact opposite, meaning the company is dropping while the NASDAQ is rising. RSI use in conjunction with other indicator such as OBV is a method to determine whether a stock is oversold or overbought. For example if the stock price is dropping, but RSI rises above 70 and then crosses back down. It is a sign that the stock might reverse direction.
In conclusion, technical analysis is extremely difficult to read the signal correctly. But it is only most helpful in short term decision. What investors need to watch out is the “analysis paralysis”, meaning one spending too much time studying the charts which make the information confusing and could not make trade based on the mixed and complex information from the charts [11].
31
Chapter 5 Portfolio One by Haiying Liu
In this Portfolio, we are going to induce five selected companies, which can be matched up with the market-timing investment strategy. We not only describe the backgrounds of those companies, but also list the individual chosen reason. Weekly trading situations are also stated in this portfolio, including analyzing the weekly stock price, telling the reason why to buy or sell the stocks, and using formulas to calculate the profit during each transaction. At the end of five week simulation, we will give a brief conclusion about how well the market-timing investment strategy applies to those specifically chosen companies.
5.1 Types of Companies to Invest
Based on the growth and value investment strategies, there are five different kinds of sectors are selected: finance, healthcare, service, capital goods, and utilities. Through carefully looking at the companies in each sector by evaluating their balance sheet, cash flows, and income statement according to the fundamental analysis, we choose the following five companies which can typically represent for each sector. Since there is only five-week simulation, we will focus on the short-term investment strategies. Market-timing which is based on the technical analysis will be used most during our trading simulation. I will decide when to buy or sell the stock by reading the stock charts and evaluating the whole stock market situation. We can predict the future growth of the stock price by using the market-timing strategy.
32 5.2 Background of Selected Companies
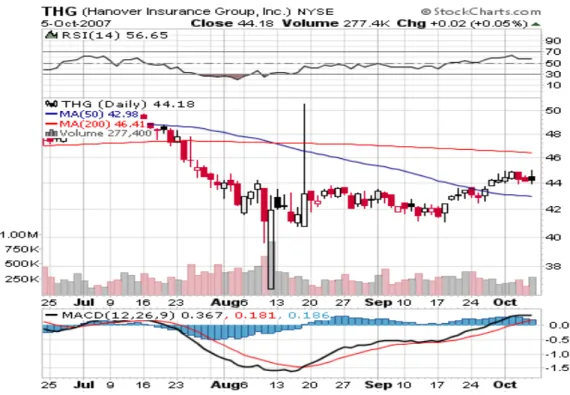
The Hanover Insurance Group, Inc. (Public, NYSE: THG)
As the development of the economy, there are more and more people realize that how important the insurance is. The number of different kinds of insurance is increasing. The Hanover Insurance Group, Inc., through its subsidiaries, provides a range of insurance products and services primarily in the United States. The company primarily offers property and casualty insurance products and services that include personal lines, such as personal automobile, homeowners, and other personal coverage; and commercial lines, including multiple perils, commercial automobile, workers' compensation, and other commercial coverage, such as bonds and inland marine business. It also engages in the business of financing property and casualty insurance premiums to commercial customers; markets management services to institutions, pension funds, and other organizations; and provides traditional life insurance products, group retirement products, as well as owns and operates a guaranteed investment contract business. The following table and chart show the financial information of Hanover insurance group, Inc, such as dividend, P/E ratio, market cap, etc and the changes of the stock price from July to early October. THG has a large value of market cap which is 2.29B, which shows the stable growth of the company and produce good earning. The overall stock is increasing from mid august to now; even it is decreasing from July to mid August. I believe the price of the stock is undervalued, and it will continue to increase [2].
33
Mkt Cap: 2.29B P/E: 11.36 Dividend: 0.3
52 Wk High: 51.00 F P/E: 10.95 Yield: 0.68
52 Wk Low: 36.52 Beta: 0.84 Shares: 51.89M
Ave Vol: 245,000 EPS: 3.89 Inst. Own: 74%
Table 5.2.1: THG Financial Information
Figure 5.2.1: THG Technical Chart
China Medical Technologies, Inc. (public NYSE: CMED)
Technology usually relates to science and engineering, and deals with usage and knowledge of tools and crafts. Developed technology help the society grow up by improving efficiency of human productivity. China Medical Technologies, Inc. has high-tech in R&D manufacturing medical equipment and bio-medical products, and established in 1999, and was awarded ISO 9001 certification in 2001. As of 2006, the
34
company had two main products, the High-Intensity Focused Ultrasound (HIFU) which is used for the non-invasive treatment of solid tumors, and enhanced chemiluminescence which is used for diagnosing and analyzing a variety of diseases and conditions. Even though the clinical application of this technology has almost reached world leading level, it is still developing. The table and chart below indicate that China Medical Technologies has large potentials to grow up. During the 52 weeks, the highest stock price is as twice as the lowest stock price. This show how rapidly the company grows. The company also has high EPS (earning per ratio) compared to other companies in the same industry. 1.11B market cap show the stability of the company growth [2].
Mkt Cap: 1.11B P/E: 27.92 Dividend: 0.4
52 Wk High:44.68 F P/E: N/A Yield: 0.68
52 Wk Low: 21.65 Beta: 1.00 Shares: 27.36M
Ave Vol: 825,000 EPS: 1.46 Inst. Own: 42%
35
Figure 5.2.2: CMED Technial Chart[2]
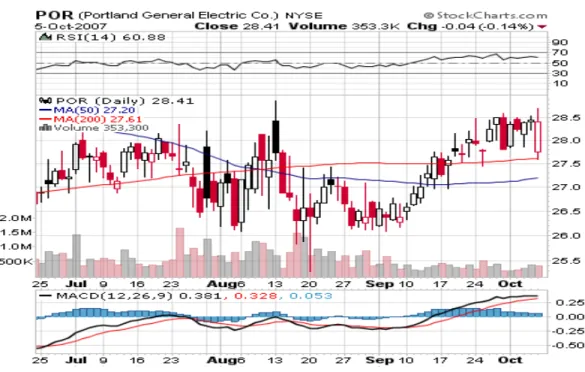
Portland General Electric Company (public NYSE: POR)
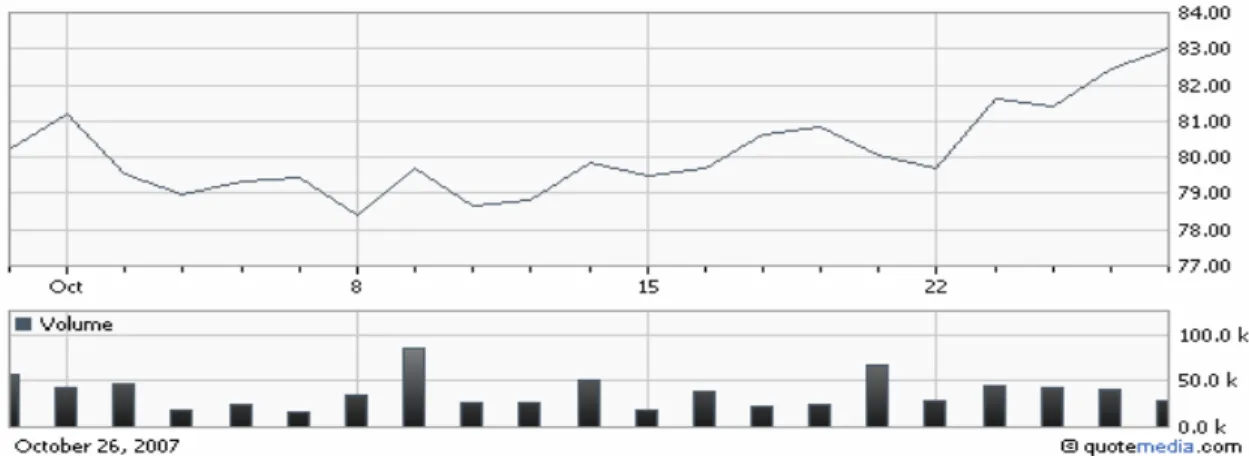
Portland General Electric Company was built in 1930, and located in Portland, Oregon. The company not only provides diverse electric utility service, which engages in the generation, purchase, transmission, distribution, and retail sale of electricity in the state of Oregon, but also sells electricity and natural gas to utilities and power marketers located in the western United States. There is lot retail, commercial and industrial customers buy services from POR. Due to the diverse of service, and there are many contributions to the company. The number of retail customer approximately increased by 60 times during year 2006. This shows that the POR grows very quickly. From the chat below we will see there almost no big fluctuation from July to October. However, the stock price keep increasing since September according to the market timing strategy, we predict that the stock price will continue to rise. The total revenue of the POR increases
36
by 14.5% to $838 million from $732 million for the first six months of last year. The company has a 1.4 price-to-book ratio, while the industry has 1.7 [2].
Mkt Cap: 1.78B P/E: 11.76 Dividend: 0.23
52 Wk High:31.25 F P/E: 15.01 Yield: 3.31
52 Wk Low: 24.87 Beta: 1.00 Shares: 62.52M
Ave Vol: 396,000 EPS: 2.42 Inst. Own: 95%
Table 5.2.3: POR Financial Information
Figure 5.2.3: POR Technial Chart
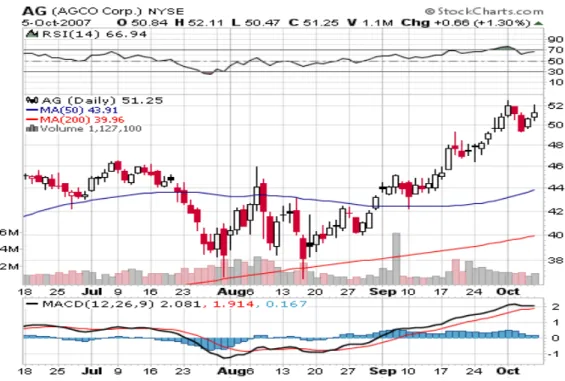
AGCO Corporation (public, NYSE: AG)
AGCO Corporation was founded in April 1991. The attribution to its revenue is manufacturing and distributing agricultural equipment and related replacement parts. AG sells variable products, such as tractors, combines, self-propelled sprayers, hay tools, forage equipment and implements, in addition to a line of diesel engines. The company
37
also provides retail financing to many countries, including United States, Canada, Brazil, Germany, France, the United Kingdom, Australia and Ireland. In September 2007, Industrial Agricola Fortaleza Limitada (SFIL) was bought by AG. The company is getting stronger and stronger, since there are more and more equipment produced every year. In later July, the company revenue increase by 18% from $1.45 billion to $1.71billion in one year period. The earning per share will increase later since it increases by 22 cents in late July compared to the same quarter last year. The highest stock price is twice as much as the lowest stock price. The chat also shows the continuity of increasing of stock price [2].
Mkt Cap: 4.69B P/E: N/A Dividend: N/A
52 Wk High:52.59 F P/E: 18.05 Yield: N/A
52 Wk Low: 22.47 Beta: 1.64 Shares: 91.55M
Ave Vol: 1.34M EPS: -0.42 Inst. Own: 95%
38
Figure 5.2.4: AG Technical Chart
Wal-Mart Stores, Inc. (Public, NYSE:WMT)
Wal-Mart Stores, Inc. was building in 1969, and has various formats of retail stores in the world. There are three segments: Wal-Mart Stores segment, Sam’s Club segment and International segment. Supercenters, Discount Stores and Neighborhood Markets belong to Wal-Mart Stores segment. It provides general merchandise, such as book, shoes, domestics, hardware, and etc. You can buy most stuff in the Wal-Mart stores, and most merchandise price compared to those in other service stores is cheaper. Warehouse membership clubs belong to Sam’s Club segment, offering hardgoods, softgoods, institution-size grocery items and etc. Different kind of retail stores and restaurants belong to the international segment, and operated in different countries. The Wal-Mart Stores has a long history, and stable growth. It almost located everywhere, and most customers prefer to go Wal-Mart. Market timing is an adapted short term strategy to
39
help me make decision when is the profitable to buy or sell stocks. The WMT stock price is pretty low right now and worth to buy, since the chat indicates the stock price will continue to rise [2].
Mkt Cap: 184.58B P/E: 15.20 Dividend: 0.22
52 Wk High:52.15 F P/E: 14.54 Yield: 1.94
52 Wk Low: 42.09 Beta: 0.50 Shares: 4.07B
Ave Vol: 19.77M EPS: 2.99 Inst. Own: 39%
Table 5.2.5: WMT Financial Information
40 5.3 Weekly Reports of Actual trading
Week 1 Report (10/08-10/12)
During each week’s trading, I will calculate the profit every time when selling the stocks based on the formula (both selling and buying commission are $19.99 in this simulation):
Situation 1: do not sell all of the purchased stocks
Profit = (selling price – purchase price)* # of shares sold – commission
Situation 2: sell all of the purchased or the remaining stocks.
Profit = (selling price – purchase price)* # of shares sold – 2*commission We buy all of the stocks at the end of this week, since the stock price seems high at the early week by looking at the line chart. The trend of stock charts of CMED and POR almost remains the same, WMT and AG increases, THG is unspecified. We wait until the end of the week, hoping the stock price can be relatively low. The table below shows the buying situation and the cash balance. We do not spend all of the cash, since we believe some stock price may go down, and then we have cash to invest if the stock price goes down and predict it will go up later.
Buy: Net Cost/Proceeds = purchase price * # of shares + commissions ($19.99) Sell: Net Cost/Proceeds = selling price * # of shares – commissions ($19.99)
41
Date Symbol Buy/Sell Price Shares Net Cost/
Proceeds Profit/ Loss Total Cash Total Profit 100,000 10/12/07 THG Buy 44.75 300 $13,444.99 86,555.01 10/12/07 CMED Buy 41.52 500 $20,779.99 65,775.02 10/12/07 WMT Buy 46.58 500 $23309.99 42,465.03 10/12/07 AG Buy 53.47 500 $26,754.99 15,710.04 10/12/07 POR Buy 27.87 500 $13,954.99 1,755.05
Table 5.3.1: Portfolio Initial Record
Figure 5.3.1: Weekly Stock Price for Five Companies from 10/08 – 10/12 [2]
Week 2 Report (10/15 – 10/19)
On Oct. 15th, we sell 200 CMED shares for $41.75/share. We are afraid that this stock will goes down while it reaches the price of $41.75/share. However, we do not sell all of stocks purchased last week because we are not very sure that the price of CMED will go down definitely. There are still 300 remained in cases the price goes up.
42
All of the stocks keep going down during this whole week especially WMT and POR, so we hold most of them. Since the most companies chosen are either potentially growth or undervalued, the stock value will grow.
Date Symbol Buy/Sell Price Shares Net Cost/
Proceeds Profit/ Loss Total Cash Total Profit
1755.05
10/15/07 CMED Sell $41.75 200 $8330.01 $26.01 10,085.06 26.01
Table 5.3.2: Portfolio Trading History from 10/15 – 10/19
Figure 5.3.2: Weekly Stock Price for Five Companies from 10/15 – 10/19 [2]
Week 3 Report (10/22 – 10/26)
On Oct. 23rd, we buy 100 more AG stock at the price of $51.7, and 50 more WMT stocks at the price of 43.65. At the same day, we sell 100 CMED at the price of 40.50.
Profit: (40.50 – 41.52)* 100 – 19.99= ($121.99).
On Oct. 25th, we sell all of the CMED stocks at the price of $43.22. Profit: (43.22 – 41.52)*200 – 2*19.99 = 300.02.
43
During this week, the trend of POR, AG and CMED increases. The stock prices of THG fluctuate while the WMT stock price keep decrease. I sell all of the CMED since we predict the price will decrease. There is more WMT stock bought because we strongly believe it is undervalued, so it will be worth to buy low value now even though the weekly stock chart may suggest you not to buy. We still hold THG and POR stocks since their price do not seem increase stable.
Date Symbol Buy/
Sell Price Shares Net Cost/ Proceeds Profit/ Loss Total Cash Total Profit
10,085.06 26.01
10/23/07 AG Buy $51.7 100 $5,189.99 4,895.07
10/23/07 CMED Sell $40.50 100 $4,030.01 ($121.99) 8,925.08 (95.98)
10/23/07 WMT Buy $43.65 50 $2,202.49 6,722.59
10/25/07 CMED Sell $43.22 200 $8,624.01 $300.02 15,346.6 204.04
Table 5.3.3: Portfolio Trading History from 10/22 – 10/26
44 Week 4 Report (10/29 – 11/02)
In the early of this week, all of the stocks prices dramatically increase. Especially AG stock increases averagely by 15% for the whole week, and reaches the highest price with $62.95/share on Thursday. However, this situation does not last for a long time. From the stock chat below we can easily figure out that most stocks begin to fall down during later week.
On Oct 30th, we buy 300 shares CMED with $47.48/share. CMED keeps increasing during those two weeks, so we predict the value of the stock will continue to grow at the remaining simulation weeks. Even though the price seems weighted high comparing to previous prices, we still buy 300 shares.
On Oct 31st, we buy 300 shares AG with $59.45/share. The profit calculated as following:
Profit = (59.45 – 53.47)*300 – 19.99 = $1774.01
So that we have more cash to buy other kinds stocks, whose price are lower that AG stock, and have more increasing value.
On Oct 31st, we also buy 200 shares POR with $28.16/share, and 200 shares THG with $46.11/share. POR stock is no only cheap, but also shows rise. THG stock begins to increase since I purchased it, so we strongly believe that the price will not fall down once it starts to rise.
45
Date Symbol Buy
/Sell
Price Shares Net Cost/
Proceeds
Profit/ Loss
Total Cash Total Profit 15,346.6 204.04 10/30/07 CMED Buy $47.48 300 14,263.99 1,082.61 10/31/07 AG Sell $59.45 300 17,815.01 1,774.01 18,897.62 1,978.05 10/31/07 POR Buy $28.16 200 5,651.99 13,245.63 10/31/07 THG Buy $46.11 200 9,241.99 4,003.64 2182.09
Table 5.3.4: Portfolio Trading History from 10/29– 11/02
Figure 5.3.4: Weekly Stock Price for Five Companies from 10/29– 11/02 [2]
Week 5 Report (11/05 – 11/09)
From the stock line, we can see except AG stocks, all of the other four stocks lines lie below the “0%”, which means that those stocks price keep decrease, and do not show any increasing phenomena. Especially CMED stock turns to very bad. Its Price falls down by 10.17% at the end of the week compare to the beginning week
On Nov 6th, we sell 500 shares THG stocks.
46
On Nov 7th, we sell 300 shares CMED stocks, and 500 WMT stocks. . CMED: Profit = (43.94-47.48)*300-2*19.99= ($1101.98) WMT: Profit = (44- 46.58)*500 – 19.99*2= ($1329.98)
On Nov 9th, we sell 300 shares AG stocks, 700 shares POR stocks and 50 shares WMT. AG: Profit = (65.43-51.70)*100+ (65.43-53.47)*200-19.99*4 =3685.04 POR: Profit = (26.81- 28.16)*200+ (26.81-27.87)*500-19.99*4 = ($879.96) WMT: Profit = (43.11-43.65)*50-2*19.99= ($66.98)
Date Symbol Buy
/Sell
Price Shares Net Cost/ Proceeds Profit/ Loss Total Cash Total Profit 4,003.64 2182.09 11/06/07 THG Sell $44.85 500 22405.01 ($222) 26408.65 1960.09 11/07/07 CMED Sell $43.94 300 13162.01 ($1101.98) 39570.66 858.11 11/07/07 WMT Sell $44.00 500 21980.01 ($1329.98) 61550.67 (471.87) 11/09//07 AG Sell $65.43 300 19609.01 $3685.04 81159.68 3213.17 11/09/07 POR Sell $26.81 700 18747.01 ($879.96) 99906.69 2333.31 11/09/07 WMT Sell $43.11 50 2135.51 ($66.98) 102042.2 2042.2
47
Figure 5.3.5: Weekly Stock Price for Five Companies from 11/05– 11/09 [2]
5.4 Summary
Overall the five-week stock simulation, we gain $2042.2 as our profit for those five companies: THG, CMED, AG, POR and WMT. However, individually, we find that only AG is profitable, while all other four stocks lose money. During this simulation stock trading, we found that most of the stock price will go up when the company begin to report their quarterly financial report based on those selected five companies.
48
We did not have many trading transactions for THG stock. From the chart, you can obviously see that the stock price turn to fall down for a long time. The price fairly increased from Oct. 25th to Oct. 30th. In which period the Hanover reported its third quarter financial results, which shows the increase in profit as revenue. The earning per share is $1.03 comparing to the $0.65 per share of the third quarter in 2006. We immediately bought extra 200 shares at the price of $46.11, since we predict it is the time for the THG stock price to rise. However, the phenomenon seems artificial, the price turned bad after that period but still considering increasing comparing to the previous period. As the result, THG brought $222 lost [2].
Figure 5.4.2: Overview of CMED over five weeks [2]
We made a very bad decision in selling all of the CMED in week 3 with $43.22/share compared to purchased price $41.52, since CMED stock kept falling down, then finally started to rise at the mid of third week. We were afraid that this will not last for a long time, so we decided to sell all of them. However, CMED stock price in the fourth week still went up, which reflects that we make a wrong decision. Then, we decided to buy 300 CMED shares at the high price of $47.48/share. The reason for the
49
stock increasing at that time: China Medical Technologies got Korean FDA approval for its HIFU system; the company also announced investor events on November, including UBS China Life Sciences Conference; Goldman Sachs China Investment; Frontier Conference; Credit Suisse Phoenix Health Care Conference; Credit Suisse china Healthcare Sector Global Roadshow. Later, we found that the phenomena is fake, the stock price immediately turns bad after we bought. Holding the CMED stock until the end replaced of market-timing investment strategy. This stock brought $1100 lost [2].
Figure 5.4.3: Overview of AG over five weeks [2]
AG stock is the most profitable to buy. Its price increase by $10/share in average compared to my originally purchased price. From the chart, you can figure out that the price gap begins larger and larger since the end of the third week, and reaches the highest on Nov 4th. The main reason we chose the company is the strong recommendation by Zacks. The AG’s stock began to rise since it represented in the Goldman Sachs- 2007 Global capital foods. On Oct. 30th, AG reported its third quarter income, which has a significant increase, so it’s earning per share rose to 77¢. Sales went up to $1.6 billion,
50
which is 37 percent higher than the sales in the third quarter in 2006. AG stock brought $5459 profit.
Figure 5.4.4: Overview of POR over five weeks [2]
The situation of POR stock price is very similar to THG stocks. We hold the POR stock most of time。 The value of the stock increases higher than our purchased price only in the first week. After that, it began to fairly decrease. Then, after the company declared quarterly common stock dividend of 23.5 cents per share, the stock price began to rise, and reported an increased profit in the third quarter. POR brought $880 lost [2].
51
Figure 5.4.5: Overview of WMT over five weeks [2]
WMT seems a bad choice even though it is the large retailer. It contributed the almost $1400 lost, which is the half of the total lost of the five company. Unexpectedly, the overall WMT stock in October decreased due to the breach –of-contract lawsuit against the world’s largest retailer brought financial draining. The stock price began to back up through the announcement of beefed-up investment in its Japanese subsidiary on Oct. 23rd. The sales of Wal-Mart also are forecasted to increase in November due to the holiday shopping [2].
52
Chapter 6 Portfolio Two by Xiangyu Wang
In this portfolio, we will do the marketing research and pick up five companies to invest, followed with the weekly reports including trade history, various prices, investing method (buy/sell/hold), and portfolio reports. At the end of five week simulation, we will have a concise conclusion about how well the investment strategies apply to specific companies based on our analysis of the gain or losses of our portfolio.
6.1 Types of Companies to Invest
We are going to invest our money to CIGNA (a life and health care insurance company), Amazon (a “.com” company), Low’s (a home improvement retailer), Comcast Cooperation (a cable operator company), and Sony (a game development and electronics company).
The reason we will put the money in five different companies of different fields is the application of mathematical statistics philosophy. When we have a large population, we prefer drawing a random sample which could possibly represent the nature of this whole population. Due to the limit of time and money, we could only invest a few companies, and we do hope the companies we picked up can be as representative as possible. These five types of companies are all closely relevant to the people’s daily life, from household and health care (the basic), to game company (kids’ favors), to “.com” company (an investment trend with lots of controversies).
![Figure 5.2.2: CMED Technial Chart[2]](https://thumb-us.123doks.com/thumbv2/123dok_us/1956755.2789644/41.918.157.762.104.468/figure-cmed-technial-chart.webp)
![Figure 5.2.5: WMT Technical Chart [12]](https://thumb-us.123doks.com/thumbv2/123dok_us/1956755.2789644/45.918.161.752.459.812/figure-wmt-technical-chart.webp)
![Figure 5.3.3: Weekly Stock Price for Five Companies from 10/22 – 10/26 [2]](https://thumb-us.123doks.com/thumbv2/123dok_us/1956755.2789644/49.918.144.782.654.939/figure-weekly-stock-price-companies.webp)
![Figure 5.3.4: Weekly Stock Price for Five Companies from 10/29– 11/02 [2]](https://thumb-us.123doks.com/thumbv2/123dok_us/1956755.2789644/51.918.137.782.398.677/figure-weekly-stock-price-companies.webp)
![Figure 5.3.5: Weekly Stock Price for Five Companies from 11/05– 11/09 [2]](https://thumb-us.123doks.com/thumbv2/123dok_us/1956755.2789644/53.918.155.767.111.387/figure-weekly-stock-price-companies.webp)
