Universit`a degli Studi dell’Insubria Dipartimento di Scienze Teoriche e Applicate
Dottorato di Ricerca in Informatica
DATA QUALITY EVALUATION THROUGH DATA QUALITY RULES AND DATA PROVENANCE
Antonella Zanzi
Abstract
The application and exploitation of large amounts of data play an ever-increasing role in today’s research, government, and economy. Data understanding and decision making heavily rely on high quality data; therefore, in many different contexts, it is important to assess the quality of a dataset in order to determine if it is suitable to be used for a specific purpose. Moreover, as the access to and the exchange of datasets have become easier and more frequent, and as scientists increasingly use the World Wide Web to share scientific data, there is a growing need to know the provenance of a dataset (i.e., information about the processes and data sources that lead to its creation) in order to evaluate its trustworthiness. In this work, data quality rules and data provenance are used to evaluate the quality of datasets. Concerning the first topic, the applied solution consists in the identification of types of data constraints that can be useful as data quality rules and in the development of a software tool to evaluate a dataset on the basis of a set of rules expressed in the XML markup language. We selected some of the data constraints and dependencies already considered in the data quality field, but we also used order dependencies and existence constraints as quality rules. In addition, we developed some algorithms to discover the types of dependencies used in the tool. To deal with the provenance of data, the Open Provenance Model (OPM) was adopted, an experimental query language for querying OPM graphs stored in a relational database was implemented, and an approach to design OPM graphs was proposed.
Contents
1 Introduction 1
1.1 Case study . . . 3
1.1.1 An IP-MAP for the case study . . . 5
1.2 Work content . . . 8
2 Data Quality 10 2.1 Data Quality definition . . . 10
2.2 Classification of Data Quality issues . . . 12
2.3 Approaches to Data Quality . . . 13
2.3.1 Diagnostic approaches . . . 13
2.3.2 Corrective approaches . . . 14
2.4 Data Quality assessment . . . 16
2.4.1 Metrics for Data Quality . . . 16
2.5 Data Quality methodologies . . . 18
2.6 Data cleaning tools . . . 19
2.6.1 Tools from the research community . . . 20
2.6.2 Open source tools . . . 23
3 Data Quality Rules 26 3.1 Data Quality constraints . . . 26
3.1.1 Data dependencies . . . 26
3.1.2 Existence constraints . . . 31
3.1.3 Association rules . . . 31
3.2 Data constraint enforcement . . . 32
3.2.1 Active databases . . . 32
3.2.2 Business rule management systems . . . 32
4 Evaluation of Data Quality Rules 34 4.1 Types of rules . . . 35
Contents ii
4.1.1 Conditional Constraint rules . . . 36
4.1.2 Functional Dependency rules . . . 37
4.1.3 Order Dependency rules . . . 38
4.1.4 Differential Dependency rules . . . 41
4.1.5 Existence Constraint rules . . . 42
4.1.6 Check Constraint rules . . . 46
4.2 XML validation with Schematron . . . 47
4.3 Data Quality measures . . . 51
5 Discovery of Data Quality Rules 53 5.1 Implemented algorithms . . . 53 5.1.1 CFD discovery algorithm . . . 54 5.1.2 CFDp discovery algorithm . . . . 59 5.2 Related works . . . 60 5.2.1 FD discovery methods . . . 60 5.2.2 CFD discovery algorithms . . . 60 6 Data Provenance 62 6.1 The Open Provenance Model . . . 63
6.2 Comments and extension proposal . . . 71
6.3 W3C Provenance Working Group . . . 73
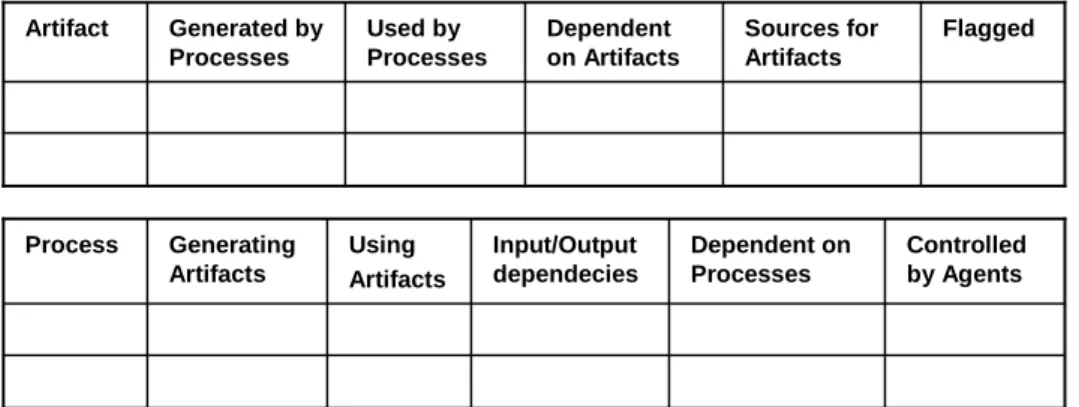
7 OPM Graph Design 75 7.1 Entity clusters and abstract subgraphs . . . 75
7.2 Starting steps: nodes and edges . . . 77
7.3 Checking for cycles . . . 80
7.4 Redundancy check . . . 80
7.5 Graph reduction . . . 81
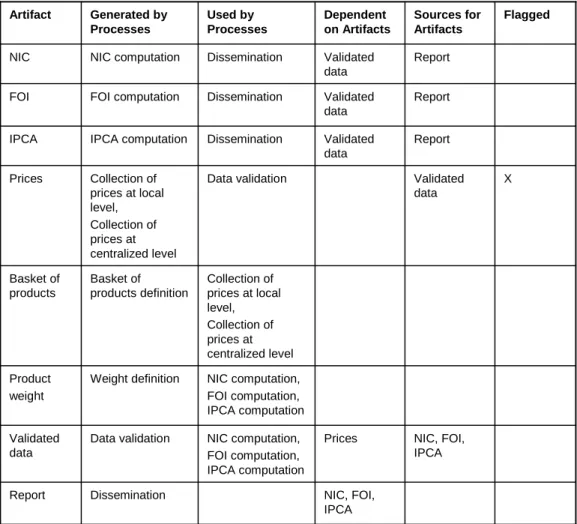
7.6 The method in practice: an example . . . 81
7.7 Is the designed graph legal? . . . 89
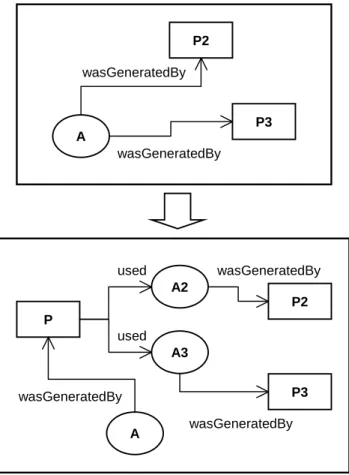
7.7.1 Transformation hints . . . 92
7.7.2 Constraints on time information . . . 94
7.8 Physical modeling . . . 94
7.8.1 Physical model validation . . . 96
7.9 Comments and related works . . . 98
8 Storing and Querying OPM Graphs 99 8.1 Storing OPM graphs . . . 99
Contents iii
8.1.2 OPM graph validation . . . 105
8.1.3 Mapping datasets to OPM graphs . . . 107
8.2 Querying OPM graphs . . . 107
8.3 Related works . . . 111 Conclusions 112 Appendix A 114 Appendix B 124 Appendix C 130 Bibliography 133
CHAPTER 1
Introduction
Data collection has become a normal function of institutions and organizations, and data errors can creep in at every step of the process from the initial acquisition to the storage in a repository. In particular, data acquisition from the field (e.g., through measurements or surveys) and data entry in digital repositories are inherently prone to errors.
The awareness of the critical importance of data quality issues has grown rapidly in the last decades in scientific, industrial, and governmental contexts. Data under-standing and decision making heavily rely on high quality data; for this reason, it is important to be able to obtain such kind of data or, at least, to evaluate the quality of a dataset to judge if it is suitable for a specific purpose. It is often nec-essary to make decisions based on incomplete data; however, analyzing a topic or an issue relying on data of low quality, without having knowledge of it, can lead to wrong analysis results and decisions. Low quality data (sometime called “dirty data” [Rahm and Do, 2000]) include missing data, erroneous data, duplicates, inconsistent data, out-of-date data, and undocumented data.
For new archives or data collections, the prevention is obviously a fundamental aspect; still, issues can arise in the data management process when data are derived from other data or when a dataset results from the integration of multiple data sources. In the data warehouse field, for example, data quality issues can arise when different datasets are merged storing together inconsistent information or when records referring to the same entities are present in more than one data source with different values. Moreover, it might be necessary to deal with datasets received from external sources without having any control on the original acquisition process.
For existing datasets an option is to attempt to cleanse data. Data cleaning is not a simple task; it is highly context dependent, and – in many cases – data can be cleaned effectively only with some human intervention since fully automated
Introduction 2 cleaning procedures could lead to a loss of useful information.
The discovery of incorrect data, which is the first necessary step in data cleaning, is – in most cases – challenging; moreover, even when the presence of errors is recognized, it is not always feasible to trace back the correct values (e.g., detecting inconsistencies among data may not be sufficient to determine which record is at fault), or it is not always possible to correct the data (e.g., changes in the original dataset are not allowed).
Another relevant aspect related to the quality of a dataset is its fitness for the intended purpose, which is one of the definitions provided for data quality, for exam-ple, in [Juran, 1964] “Data are of high quality if they are fit for their intended use in operations, decision making, and planning”. It may occur that a dataset containing correct data is not useful in a specific context, for example, because a different level of detail is requested or for insufficient data coverage. In these cases, efforts need to be devoted to assess the quality level of datasets in order to evaluate their fitness for the intended purpose.
In this context, the concept of data provenance can be useful; especially when in a dataset changes on data are not allowed, it is important to be aware of the history of the dataset (i.e., its origin and modifications) to judge its reliability.
In the present work, we focus on the evaluation of the quality of a dataset using data quality rules and the concept of data provenance. Concerning the first topic, the applied solution consists in the identification of types of constraints that can be useful as data quality rules and in the development of a software tool to evaluate a dataset on the basis of a set of rules expressed in the XML markup language. As rule types, we selected some of the data constraints and dependencies already considered in the data quality field, but we also used order dependencies and existence constraints. To deal with information provenance, we adopted the Open Provenance Model (OPM), we implemented an experimental query language for querying OPM graphs stored in a relational database, and we proposed a method to approach the design of OPM graphs.
As a case study, we used some datasets collected by the Joint Research Centre of the European Commission, the Commission’s in-house science service having the mission to provide European Union policies with independent, scientific, and tech-nical support. The case study refers to real datasets in a context where low quality data limit the accuracy of the analysis results and, consequently, the significance of the provided policy advice. The case study was used to develop and test the experimented solutions, which are anyway generally applicable to other contexts.
Introduction 3
1.1
Case study
In the European Union (EU) the fisheries sector is managed through the Common Fisheries Policy1 (CFP).
Since the CFP was first established in 1983, scientific advice has increasingly become part of the fisheries management decision-making process. The role of the scientific advice was officially attested by the Commission Decision [European Com-mission, 31 August 2005] that established the Scientific, Technical and Economic Committee for Fisheries (STECF), a scientific advisory body to be “consulted at regular intervals on matters pertaining to the conservation and management of living aquatic resources, including biological, economic, environmental, social and techni-cal considerations”. The European Commission is thus required by regulation to take into account the advice from this committee when presenting proposals on fisheries management.
The are several impediments to the rational management of marine resources, one of them is inadequate data. Fisheries management decisions are often based on population models, but the models need high quality data to be effective. As stated in [Chen, 2003], the quality of fisheries data has great impact on the quality of stock assessment2 and, consequently, on fisheries management.
The termfisheries data generally refers to data that may be useful in the man-agement of a fishery. Such data usually include biological information about the exploited fish, economic information about the fishermen, and information about the environmental conditions that affect the productivity of the species.
Fisheries data are collected from different sources and can be categorized as fishery-dependent or fishery-independent data [Cooper, 2006]. Fishery-dependent data derive from the fishing process itself, while most of the fishery-independent data come from research surveys conducted by scientists.
The most common sources of fishery-dependent data are landings records and port samples. In some commercial fisheries, fishermen keep their own records, called logbooks or vessel trip reports, collecting data on the time and place of fishing, the effort expended, and the catch by species. Furthermore, onboard observers, who sometimes accompany fishing vessels, can provide information on fishing activities that are not always reported in logbooks, such as effects of fishing activities on
1
http://ec.europa.eu/fisheries/cfp
2
Stock assessment describes the past and current status of a fish stock; in addition, it attempts to make predictions about how the stock will respond to current and future management options [Cooper, 2006].
Introduction 4 protected species and the extent and fate of bycatch3 and discarding4.
Fisheries data have different uses and many users, including strategic planning by industry and stock assessment by scientists. Data adequacy can be evaluated only in the context of the purposes for which they are used. For each use, data have to satisfy a set of requirements, including accuracy, coverage or completeness, level of detail, timeliness, accessibility to users, and credibility of both the data collection process and the management process that transforms and uses the data.
In order to allow the creation of a pan-European dataset to be used for policy advice, the Commission Regulation No 1639/2001 [European Commission, 17 Au-gust 2001] established the Data Collection Regulation (DCR), a Community frame-work for the collection of data in the fisheries sector; afterwards, the Commission Regulation No 665/2008 [European Commission, 15 July 2008] modified the DCR establishing the new Data Collection Framework (DCF) for the collection, manage-ment, and use of data in the fisheries sector with the aim to support the scientific advice regarding the CFP.
The new framework implements a routine and systematic collection of the basic data needed for scientific analyses and establishes rules and procedures to make these data available to the scientific community.
All the EU Member States that are involved in fisheries or aquaculture activities or in fish processing industry sector have to fulfill the DCF obligations. In partic-ular, the DCF requires Member States to collect data on biological and economic aspects of many European fisheries and related fisheries sectors providing access to these data for fisheries management advice, scientific publication, public debate, and stakeholder participation in policy development.
The fisheries data collected under the DCF are classified as follows:
– Economic data: employment, expenditure, capital and investments, fishing rights, and direct subsidies;
– Biological data: length and age distribution, maturity data by age and length, sex ratio by age and length, discards, and discards length distribution; – Effort data: days at sea and energy consumption;
– Transversal data: capacity, landings, and prices; 3
Bycatch refers to fish or other species of animals caught unintentionally.
4
Discards are the portions of a catch which are not retained on board and are returned, often dead or dying, to the sea.
Introduction 5 – Data from surveys (i.e., sampling at sea) about demersal species and small
pelagic species5.
The Joint Research Centre (JRC), on behalf of the Directorate-General for Mar-itime Affairs and Fisheries (DG-MARE) of the European Commission, collects and maintains the fisheries data reported by EU Member States under the DCF. The datasets gathered by JRC are first checked for compliance and quality, then they are placed at disposal of teams of independent experts who, participating in STECF working groups, are in charge of the scientific advice.
Being the scientific advice based on the results of the analyses performed by the experts, the assessment of the quality of the data they use is an important and critical task. In fact, even if in the DCF regulation it is stated that “Member States shall be responsible for the quality and completeness of the primary data collected [...] and for detailed and aggregated data derived [...]”, there are several issues in the quality of the data provided by Member States.
In a recent document about fishing opportunities for 2011 produced by the Euro-pean Commission, it is reported that the scientific advice about overfishing is missing for about two-thirds of the total allowable catches6. In most cases, this is because of missing information on catches, incomplete surveys, or poor sampling, though there are cases where the underlying biological issues present difficult scientific challenges [European Commission, 2011].
The data quality checks carried out at JRC is concretely helping Member States in assessing the quality of the data they provide and also in improving the quality of their data management process. Detailed information about the DCF data collection activities performed by JRC can be found in a dedicated Web site7; in addition, the results of the data analyses performed by the experts are published on the STECF Web site8.
1.1.1 An IP-MAP for the case study
To illustrate the processes involved in the fisheries data submission from Member States, with particular emphasis on the activities addressing data quality verifica-tion and improvement, we use an Informaverifica-tion Product Map (IP-MAP), which is a graphical language for the description of the information production processes
5
Demersal marine species live on or near the bottom of the sea, whereas pelagic marine species live near the surface of the sea.
6
Total allowable catches are the catch limits for most significant commercial fish stocks and are decided every year by the Council of Ministers of the EU.
7
https://datacollection.jrc.ec.europa.eu
8
In tr o d u ct io n 6 ! ! " " " ! ! # $ $ % & $ ! ! Fi g u re 1 .1 : A n IP -M A P fo r the ca se st udy
Introduction 7 [Shankaranarayan et al., 2000] (details about the constructs used to build IP-MAPs can be found in appendix C).
The IP-MAP in figure 1.1 refers to one Member State and one dataset; the same process is repeated for all the Member States and all the datasets involved in the DCF. The main tasks related to data quality are shown in the diagram: domain checks, duplicate discovery, evaluation of data quality rules, and comparisons with other data sources.
During the data submission procedure, some preliminary checks are carried out and Member States are informed about issues in the format of their data. At the end of the submission procedure, other checks are performed on the data stored in the staging database.
First of all, duplicate records and records with different values referring to the same entities (e.g., the same fleet segment) are identified (i.e., duplicate detection and record linkage procedures are applied).
Afterwards, data are evaluated against a set of rules which are mainly provided by experts in the fisheries sector; in the diagram, the data quality block labeled “evaluation of DQ rules” refers to this step.
Furthermore, for each country, coverage checks are carried out to ensure that all the necessary data for each fleet segment have been submitted. To establish how many and which fleet segments should be reported by each country, the National Programmes of each Member State are consulted.
Finally, external data sources are also used to improve the consistency checks on the received data: the Eurostat database9 and the EU Sea Fishing Fleet Reg-ister10. Eurostat, the statistical office of the European Union providing statistics at European level, collects also some data about fisheries (i.e., catches and landings data aggregated at national level) and aquaculture activities. The Sea Fishing Fleet Register is a repository where all the fishing vessels flying the flag of a Member State have to be registered in accordance with the Community legislation; in particular, capacity data (i.e., the number of vessels, the kilowatts, and the gross tonnages) are requested for each fleet segment for the entire national fleet. Data from these two archives are used to assess the consistency, at national level, of some of the data collected under the DCF.
9
Eurostat data are accessible online at http://epp.eurostat.ec.europa.eu
10
Introduction 8
1.2
Work content
The aim of the work is to explore, apply, and – if necessary – develop approaches and tools to evaluate and improve the quality of datasets in a scientific context. The motivation of the work is a real need to evaluate and improve the quality of data in the context of the EU Data Collection Framework for fisheries data introduced in the previous paragraph, but the objective is to propose solutions generally applicable regardless of the context.
After a literature survey and a comparison of the available techniques and tools, we decided to utilize some already existing robust approaches (e.g., database pro-filing, exploratory data analysis, and duplicate detection) to deal with some of the issues related to data quality; whereas the development effort mainly addressed two topics that are relevant in the context of data quality evaluation and for which there are not yet well-established approaches and tools: the use of quality rules and provenance information.
The concept of rules is widely used in data management and data quality fields: integrity constraints, functional dependencies, and business rules are types of rules normally enforced on datasets. However, rules can play an important role also in the data quality evaluation field. In this context, rules are not constraints to be enforced on a database but are used to determine the quality profile of a dataset. Data quality rules can verify not only the correctness of data but also their suitability for a purpose. Thus, more than one set of rules can be created for a dataset in order to verify its fitness for different purposes. Furthermore, the concept of data quality rules can be used to quantify data quality using the results of the evaluation of the rules in order to compute data quality metrics.
We adopted an approach in which quality constraints on data are expressed in form of rules, and we developed a software tool for the evaluation of a dataset on the basis of a set of rules. As data quality rule types to be used in our tool, first of all we selected some types of data constraints and dependencies already proposed in data quality works, for example, association rules, functional dependencies, and condi-tional funccondi-tional dependencies (the latest being funccondi-tional dependencies holding on a subset of the relation instance and recently introduced in the data cleaning context [Bohannon et al., 2007]). In addition, we considered order dependencies [Ginsburg and Hull, 1983] andexistence constraints [Atzeni and Morfuni, 1986] because they can be useful in the context of data quality evaluation, even if, to our knowledge, they have not yet been used in the data quality field.
The data collected under the DCF are not well documented with provenance information. Some information can be found in the National Programmes (e.g.,
Introduction 9 the description of data sampling schemes and methodological choices), but further information can be useful to allow experts and other users to evaluate the reliability of the data provided by Member States.
With the aim to deal with this shortcoming, we explored the possibility to ac-company the data published on the DCF Web site with provenance information, and we experimented the adoption of a model for data provenance recently proposed in literature, the Open Provenance Model.
The rest of the thesis is organized as follows:
– Chapter 2 discusses the definition of data quality, introduces some classifica-tions of data quality issues, and summarizes the current approaches used to address them.
– Chapter 3 introduces various types of constraints and dependencies that can be used as data quality rules.
– In chapter 4, we describe the solution adopted to verify if a dataset complies with a set of rules expressed in the XML markup language, and we introduce the metrics used in the context of the used case study.
– Chapter 5 presents the algorithms implemented to discover the data dependen-cies called Conditional Functional Dependendependen-cies (CFD) and CFDp (which are CFD with built-in predicates). These dependencies, which are extensions of traditional functional dependencies, have been recently proposed in literature in the data quality field.
– Chapter 6 introduces the concept of data provenance and describes the Open Provenance Model (OPM), a model of provenance that aims to promote the exchange of provenance information among heterogeneous systems.
– In chapter 7, we propose a method for the design of OPM graphs. The method is composed of two phases: in the conceptual phase, concepts and their rela-tionships are identified and mapped into OPM elements; the physical phase refers to the serialization of the OPM graph into the corresponding XML structure with the validation of the generated XML document.
– Chapter 8 describes the approach used to store and query an OPM graph in a relational database: a relational schema for OPM was designed and queries are performed on it.
CHAPTER 2
Data Quality
2.1
Data Quality definition
Considering the quality of data, the first thoughts that come to mind are the correct-ness of data and the need to have error-free data. Certainly, this is a very important aspect of the problem, but it is not the only one determining the quality level of data. For this reason, different definitions for the concept of data quality have been proposed, and still a formal one is missing. In the following, some of the several definitions proposed in literature are introduced:
– Juran [1964] focuses on the use of data: “Data are of high quality if they are fit for their intended use in operations, decision making, and planning”; – according to Orr [1998] data quality “is the measure of the agreement between
the data views presented by an information system and that same data in the real world”;
– Shanks and Corbitt [1999], following the Juran’s point of view, adopt the definition of quality as “fitness for purpose”;
– Redman [2001] highlights data characteristics: “Data to be fit for use must be accessible, accurate, timely, complete, consistent with other sources, relevant, comprehensive, provide a proper level of detail, be easy to read and easy to interpret”.
In the last reported definition, data quality is interpreted as a combination of prop-erties or characteristics, sometime called dimensions [Scannapieco and Catarci, 2002] to emphasize the fact that they may be quantified (even if in reality it is not often straightforward to measure data quality characteristics); examples of these proper-ties are: accuracy, completeness, consistency, relevance, and accessibility.
Data Quality 11 A first survey of the proposed sets of dimensions characterizing data quality was published in 1995 [Wang et al., 1995]. Since then, other proposals have been presented, such as in [Naumann, 2002] and [Bovee et al., 2003]. Moreover, several international organizations adopted their own set of characteristics defining data quality (some examples can be found in [Bergdahl et al., 2007, OECD, 2008, Euro-pean Commission, 31 March 2009]).
Even if there is not a common agreement on the set of properties to be used to characterize data quality, some of them are considered particularly important (e.g., accuracy, consistency, and completeness) and always cited in data quality works; still, for some of them (e.g., reliability, believability, credibility, and accessibility) the assigned meaning can be slightly different.
The following list shows the most mentioned data quality properties both in literature works and in reports published by institutions providing statistical data:
Accuracy is considered the most important characteristic of data quality. It refers to the lack of errors and it is defined as the degree of correctness of a recorded value when compared with the real-world value. Inaccurate data can be either incorrect or out-of-date data.
Consistency means that the representation of the data value is the same in all cases. It implies that there is no redundancy and that, in a database context, referential integrity is enforced. Conflicting data are considered inconsistent.
Completeness is defined as the degree of presence of data in a given collection.
Validity means that an attribute is valid if its value is within a predefined value domain.
Believability is the extent to which data are accepted or regarded as true and credible.
Credibility refers to the credibility of the data source.
Relevance refers to the applicability of data in a particular context; it is the degree to which data meet current and potential user needs.
Timeliness of information reflects the length of time between data availability and the event or phenomenon they describe; it implies that the recorded value is not out-of-date. Timeliness sometime is defined in terms of currency, how recent are data, and volatility, how long data remain valid.
Data Quality 12
2.2
Classification of Data Quality issues
In addition to the given definitions of data quality, it is interesting to consider more in detail which are the problems that affect in practice the quality of a dataset.
In [Oliveira et al., 2005b] it is stated that, to measure the coverage of a tool for the automatic or semi-automatic detection and correction of the problems that affect data, a complete taxonomy of quality problems should be used. In practice, beyond the lack of a standard definition for the data quality concept, there is no standard taxonomy of data quality issues; however, some classifications of the problems that affect data quality have been proposed in literature.
In [Oliveira et al., 2005b,a] data quality problems are divided in single-source and multi-source, then 26 and 9 primitive problems are respectively identified in these two groups.
Also Rahm and Do [2000] distinguish between single-source and multi-source data quality problems. Moreover, they divide the two groups into schema-related and instance-related problems, defining schema-related problems as those that can be addressed by improving the schema design, schema translation, and schema inte-gration, and defining instance-related problems as errors and inconsistencies in the actual data contents that cannot be prevented at the schema level.
Kim et al. [2003] present a detailed taxonomy of data quality issues consisting of 33 primitive data quality problems. The taxonomy is based on the premise that data quality problems manifest in three different ways: missing data; not missing, but wrong data; and not missing and not wrong, but unusable data. Unusable data can occur when two or more databases are merged or when codifications are not consistently used. The taxonomy is a hierarchical decomposition of these three basic manifestations of data quality issues.
Müller and Freytag [2003] roughly classify data quality issues into syntactical, semantic and coverage anomalies. Syntactical anomalies describe characteristics concerning the format and values used to represent entities (e.g., lexical errors and domain format errors); semantic anomalies hinder the data collection from being a comprehensive and non-redundant representation of the world (e.g., duplicates and contradictions), and coverage anomalies decrease the amount of entities and entities properties from the world that is represented in the data collection (e.g., missing values). This classification is limited to data quality problems that occur in a single relation of a single source.
Finally, a more general typology of data quality issues is proposed in [Fürber and Hepp, 2005], where the quality problems are traced back to four basic types; namely, inconsistency, lack of comprehensibility, heterogeneity, and redundancy.
Data Quality 13
2.3
Approaches to Data Quality
Approaches to data quality can be divided in preventive, diagnostic, and corrective approaches.
Being data cleaning an expensive process and not always applicable, preventing the inclusion of dirty data in a repository is obviously an important step. Preventive approaches refer, for example, to the appropriate design of databases, to the use of integrity constraints, and to the development of data entry tools providing data check functionalities.
Prevention, however, is not always sufficient to avoid all the possible quality issues; thus, the discovery of incorrect data is an important task in the evaluation of data quality, and it is the first necessary step in data cleaning. Common diagnostic approaches are database profiling and exploratory data analysis.
Finally, data cleaning deals with detecting and removing errors and inconsisten-cies from data. Currently used corrective approaches comprise cleaning methods for attributes, duplicate detection techniques, and virtual repair methods.
For the variety of the techniques proposed to deal with low quality data, efforts have been recently devoted also to the definition of methodologies that can help in selecting, customizing, and applying data quality techniques.
The rest of the chapter briefly summarizes the approaches to data quality used in existing software tools or that have been presented in literature.
2.3.1 Diagnostic approaches Database profiling
Data profiling focuses on the analysis of individual attributes. It derives information such as data type, length, value range, discrete values and their frequency, variance, uniqueness, occurrence of null values, and typical string pattern, providing an exact view of various quality characteristics of the attributes.
Exploratory data analysis
Exploratory Data Analysis (EDA), sometimes called Exploratory Data Mining [Dasu and Johnson, 2003], refers to activities that enclose the statistical evaluation of data values and the application of data mining algorithms in order to explore and understand data.
Data mining can help discover specific data patterns (e.g., relationships holding among several attributes) and rules to ensure that data do not violate the application
Data Quality 14 domain constraints. This is the focus of so-called descriptive data mining models including clustering, summarization, association discovery, and sequence discovery.
In many, if not in most cases, data can only be cleaned effectively with hu-man involvement. EDA typically involves a huhu-man in the process of understanding properties of a dataset, including the identification and possible correction of errors. Therefore, there is typically an interaction between EDA methods and data visu-alization systems: data visuvisu-alization is often used to make statistical properties of data (e.g., distributions, correlations, etc.) easily accessible to data analysts.
2.3.2 Corrective approaches Cleaning methods for attributes
Data cleaning techniques for single attributes can be categorized by the data types that they target.
In this field, the issue of cleaning quantitative data (i.e., integers or floating point numbers) has been initially addressed. Statistical methods for outlier detection are the foundation of data cleaning techniques in this domain; an exhaustive survey of data cleaning methods used on quantitative attributes can be found in [Hellerstein, 2008].
Research efforts have been also devoted to categorical data, namely, names or codes used to assign data into categories or groups. One key problem in data cleaning for categorical data is the identification of synonyms. Another relevant issue is managing data entry errors (e.g., misspellings) that often arise with textual codes; currently, several techniques for handling misspellings, often adapted to specialized domains, are available.
Recent works have proposed the use of Functional Dependencies (FDs) for data cleaning purposes in relational databases. Data dependencies are normally used in the context of database design; however, representing domain knowledge, they can be useful also in the data quality field. For example, in [Pivert and Prade, 2010] the case in which dirtiness corresponds to the violation of FDs is considered.
Furthermore, in order to perform more specific data cleaning operations, exten-sions of FDs have been proposed. In particular, Conditional Functional Dependen-cies (CFDs), which are FDs holding on a subset of the instances of the original relation, have been recently proposed in [Cong et al., 2007] as a method for incon-sistency detection and repairing. This approach is used, for example, in Semandaq [Fan et al., 2008a], a tool using CFDs for data cleaning purposes, where users can specify CFDs through the drag and drop functionality provided in the user inter-face. Another tool, called Data Auditor, is presented in [Golab et al., 2010] and
Data Quality 15 supports more types of constraints (i.e., CFDs, conditional inclusion dependencies, and conditional sequential dependencies) that are used to test data inconsistency and completeness.
Duplicate detection and record linkage
The aim of these techniques is to match all the records relating to the same entity. Duplicate entries can be identical records or records referring to the same entity and containing different values.
The process of matching records stored in different databases but referring to the same entity is commonly called record linkage; other terms are also used, such as merge/purge problem, object identification, and entity uncertainty. Sometime, when applied on a single database, this process is called de-duplication.
Different techniques, such as knowledge-based methods, filtering, and regular expression matching, have been proposed to address this issue; a survey of the most used techniques can be found in [Elmagarmid et al., 2007].
Querying inconsistent data
An approach to manage data inconsistencies is based on the concepts of repair and consistent query answer [Bertossi and Chomicki, 2003].
A repair of a database is another database – over the same schema – that is consistent and differs minimally from the original database. Research has focused on both materialized and virtual repairing, and different notions of repair have been proposed to capture the concept of minimal change in different ways [Chomicki, 2006].
Virtual repairing, which is usually called consistent query answering, does not change the database but rather returns query answers true in all repairs (i.e., consis-tent query answers) regardless of the way the database is fixed to remove constraint violations. Thus, consistent query answers can provide a conservative “lower bound” on the information contained in the database. With this aim, various methods for computing consistent query answers without explicitly computing all repairs have been developed [Chomicki, 2006].
Data transformation methods
Data transformation methods are used to modify the schema and the instances of a database, mainly with integration purposes.
In particular, the Extract-Transform-Load process for data warehouse creation consists of steps that extract relevant data from the sources, transform them to the
Data Quality 16 target format, clean it, and then load them into the data warehouse. A survey on the technologies that can be used in the Extract-Transform-Load process can be found in [Vassiliadis, 2009].
2.4
Data Quality assessment
As summarized in [Lee et al., 2006], the main techniques that are currently used to assess the quality of a dataset are:
– The use of data quality surveys, which relies on users satisfaction as a mea-sure of quality; a survey elicits the evaluation of data quality dimensions from stakeholders of the organization providing the data and the resulting assess-ment reflects the perceptions of the participants in the survey.
– The computation of data quality metrics or indicators, which can provide objective measurements of some quality characteristics.
– The application of data integrity analysis, which focuses on the conformance of data to integrity constraints specified in the database.
To assess the quality of data stored in a repository or produced by an organization, different strategies employing combinations of these techniques can be adopted.
Several proposals of combined techniques in form of methodologies, mainly ad-dressed to business companies and organizations providing services to clients, can be found in literature and some of them will be mentioned in one of the following paragraphs.
2.4.1 Metrics for Data Quality
Assessment of data quality can be performed in relation to several data quality dimensions.
Data quality dimensions and their measurement are usually discussed indepen-dently from each other. In each context, after having determined which data quality dimensions are important or more useful, it is then necessary to define some variables referring to the chosen dimensions.
The following are examples of general metrics suggested in [Lee et al., 2006]: – For the accuracy dimension:
Free−of−error rating= 1− Number of data units in error
Data Quality 17 – For the completeness dimension:
Completeness rating= 1− Number of incomplete items
Total number of items – For the consistency dimension:
Consistency rating =1−
Number of instances violating specific consistency type Total number of consistency checks performed – For the believability dimension:
Believability =min(Believability of source,Believability based on age of data Believability when compared to internal commonsense standard)
where each of the three used variables are rated on a scale from 0 to 1. – For the timeliness dimension (reflecting the up-to-date data feature):
Timeliness rating = max 1−Currency Volatility,0 s where:
• currency = (delivery time - input time) + age;
• volatility refers to the length of time over which data remain valid;
• delivery time refers to the time at which data were delivered to the user;
• input time refers to the time at which data were received by the system;
• age refers to the age of data when were first received by the system;
• and the exponent value is task dependent (allowing one to control the sensitivity of the measure).
Many of the variables that can be measured are context dependent, for this reason, in order to be used in practice, the above proposed metrics need to be customized in the specific context.
For example, the metric suggested for the accuracy dimension, which is the most cited data quality characteristic, can be used only when wrong data are easily identifiable, which is not often the case. Accuracy can be defined as how closely information matches a real-life state; namely, the accuracy of an attribute value measures the distance between the attribute value stored in a data repository and
Data Quality 18 the corresponding value in the real world at the moment of measuring the quality of the attribute value. Accuracy is thus determined by means of a distance measure; to measure it exactly, it is necessary to know the attribute value as it is stored in the data source and also its actual value. In many cases, determining the latter is challenging; moreover, in some cases, it is not even possible (this is often the case for data in scientific contexts). Therefore, it could be useful to derive information on the quality of an attribute value without knowing its real-world counterpart. Görz and Kaiser [2012], for example, investigate how metrics for completeness, validity, and currency dimensions can be aggregated to derive an indicator for accuracy and propose an indicator function for accuracy based on the algebraic product of the measures for the completeness, validity, and currency dimensions.
2.5
Data Quality methodologies
A data quality methodology can be defined as a set of guidelines and techniques that, starting from the description of an application context, defines a rational process to assess and improve the quality of a dataset.
The Total Data Quality Management (TDQM) [Wang, 1998] was the first general methodology published in the data quality literature. The fundamental objective of this methodology is to extend the principles of Total Quality Management used in the field of product manufacturing to the data quality context. The process underlying the TDQM methodology considers four phases (iteratively executed, thus constituting a cycle) as necessary for managing an information product:
1. The definition phase includes the identification of data quality dimensions and related requirements.
2. The measurement phase produces quality metrics that provide feedback to data quality management and allow for the comparison of the effective quality with predefined quality requirements.
3. The analysis phase identifies the roots of quality problems and studies their relationships.
4. The improvement phase devises quality improvement activities.
TDQM proposes also a graphical model for the description of the information production processes, called IP-MAP [Shankaranarayan et al., 2000]. IP-MAP en-ables the specification of business processes by means of a conceptual map in which the activities corresponding to the data quality management process are properly addressed.
Data Quality 19 IP-MAP is the only language for information process modeling ever proposed and represents a de facto standard. A comparison among IP-MAP and other graph-ical modeling languages (e.g., workflow and data flow diagrams) can be found in [Shankaranarayan and Wang, 2007]. An example of IP-MAP for the case study was presented in the introduction of the present work; moreover, details about the constructs of the language can be found in appendix C.
Afterwards, other methodologies have been proposed, such as AIMQ (A Method-ology for Information Quality Assessment) [Lee et al., 2002], DQA (Data Quality Assessment) [Pipino et al., 2002], and CDQ (Comprehensive methodology for Data Quality management) [Batini and Scannapieco, 2006].
The sequence of activities composing a data quality methodology can be generally grouped in three phases:
1. State reconstruction, which is aimed at collecting contextual information on organizational processes and services, data collections and related management procedures, quality issues and corresponding costs.
2. Assessment/measurement, which measures the quality of data collections along relevant quality dimensions. The term measurement is used to address the issue of measuring the value of a set of data quality dimensions, while the term assessment is generally used when such measurements are compared with reference values to enable a diagnosis of quality.
3. Improvement, which concerns the selection of steps, strategies, and techniques in order to reach new data quality targets.
A detailed comparison of thirteen methodologies (comprised those previously mentioned) can be found in [Batini et al., 2009], where the considered methodolo-gies are compared along several perspectives, including the methodological steps, the techniques, the data quality dimensions, the types of data, and the types of information systems addressed by each methodology.
2.6
Data cleaning tools
Every software application that implements one or more techniques to approach one or more data quality issues can be considered a data quality tool, including in the group, for example, also data analysis and data profiling tools. However, only the tools aiming at correcting data anomalies are generally considered to be cleaning tools.
Data Quality 20 Common functionalities provided by the available data cleaning tools are clean-ing of categorical attributes, outlier identification, duplicate detection, and record linkage. Some tools concentrate on a specific domain, such as cleaning name and address data, or on a specific cleaning phase, such as duplicate detection. At the contrary, Extract-Transform-Load (ETL) tools provide transformation and workflow capabilities covering a large part of the data transformation and cleaning process necessary in the construction of data warehouses.
Currently, there are several commercial tools available for data cleaning and most of them are ETL tools. Industrial systems for ETL are provided both by the major database vendors and by the individual ETL-targeted vendors. Popular tools include Oracle Warehouse Builder, Informatica PowerCenter, IBM Datastage, and Microsoft Integration Services.
In [Barateiro and Galhardas, 2005] a survey on data cleaning tools is presented, with a detailed feature comparison on tools both of academic and industrial origin; moreover, a survey on record linkage tools, both academic and commercial, can be found in [Gu et al., 2003].
Some open source tools are also available. Among the open source tools we are aware of, those that seem to have the most active communities are the following: Febrl, which is mainly a record linkage tool, SQL Power DQguru, Flamingo Package, and four ETL tools called Kettle, Talend Open Studio, CloverETL, and KETL.
Furthermore, data cleaning tools have also been developed by the research and academic community. Some of them (FraQL, IntelliClean, AJAX, Potter’s Wheel, SmartClean, Arktos, HumMer/FuSem and TAILOR) will be introduced in the fol-lowing subsection along with the previously mentioned open source tools.
2.6.1 Tools from the research community FraQL
FraQL [Sattler and Schallehn, 2001] is a declarative language supporting the spec-ification of a data cleaning process. The language is an extension of SQL based on an object-relational data model. It supports the specification of schema transforma-tions as well as data transformatransforma-tions using user-defined functransforma-tions. FraQL supports also the filling in of missing values, the elimination of invalid tuples, and the removal of outliers.
IntelliClean
IntelliClean [Lee et al., 2000] is a rule-based approach to data cleaning with the main focus on duplicate elimination. The proposed framework comprises three steps. In
Data Quality 21 the pre-processing stage syntactical errors are eliminated and the values are stan-dardized in format. The processing stage represents the evaluation of cleaning rules that specify actions to be taken under certain circumstances. There are four different classes of rules: (1) duplicate identification rules specify the conditions under which tuples are classified as duplicates; (2) merge/purge rules specify how duplicates are to be handled; (3) update rules specify the way data is to be updated in a particular situation and can also be used to specify how missing values ought to be filled in; (4) alert rules specify conditions under which the user is notified about an event occurrence or a constraint violation. During the first two steps of the data cleaning process the actions taken are logged providing documentation of the performed op-erations. In the human verification and validation step, these logs are investigated to verify and possibly correct the performed actions.
AJAX
AJAX [Galhardas et al., 2000] major concern is transforming existing data from one or more data collections into a target schema eliminating duplicates within the process. For this purpose, a declarative language for expressing transformations to be performed on tables is defined. AJAX provides five transformation operators: mapping, view, matching, clustering, and merging. (1) Mapping is used to split one table into several tables. (2) View corresponds to an SQL query augmented by integrity constraints over its result; integrity constraints can generate exceptions that correspond to specific events in the process. (3) Matching computes an approximate join between two relations using, instead of the equality operator of SQL, a distance function to decide which pairs of values need to be joined. (4) Clustering takes a single input relation and returns a single output relation that groups the records of the input relation into a set of clusters; clusters can be calculated on the basis of the usual SQLgroup by operator or by means of a distance function. (5) Merging partitions an input relation according to various grouping attributes and collapses each partition into a single tuple using an arbitrary aggregation function.
Potter’s Wheel
Potter’s Wheel [Raman and Hellerstein, 2001] is an interactive data cleaning tool that integrates data transformation and error detection using a spreadsheet-like interface.
The tool provides the following operations, called transforms, to support common schema transformations without explicit programming: value translations, applying a function to every value in a column; one-to-one mappings, transforming individual
Data Quality 22 rows; and many-to-many mappings of rows. The effects of the performed operations are shown on tuples visible on the screen. The anomalies handled by this approach are syntax errors and irregularities. Users can also specify the required transforma-tion through examples, and the tool produces the functransforma-tion that best matches the provided examples by using algorithms based on the identification of regular expres-sions. In addition, the tool allows users to define custom domains and corresponding algorithms to enforce domain constraints.
SmartClean
SmartClean [Oliveira et al., 2009] is a data cleaning tool in which both detection and correction operations are specified through a declarative language inspired by the SQL language. The user does not need to specify the execution order of data cleaning operations, the sequence is automatically established by the tool. The tool supports the manipulation of data quality problems at different levels of granularity (i.e., tuple, relation, and multiple relations).
Arktos
Arktos [Vassiliadis et al., 2001] is a framework modeling and executing the ETL process for data warehouse creation. In this tool, data cleaning is considered as an integral part of the ETL process; for this reason a meta-model is specified allowing the modeling of the complete ETL process. The single steps, which perform clean-ing operations, within the process are called activities. Each activity is linked to input and output relations, and the logic performed by an activity is declaratively described by an SQL statement. Each statement is associated with a particular error type and a policy that specifies the behavior (i.e., the action to be performed) in case of error occurrence. Six types of errors can be specified: primary key violation, uniqueness violation and reference violation are special cases of integrity constraint violations; the error type null existence is concerned with missing values; the re-maining error types are domain mismatch and format mismatch referring to lexical and domain format errors.
HumMer/FuSem
Humboldt Merger (HumMer) [Bilke et al., 2005] and FuSem [Bleiholder et al., 2007] (which is an extension of HumMer) allow ad hoc declarative fusion of data from heterogeneous sources using an extension of the SQL syntax to support data fusion operations. Guided by a query against multiple tables, HumMer proceeds in three
Data Quality 23 automated steps. First, instance-based schema matching bridges schematic hetero-geneity of the tables by aligning corresponding attributes. Next, duplicate detection techniques find multiple representations of identical real-world objects. Finally, the data fusion and conflict resolution step merges duplicates into a single and consistent representation. HumMer provides a subset of SQL as a query language, which con-sists of select-project-join queries, and allows sorting, grouping, and aggregation. In addition, it supports the Fuse By statement [Bleiholder and Naumann, 2005] allowing both the alignment of different relations and the identification of tuples representing the same real-world object.
TAILOR
TAILOR [Elfeky et al., 2002] is a record matching toolbox that allows users to apply different duplicate detection methods on a dataset. TAILOR provides four main functionalities: searching method, comparison function, decision model and measurement; the last one allows an estimation of the performance of the used decision model.
2.6.2 Open source tools Febrl
Febrl1 – Freely Extensible Biomedical Record Linkage – [Christen, 2008, 2009] is an open source tool written in Python and licensed under the Australian National University (ANU) Open Source License. Febrl was initially dedicated to data stan-dardization and probabilistic record linkage in the biomedical domain. It includes a probabilistic approach based on a hidden Markov model for data standardization and seventh different methods for record linkage. Input data are read from files, and a graphical user interface is provided.
SQL Power DQguru
SQL Power DQguru2 (formerly known as SQL Power MatchMaker) is a Java-based open source tool providing transformation and matching functions that users can use to define their own data matching criteria. The data conversion workflow can be manipulated by arranging and connecting individual process steps through a graphical user interface. Moreover, it performs duplicate verification and merging of duplicate records.
1
http://sourceforge.net/projects/febrl
2
Data Quality 24 SQL Power DQguru is distributed under the GNU General Public License (GPL) and can be interfaced with several database systems (e.g., Oracle, MySQL, Post-greSQL).
Flamingo Package
The Flamingo Project, carried out at the University of California Irvine, focuses on how to deal with errors and inconsistencies in information systems and aims at developing algorithms in order to make query answering and information retrieval efficient in the presence of inconsistencies and errors.
The Flamingo package3 [Li, 2011], developed in the context of the Flamingo Project, is an open source software supporting approximate string queries. It is implemented in C++ and includes algorithms for approximate selection queries, location-based approximate keyword search, selectivity estimation for approximate selection queries, and approximate queries on mixed types.
Kettle
Kettle4 (or Pentaho Data Integration Community Edition) is an open source tool written in Java for designing graphically ETL transformations and jobs, such as reading, manipulating, and writing data to and from various data sources. It is focusing primarily on connectivity and transformation, and it is easily extensible via Java plug-ins. Kettle supports a number of different database systems as well as a variety of flat files. It provides a set of predefined transformations, moreover users can implement further ones in JavaScript.
Kettle started as an independent open source ETL project and was later acquired by Pentaho to be included in the Pentaho Business Intelligence suite. It is released under the GNU Lesser General Public License (LGPL).
Talend Open Studio
Talend Open Studio5 is an open source data integration platform distributed un-der the GNU General Public License (GPL). It provides components for business process modeling and implements the ETL process in a graphical modeling environ-ment. Through the graphical user interface users can drag and drop data processing components onto a process map. Once the design is completed, Talend Data Quality generates an executable code in Java or Perl that can be deployed and executed on
3 http://flamingo.ics.uci.edu/index.html 4 http://kettle.pentaho.com 5 http://www.talend.com/products/talend-open-studio
Data Quality 25 data sources. Talend Open Studio contains a set of predefined transformations and users can specify additional ones in Java or Perl.
Talend Open Studio is developed by Talend, but it is also included in the open source Business Intelligence package from JasperSoft called JasperETL6.
CloverETL
CloverETL7 is a Java-based data transformation and integration platform.
The engine of CloverETL is an open source Java library and does not provide the user interface component. It is released under the GNU Lesser General Public License (LGPL) and can be embedded in any application, commercial ones as well. CloverETL is distributed in several editions: community, OEM program and commercials. The community edition (which is not open source) does not include the full set of transformation components and includes a limited version of the CloverETL Designer (i.e., the graphical user interface module).
KETL
KETL8, designed by Kinetic Networks, is an open source data integration platform with a Java-based architecture and an XML-based configuration. It supports ex-tracting and loading of relational, flat file, and XML data sources, via JDBC and proprietary database APIs.
KETL and its features are released under a combination of the GNU Lesser General Public License (LGPL) and the GNU General Public License (GPL).
6 http://community.jaspersoft.com/project/jaspersoft-etl 7 http://www.cloveretl.com/products/open-source 8 http://www.ketl.org
CHAPTER 3
Data Quality Rules
As constraints and their enforcement play a key role in the maintenance of data integrity into a database, rules and their verification can play a key role in the evaluation and assessment of the consistency of a dataset: the consistency of a dataset can be defined in terms of constraints, and inconsistencies in the dataset itself can be detected as failures to comply with these constraints.
Classic integrity constraints are relevant for data quality and for data cleaning; however, they do not capture all the data quality concerns. For this reason, new forms of quality constraints, which can be considered an extension of usual semantic integrity constraints in databases, are proposed and investigated.
Moreover, data quality rules can play a further role: they can help in verifying the suitability of a dataset to be used for a certain purpose.
The rest of the chapter introduces different types of data constraints that can be used to evaluate the quality of a dataset and briefly mentions existing approaches to enforce data quality constraints.
3.1
Data Quality constraints
3.1.1 Data dependenciesData dependencies, such as functional dependencies, are traditionally used for data-base schema design, integrity constraints, and query optimization, with respect to schema quality in databases [Elmasri and Navathe, 2000]. Recently, data depen-dencies have been revisited from the data quality perspective and used, for exam-ple, to capture data inconsistency, repair inconsistent data, and remove duplicates; moreover, new types of functional dependencies have been proposed as data quality constraints.
Data Quality Rules 27
Functional Dependencies
A Functional Dependency (FD) is a relationship between attributes of a database re-lation stating that the value of some attributes are uniquely determined by the values of some other attributes. More formally, given a relation schemaR={A1, . . . , An} and a set of tuplesr from dom(A1)× · · · ×dom(An), where dom(A) represents the domain of attributeA, a FD is a statement X → Y requiring that X functionally determines Y, where X, Y ⊆ R. X is called the left-hand side or the determinant of the dependency, and Y is called the right-hand side or the dependent. The de-pendency is satisfied by a relation instance r if, for all pair of tuples t1, t2 ∈ r,
t1[X] =t2[X], thent1[Y] =t2[Y](wheret[X]denotes the projection of a tuplet∈r to a subsetX ⊆R).
Equality-Generating Dependencies
Equality-Generating Dependencies (EGDs), namely, dependencies over interpreted data, have been introduced in [Beeri and Vardi, 1984] as a generalization of FDs.
An EGD states that if some tuples fulfilling certain equalities exist in the data-base, some values in these tuples must be equal. Formally, an EGD is a pair
h(a1, a2), Ii, wherea1 anda2 are values for some attributeAandI is a finite relation such thata1, a2 ∈ I[A]. A relation J satisfies h(a1, a2), Ii ifh(a1) =h(a2) for any valuation h such that h(I) ⊆ J; if a1 = a2, then it is trivially satisfied by every relation.
Constraint-Generating Dependencies
In [Baudinet et al., 1999] a generalization of equality-generating dependencies, where equality requirements are replaced by arbitrary constraints on the data domain, have been introduced. Given a relation r, a constraint-generating k-dependency over r
(withk ≥1) is a first-order formula of the form:
(∀t1)· · ·(∀tk)[[r(t1)∧ · · · ∧r(tk)∧C[t1, . . . , tk]]⇒C′[t1, . . . , tk]]
where C[t1, . . . , tk] and C′[t1, . . . , tk] denote arbitrary constraint formulas relating the values of various attributes in the tuples t1, . . . , tk. There are no restrictions on these formulas; they can include all constructs of the constraint theory under consideration, including constants and quantification on the constraint domain.
Constraint-generating 1-dependencies as well as constraint-generating 2-depen-dencies are the most common. For example, constraint-generating 1-depen2-depen-dencies can express a variety of arithmetic integrity constraints, while functional
depen-Data Quality Rules 28 dencies and conditional functional dependencies can be expressed in the form of constraint-generating 2-dependencies.
Conditional Functional Dependencies
In [Bohannon et al., 2007, Fan et al., 2008b] a class of constraints called Conditional Functional Dependencies (CFDs) has been proposed, and the application of this type of constraints in the data cleaning field has been studied. CFDs aim at capturing the consistency of data by incorporating bindings of semantically related values.
Given a relation schema R defined over a fixed set of attributes denoted by
attr(R)with dom(A) denoting the domain of each attributeA∈attr(R), a CFD ϕ
onR is defined as a pair (R:X →Y,Tp), where: (1)X andY are sets of attributes fromattr(R); (2)R :X→Y is a standard FD, referred to as the FD embedded in
ϕ; (3)Tp is a tableau with attributes inX andY (referred to as the pattern tableau ofϕ), where, for eachAinXorY and each tuple t∈Tp, t[A] is either a constant ‘a’ indom(A) or an unnamed variable denoted by ‘_’ that draws values fromdom(A). The pattern tableauTpofϕrefines the standard FD embedded inϕby enforcing the binding of semantically related data values. X can be denoted asLHS(ϕ) and
Y asRHS(ϕ); moreover, the attributes in a pattern tuple are separated with ‘||’. In [Fan et al., 2008b] anormal form for CFDs has been defined: a CFDϕis in normal form ifϕ = (R :X →A,tp), where A is a single attribute and the pattern tableau consists of a single pattern tupletp only.
CFDs having only unnamed variables ‘_’ in their tableaux are classic FDs, while CFDs with only constant values in their tableaux are calledconstantCFDs and can be considered equivalent to association rules.
Constrained Functional Dependencies
Constrained functional dependencies have been proposed by [Maher, 1997]. They extend the traditional notion of FDs by expressing that a FD holds on a subset of a relation, where the subset is defined by a constraint.
These dependencies have been proposed to be used with logic programming languages and to express constraints in databases. Although they are based on the same idea on which CFDs are founded, they were not used in the data cleaning field.
CFD extensions
After the publication of the works about CFDs, extensions of CFDs have been proposed to support disjunction and negation [Bravo et al., 2008], to specify patterns
Data Quality Rules 29 in terms of value ranges [Golab et al., 2008], and to specify patterns of data values containing built-in predicates [Chen et al., 2009].
Extended Conditional Functional Dependencies
The Extended Conditional Functional Dependency (eCFD) has been proposed in [Bravo et al., 2008]. In contrast to CFDs, eCFDs specify patterns of semantically related values in terms of disjunction and inequality, and they can catch inconsis-tencies that cannot be detected by CFDs.
Given a relation schema R defined over a fixed set of attributes denoted by
attr(R)with dom(A) denoting the domain of each attributeA∈attr(R), an eCFD
ϕis a triple (R : X → Y, Yp, Tp), where (1) X, Y, Yp ⊆ attr(R), and Y ∩Yp = ∅; (2) X → Y is a standard FD, referred to as the embedded FD of ϕ; (3) Tp is a pattern tableau consisting of a finite number of pattern tuples over the attributes in
X∪Y ∪Yp such that, for any tuple tp∈Tp and for each attributeAinX∪Y ∪Yp, tp[A]is either an unnamed variable ‘_’, a set S, or a complement setS¯, whereS is a finite subset ofdom(A). X is denoted byLHS(ϕ) andY ∪Yp by RHS(ϕ). Range Tableaux
In [Golab et al., 2008] a range tableauTr is defined as a tableau with all attributes fromXandY, where, for each row tr ∈Trand each (ordered) attributeA∈X∪Y, tp[A]=[a1,a2], witha1,a2∈dom(A)anda1≤a2. Ranges generalize both constants and wildcards, as a constant ‘a’ can be written [a, a]and ‘_’ can be written [amin, amax], whereamin = min dom(A) and amax = maxdom(A).
To denote that a tuplet∈dom(R)satisfies a particular row tp of tableauT, the symbol≍is used. Given a tuplet∈dom(R) and a rowtr ∈Tr,t[S]≍tr[S]iff, for each attribute A of S, t[A]∈tr[A]; namely, t matches the tableau row tr ift[A] is an element of the rangetr[A]for every attributeA.
A relation instance dom(R) satisfies a CFD ϕ = (R :X → Y, Tr) iff ∀ti, tj ∈ dom(R) and ∀tr∈Tr ifti[X] =tj[X]≍tr[X], thenti[Y] =tj[Y]≍tr[Y].
CFDps
A type of data dependency called CFDp has been presented in [Chen et al., 2009]. CFDps are CFD with built-in predicates (6=, <, >, ≤, ≥) in the patterns of data values. A CFDp ϕon R is a pair R(X → Y, T
p), where: (1) X and Y are sets of attributes inattr(R); (2) X→Y is a standard FD, referred to as the FD embedded in ϕ; (3) Tp is a tableau with attributes in X and Y, referred to as the pattern tableau ofϕ, where, for eachA inX∪Y and each tupletpi ∈Tp,tpi[A]is either an
unnamed variable ‘_’ that draws values fromdom(A) or ‘op a’, whereop is one of