Munich Personal RePEc Archive
Factors influencing access to basic
handwashing facilities in developing
countries
Mukherjee, Sacchidananda
National Institute of Public Finance and Policy (NIPFP), New
Delhi, India
12 April 2020
Online at
https://mpra.ub.uni-muenchen.de/99607/
MPRA Paper No. 99607, posted 13 Apr 2020 13:30 UTC
Factors influencing access to basic handwashing facilities in developing countries
Sacchidananda Mukherjee*
*-Associate Professor, National Institute of Public Finance and Policy (NIPFP), 18/2, Satsang Vihar Marg, Special Institutional Area, New Delhi – 110 067, INDIA. E-mail: [email protected]
Abstract
Access to handwashing facilities including soap and water is considered a basic minimum personal hygiene requirement to reduce spreading of infectious diseases like Novel Coronavirus Disease (Covid-19). Outbreak of Covid-19 and subsequent spread of the virus across the world is a serious public health concern of the time. As on 10 April 2020 there are 1,521,252 confirmed cases of infected people of which 92,798 people have died across the world due to Covid-19. It has been suggested by the World Health Organization (WHO) that social distancing and frequent sanitization of hands either by washing with soap and water or by using alcohol based hand sanitizer may reduce possibility of infection. However, access to basic hand washing facilities is not universal in developing countries. Even within a country the access varies across households. There are various factors which influence access to basic hand washing facilities. Therefore, the objective of the present paper is to understand country-specific factors influencing access to basic hand washing facilities in developing countries. The study is based on a sample of 94 countries for 10 years (2008 to 2017). The study throws some interesting results which may be useful to make policies and programmes to increase the coverage of hand washing facilities.
Keywords: Covid-19 pandemic, Access to Handwashing, Public Health, Developing countries,
Human Development, Access to Water.
Factors influencing access to basic handwashing facilities in developing countries
1. Introduction
Access to handwashing facility is considered basic personal hygiene practice which has positive externality in terms of public health benefits. The World Health Organization (WHO) has suggested social distancing and frequent sanitization of hands either by washing with soap and water or by using alcohol based hand sanitizer to reduce exposure to Novel Coronavirus Disease (Covid-19) and protect individuals from the infection respectively. The outbreak Covid-19 and subsequent spreading of the virus across the world is a serious public health of the time. As on 10 April 2020 there are 1,521,252 confirmed cases of infected people of which 92,798 people have died across the world due to Covid-19.1 The access to handwashing facilities is contingent upon access to water supply of adequate quantity and at affordable price. Therefore access to safe water is basic condition to have access to handwashing facility.
Target 6.1 of the Sustainable Development Goals aims to achieve universal and equitable access to safe and affordable drinking water for all by 2030. However, in 2017 10.4 percent of population of the world do not have access to basic drinking water services and 29.4 percent of the world’s population do not receive the water supply from ‘safely managed drinking water sources’ (indicator to measure achievement in SDG Target 6.1). Therefore, protection of drinking water sources is very important for sustainability of water supply services. SDG Target 6.2 aims to achieve access to adequate and equitable sanitation and hygiene for all and end open defecation, paying special attention to the needs of women and girls and those in vulnerable situations by 2030. The indicators for SDG Target 6.2 are proportion of population using safely managed sanitation services, including a hand-washing facility with soap and water. It is to be noted that in 2017 26.6 percent of the world’s population do not have access to basic sanitation services and 55 percent of the population is not covered by safely managed sanitation services. Unsafe management of sewage and sanitation could be detrimental for the environment as well as for public health. In many developing countries incidence of morbidity and mortality due to water-related and vector (mosquito) borne diseases result in loss to the national economy. For example in India water-borne diseases annually put a burden of USD 3.1 to 8.3 billion in 1992 prices (Brandon and Hommann 1995). A recent study conducted by the Water and Sanitation Programme (WSP) of the World Bank estimates that the total economic impacts of inadequate sanitation in India amounts to INR 2.44 trillion (USD 53.8 billion) a year - this is equivalent to 6.4 per cent of India’s GDP in 2006 (WSP undated).
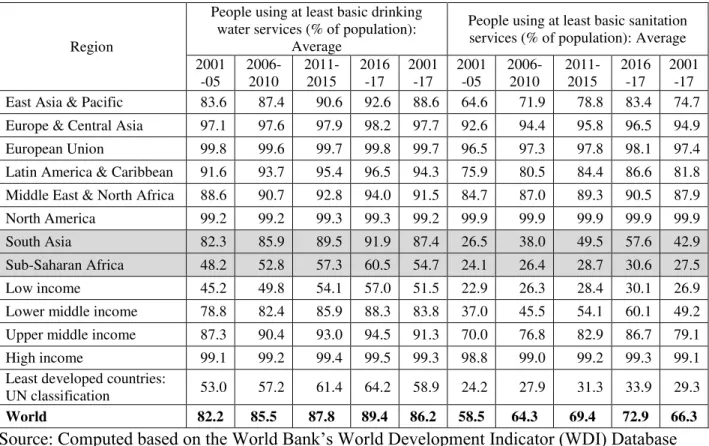
Regional variation in access to basic drinking water and sanitation services is evident from Table 1. Among regions, Sub-Saharan Africa has the lowest access to basic drinking water and
1
https://www.who.int/docs/default-source/coronaviruse/situation-reports/20200410-sitrep-81-covid-19.pdf?sfvrsn=ca96eb84_2 (last accessed on 11 April 2020).
sanitation services. Even within a region considerable variation in access to basic water and sanitation services across countries is observed. Table 1 shows that with rising income level accesses to these services improve. Perhaps with rising income, level of awareness in personal and public health increases in addition to affordability (purchasing power) of the people to pay for water services. As countries move along the income ladder, demand for investment in water supply and sanitation services infrastructure increases. It is expected that with rising income level, willingness to pay of the people increases as they perceive that spending for safe water supply and sanitation is a premium for self-protection and self-insurance against morbidity and mortality associate with of diseases which are water, sanitation and hygiene related. With rising income level, fiscal space of the government also increases in terms of tax and non-tax revenue mobilization which enable governments to spend more on providing public goods and services. Access to sanitation services is contingent upon access to water services. In Sub-Saharan Africa and South Asia considerable percentage of population do not have basic sanitation services (Table 1).
Table 1: Regional Variation in Access to Basic Water and Sanitation Services
Region
People using at least basic drinking water services (% of population):
Average
People using at least basic sanitation services (% of population): Average 2001 -05 2006-2010 2011-2015 2016 -17 2001 -17 2001 -05 2006-2010 2011-2015 2016 -17 2001 -17 East Asia & Pacific 83.6 87.4 90.6 92.6 88.6 64.6 71.9 78.8 83.4 74.7 Europe & Central Asia 97.1 97.6 97.9 98.2 97.7 92.6 94.4 95.8 96.5 94.9 European Union 99.8 99.6 99.7 99.8 99.7 96.5 97.3 97.8 98.1 97.4 Latin America & Caribbean 91.6 93.7 95.4 96.5 94.3 75.9 80.5 84.4 86.6 81.8 Middle East & North Africa 88.6 90.7 92.8 94.0 91.5 84.7 87.0 89.3 90.5 87.9 North America 99.2 99.2 99.3 99.3 99.2 99.9 99.9 99.9 99.9 99.9 South Asia 82.3 85.9 89.5 91.9 87.4 26.5 38.0 49.5 57.6 42.9 Sub-Saharan Africa 48.2 52.8 57.3 60.5 54.7 24.1 26.4 28.7 30.6 27.5 Low income 45.2 49.8 54.1 57.0 51.5 22.9 26.3 28.4 30.1 26.9 Lower middle income 78.8 82.4 85.9 88.3 83.8 37.0 45.5 54.1 60.1 49.2 Upper middle income 87.3 90.4 93.0 94.5 91.3 70.0 76.8 82.9 86.7 79.1 High income 99.1 99.2 99.4 99.5 99.3 98.8 99.0 99.2 99.3 99.1 Least developed countries:
UN classification 53.0 57.2 61.4 64.2 58.9 24.2 27.9 31.3 33.9 29.3
World 82.2 85.5 87.8 89.4 86.2 58.5 64.3 69.4 72.9 66.3
Source: Computed based on the World Bank’s World Development Indicator (WDI) Database
It is important to identify spatial and temporal variations in access to basic water supply and sanitation services which may lead to investment in water and sanitation infrastructure to achieve SDG targets by 2030. Even in developed regions, there are countries and pockets where access to basic water supply and sanitation is not universal. Majority of these countries are developing countries and they need special attention from multilateral development institutions and
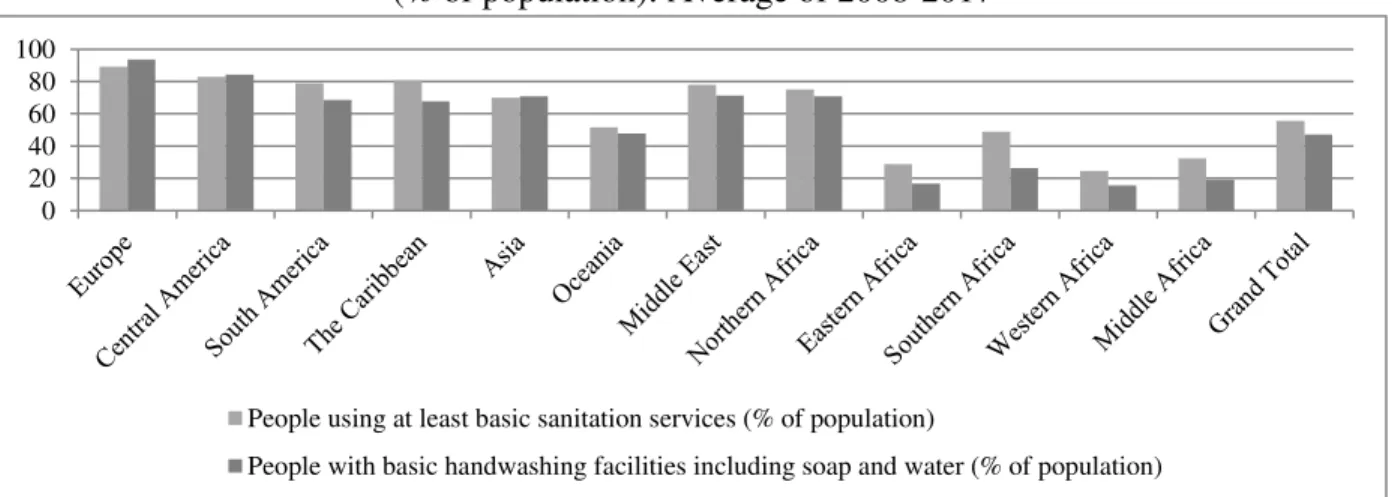
especially from multilateral development banks to universalize the services. Regional variation in access to basic drinking water services across developing countries is presented in Figure 1. This shows that even in Africa, on average Southern African countries have higher access to basic drinking water services as compared to Eastern, Middle and Western African countries. Figure 1 also shows that regions having better access to drinking water services also have better handwashing facilities. This shows that personal hygiene aspect of access to water supply services is important and it must be kept in mind in designing policies and programmes to extend coverage of the service networks.
Figure 1: Regional Variation in Access to Basic Drinking Water Services and Handwashing Facilities (% of population): Average of 2008-2017
Source: Computed based on the World Bank’s World Development Indicator (WDI) Database
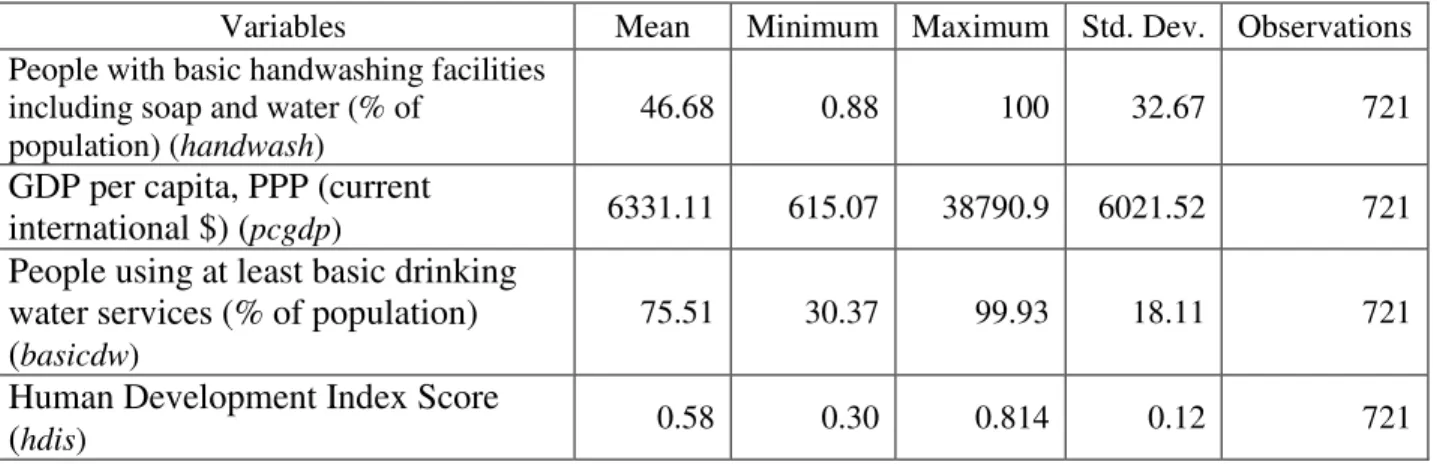
Regional variation in access to basic sanitation and hand washing facilities across developing countries is presented in Figure 2. It shows that in some regions access to hand washing facilities is higher than access to basic sanitation facilities, e.g., Europe, Central America, Asia.
Figure 2: Regional Variation in Access to Basic Sanitation Services and Handwashing Facilities (% of population): Average of 2008-2017
Source: Computed based on the World Bank’s World Development Indicator (WDI) Database
0 20 40 60 80 100
People using at least basic drinking water services (% of population)
People with basic handwashing facilities including soap and water (% of population)
0 20 40 60 80 100
People using at least basic sanitation services (% of population)
There are several factors which influence access to hand washing facilities for a country. The objective of this study is to understand country-specific factors which influence access to hand washing facilities. The study is based on a sample of 94 developing countries during the period 2008 to 2017 (Appendix I provides the list of countries included in our analysis).
In the next section we review the existing literature on the topic of our research to identify research gap. In section 3 we present our econometric model and data sources and it is followed by presentation of regression results of the study in section 4. We draw our conclusions in section 5.
2. Literature Review
Hygiene is closely correlated with human health. Target 6.2 of the Sustainable Development Goals recognizes that access to facilities allowing good hygiene and sanitation should be universal, and especially important to women and girls, and those in vulnerable situations. Of the range of hygiene behaviors considered important for health, hand washing with soap and water is a top priority in all settings, and is considered one of the most cost-effective interventions to prevent diarrheal and respiratory diseases. The availability of a basic handwashing facility is a prerequisite for basic hygiene facilities on premises, and is a useful proxy for hygienic behavior. Cairncross et al (2010) claims that handwashing with soap can reduce the risk of diarrhea by 42-48 percent. Burton et al (2011) argues that handwashing with soap and water could effectively reduce pathogens of fecal origin on hands. Handwashing with soap can reduce both diarrhea and respiratory diseases (Rabie and Curtis 2006; Ejemot et al. 2008), but in low‐income, high‐disease settings, handwashing with soap is uncommon (Curtis et al. 2009, Pickering et al. 2010a). Aiello et al. (2008) shows that handwashing with soap reduces risk of gastrointestinal illness by 31 percent and respiratory infections by 21 percent. Despite efforts to improve handwashing at key times to prevent fecal pathogen ingestion, studies from 13 low-income countries found that only 17 percent of child caregivers wash their hands with soap after defecation (Curtis et al. 2011). Despite the robust evidence supporting the health benefits of handwashing with soap, handwashing practice remains low, particularly in low- and middle-income countries.
There are a large number of studies on effectiveness of hand washing practices to reduce infection of pathogen borne diseases like diarrhea among school children (Greene et al. 2012, Dube and January 2012, Burton et al. 2011, Talaat et al. 2011, UNICEF 2010, Lopez-Quintero et al 2009, Bowen et al. 2007, Hammond et al. 2000) and adults/ households (Pickering et al. 2010b, 2010c, Biran et al 2009., Biran et al 2008, Rajaraman et al. 2014). These studies are based on epidemiological analysis and do not incorporate others aspects, e.g., socio-economic, psychological, cultural, influencing adoption of hand washing practices. However, due to lack of data on cross-country household level surveys in personal hygiene practices, it is beyond the scope of the present study to explore the factors influencing individual’s decision to adopt hand washing practices.
In our knowledge, there is no study in cross-country framework to understand the factors influencing access to hand washing facilities. Therefore the present study aims to initiate discussion on this issue. It is important to identify country specific factors that determine access to hand washing facility and it is expected that such studies could help in policy making to extend the coverage of hand washing facilities in low- and middle-income countries.
It is evident that countries having better access to basic water supply services may have better hand washing facilities. Frequent washing of hands with soap and water requires adequate quantity and desirable quality of water throughout the day. In addition, affordability to purchase soap/ detergents may be an important factor influencing adoption of personal hygiene practices in terms of washing of hands with soap and water. This study ideally is to be carried out at the individual or household level to understand the possible scope (willingness) to adopt self-protection practices to avoid Covid-19 infection. However, lack of access to data at individual or household level from secondary sources compels us to adopt this approach at country level. Per capita income could play an important role in terms of affordability to pay for water services as well as in purchasing soaps/ detergents. However, the relationship between per capita income and access to hand washing facility may be complex, given the common believe that it is the duty of the government to provide basic water supply and sanitation as public services. Costs recovery aspects of water services are very important which play an important role in universalization of the service delivery and long-run financial viability of the services (Mukherjee and Leflaive 2018). Public goods nature of water supply and sanitation services often constraints governments to adopt hard measures to recover full cost of service delivery. Moreover, water services and sanitation services often considered as basic human rights and therefore governments facilitate these services as a matter of political compulsion (Mukherjee and Chakraborty 2017). Due to fiscal constraints and ever increasing demands to provide various other public goods and services, public financing in water services infrastructure may not be always adequate, especially in developing countries, to cover all people and all the time. Therefore, there comes the role of private investment and/ or public-private investment in water services infrastructure. However, current level of private investment in water services is not inadequate. Uncertainty associated with revenue stream due to bleak prospects of full cost recovery, particularly in developing countries, private investors are reluctant to invest in public utility services like water supply and sanitation services and electricity transmission and distribution services (Mukherjee and Chakraborty 2017). However, the very public good nature of water supply and sanitation services and having substantial positive externalities in terms of public health and human development benefits, it is important for governments to invest in water supply and sanitation services. Perhaps the Covid-19 outbreak makes the governments to realize the importance of public investment for public health safety in no uncertain terms.
There are two-way relationship between access to water supply and sanitation services and human development. Mehta (2006) observes that “water and sanitation are key aspects of human development. For poor people, access to water and sanitation is a pre-requisite to achieving a
minimum standard of health and to undertake productive activities.” According to UNDP, overall human development is more closely linked to access to water and sanitation than any other development driver, including spending on health or education, and access to energy services.2 Global access to safe water and proper hygiene education can reduce illness and death from diseases, leading to improved health, poverty reduction, and socio-economic development. However, many countries are challenged to provide these basic necessities to their populations, leaving people at risk for water, sanitation, and hygiene (WASH)-related diseases. Because contaminated water is a major cause of illness and death, water quality is a determining factor in human poverty, education, and economic opportunities.
Based on available literature and availability of country level information, we have included access basic drinking water services (as an indicator of availability of water), per capita GDP (as income level of the country), Human Development Index (HDI) score (as composite measure of Human Development) as pssoible indicators influencing basic access to hand washing facilities.
3. Methodology and Data Sources
A two-way fixed-effects model is used to understand the factors influencing access to basic hand washing facilities. In panel data framework, the relationship between access to basic hand washing facilities and other country-specific indicators can be presented as follows:
𝑙ℎ𝑎𝑛𝑑𝑤𝑎𝑠ℎ𝑖𝑡 = 𝛼 + 𝛽1𝑙𝑏𝑎𝑠𝑖𝑐𝑑𝑤𝑖𝑡+ 𝛽2𝑙𝑝𝑐𝑔𝑑𝑝𝑖𝑡+ 𝛽3𝑙𝑝𝑐𝑔𝑑𝑝𝑖𝑡2 + 𝛽4𝑙ℎ𝑑𝑖𝑖𝑡+ 𝛾𝑖+ 𝜑𝑡+ 𝜖𝑖𝑡 (1)
Where,
lhandwashit Logarithm of People with basic handwashing facilities including soap and water
(% of population) of the ith country in the tth year
lbasicdwit Logarithm of People using at least basic drinking water services (% of population)
of the ith country in the tth year
lpcgdpit Logarithm of GDP per capita, PPP (current international $) of the ith country in
the tth year
lhdisit Logarithm of Human Development Index Score of the ith country in the tth year
γi Unobservable state-specific effects
φt Time-specific effects common to all states
εit Disturbance term
2
https://sswm.info/arctic-wash/module-1-introduction/further-resources-sustainability-relation-water-sanitation/water%2C-sanitation-and-development (last accessed on 10 April 2020).
3.1 Data Sources
WHO/UNICEF Joint Monitoring Programme (JMP) for Water Supply, Sanitation and Hygiene (WASH) captures country-level information on percentage of people living in households that have a handwashing facility with soap and water available on the premises. World Development Indicator (WDI) database of the World Bank compile and disseminate the information in a single platform along with other indicators. WHO/UNICEF defines a basic handwashing facility as a device to contain, transport or regulate the flow of water to facilitate handwashing with soap and water in the household. Handwashing facilities may be fixed or mobile and include a sink with tap water, buckets with taps, tippy-taps, and jugs or basins designated for handwashing. Soap includes bar soap, liquid soap, powder detergent, and soapy water but does not include ash, soil, sand or other handwashing agents.
It is to be noted that presence of a handwashing station with soap and water does not guarantee that household members consistently wash hands at key times, but is accepted as the most suitable proxy. Data on handwashing facilities are available for a growing number of low- and middle-income countries after hygiene questions were standardized in international surveys. However, this type of information is not available from most high-income countries, where access to basic handwashing facilities is assumed to be nearly universal.
WHO/UNICEF defines basic drinking water services as drinking water from an improved source, provided collection time is not more than 30 minutes for a round trip. Improved water sources include piped water, boreholes or tubewells, protected dug wells, protected springs, and packaged or delivered water. Country-level information on access to basic drinking water services is captured by WHO/UNICEF JMP for Water Supply, Sanitation and Hygiene and WDI database compile and disseminate the information.
Human Development Index (HDI) is a composite index measuring average achievement in three basic dimensions of human development - a long and healthy life, knowledge and a decent standard of living and it is brought out by UNDP annually for 189 countries. HDI is simple average of three indices, Life expectancy index, Education index and Gross national Income (GNI) index. Life expectancy index comprises of indicator on life expectancy at birth, Education index comprises of two indicators - expected years of schooling and mean years of schooling and GNI index comprises of GNI per capita (PPP US$).
GDP per capita based on purchasing power parity (PPP). PPP GDP is gross domestic product converted to international dollars using purchasing power parity rates. An international dollar has the same purchasing power over GDP as the U.S. dollar has in the United States. Data are in current international dollars based on the 2011 ICP round.
Except data on country-wise Human Development Index (HDI) score all other data are extracted
from the World Bank’s World Development Indicator (WDI) database. Country HDI scores are
obtained from UNDP’s HDI database.3
4. Results
4.1 Basic Statistics
We have unbalanced panel data of 94 countries for 10 years (2008 to 2017) and the basic statistics of the underlying variables are presented in Table 2. There are considerable variations in underlying variables.
Table 2: Basic Statistics
Variables Mean Minimum Maximum Std. Dev. Observations
People with basic handwashing facilities including soap and water (% of
population) (handwash)
46.68 0.88 100 32.67 721
GDP per capita, PPP (current
international $) (pcgdp) 6331.11 615.07 38790.9 6021.52 721
People using at least basic drinking water services (% of population) (basicdw)
75.51 30.37 99.93 18.11 721
Human Development Index Score
(hdis) 0.58 0.30 0.814 0.12 721
Source: Compiled and Computed based on the World Bank’s World Development Indicator (WDI) Database
Regional variation in access to handwashing facilities is presented in Table 3. It shows that out of 94 countries, together Asia (22 countries), Western Africa (15) and Eastern Africa (13) hold the largest share (53 percent). Within region, variation across counties in basic access to hand washing facilities is presented through range (difference between maximum and minimum vales) and standard deviations. Appendix I provides country-wise list of average access to basic hand washing facilities during 2008-2017. Figure 3 shows that on average Eastern Africa, Western Africa, Middle Africa and Southern Africa have lower access to handwashing facilities.
3
Table 3: Regional Variation in People with basic handwashing facilities including soap and water (% of population)
Region Mean Maximum Minimum Standard
Deviation
No. of
Observation No. of Country
Asia 70.85 100.00 27.95 19.19 167 22 Central America 84.36 90.65 76.53 4.53 49 6 Eastern Africa 16.81 50.54 0.88 13.92 115 13 Europe 93.66 97.72 86.98 4.99 25 3 Middle Africa 19.17 47.96 2.57 14.96 58 8 Middle East 71.35 94.58 47.93 20.13 23 3 Northern Africa 70.87 89.83 23.27 25.44 37 4 Oceania 47.77 82.50 25.12 26.01 12 3 South America 68.63 85.09 25.29 17.43 33 6 Southern Africa 26.33 44.60 1.96 16.89 31 4 The Caribbean 67.61 89.44 22.86 24.21 54 7 Western Africa 15.51 52.23 1.15 11.61 141 15 Grand Total 47.12 100.00 0.88 32.77 745 94
Source: Computed based on the World Bank’s World Development Indicator (WDI) Database Figure 3: Regional Variation in People with basic handwashing facilities including soap and
water (% of population): Average of 2008 to 2017
Source: Computed based on the World Bank’s World Development Indicator (WDI) Database
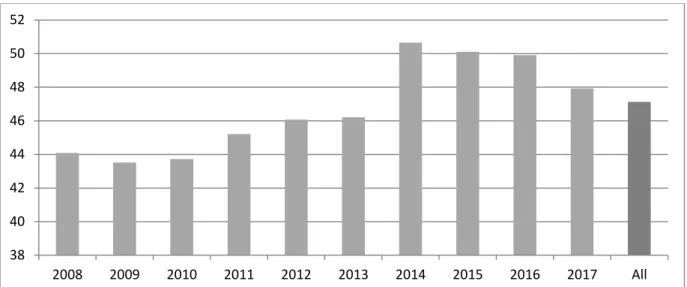
Figure 4 shows that considerable improvement in access to handwashing facilities observed during 2014-16, thereafter it is falling. Perhaps towards the end of the terminal year of
0 10 20 30 40 50 60 70 80 90 100
Millennium Development Goals (i.e., 2016), the improvement in access is observed. However, the improvement did not persists long as it falls thereafter.
Figure 4: Temporal Variation in Average of People with basic handwashing facilities including soap and water (% of population)
Source: Computed based on the World Bank’s World Development Indicator (WDI) Database 4.2 Econometric Analysis
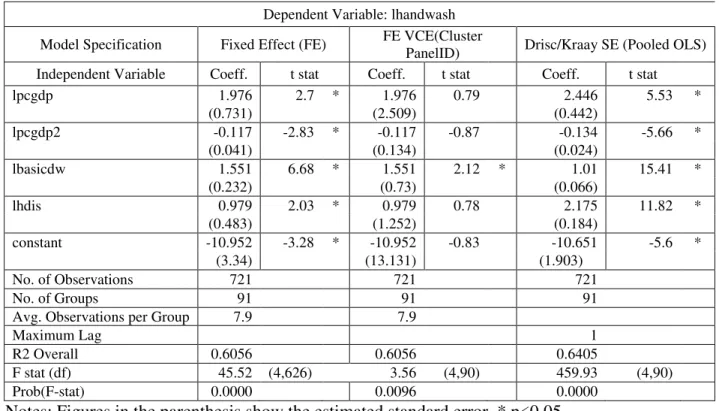
To estimate the equation 1, we run fixed effect (FE) and random effect (RE) panel data models and conduct Hausman specification test (FE over RE) to select the right model. The estimated Chi2 (df:4) of the Hausman test is 9.97 with probability 0.0409 (<0.05). This implies that the null hypothesis (Ho: difference in coefficients not systematic) can be rejected. We chose fixed effect model. We also conduct Test of over-identifying restrictions: fixed vs random effects, where estimated Sargan-Hansen statistic is 9.765 (Chi-sq, df: 4) with P-value 0.0446 (<0.05). This reconfirms that fixed effect model is the right model for our analysis.
To test the presence of heteroskedasticity, we first conduct Breusch-Pagan / Cook-Weisberg test, where estimated Chi2 (df:1) is 201.10 with P-value 0.0000. This rejects the null hypothesis (Ho: Constant variance) and confirms the presence of heteroskedasticity. We also conduct modified Wald test for group-wise heteroskedasticity in fixed effect regression model where estimated Chi2 (df:91) is 3.9e+9 with P-value 0.000. This reconfirms the presence of group-wise heteroskedasticity. At last we conduct White’ test where estimated Chi2(df:13) is 112.56 with P-value 0.000 which rejects null hypothesis (Ho: homoscedasticity) against Ha: unrestricted heteroskedasticity.
To test the presence of time series properties in our model, we test the Wooldridge test for autocorrelation in panel data, where estimated F stat (df: 1, 88) is 1022.023 with P-value 0.0000 which rejects null hypothesis (Ho: no first-order autocorrelation). Therefore, we need to make
38 40 42 44 46 48 50 52 2008 2009 2010 2011 2012 2013 2014 2015 2016 2017 All
corrections for the presence of heteroskedasticity and at least first order autocorrelation in the estimated fixed effect model.
Since we have small time series data points (T=10) as compared to cross-sectional observations (N=94) and our data is not balanced panel, we cannot use suggested panel data models (e.g., Feasible Generalized Least Square or FGLS, Panel Corrected Standard Error or PCSE) in the presence of heteroskedasticity and serial auto-correlation. One alternative approach is suggested for such model is to make correction by clustering covariance matrix using panel id (or country). The other alternative is to estimate fixed effect or pooled OLS regression with Driscoll-Kraay standard errors as suggested by Driscoll and Kraay (1998). We estimate all the possible models and the results of three models are presented in Table 4. We have not found any significant improvement in the estimated results based on Fixed Effect with Driscoll-Kraay standard errors as compared to simple Fixed Effect model, and therefore we are not reporting the result in Table 4.
Results show that there is a non-liner relationship between per capita GDP and access to handwashing facilities. As per capita GDP - a proxy for the level of purchasing power – rises, access to handwashing facilities increases, but it plateaus; if per capita GDP rises further, access to handwashing facilities falls. Access to handwashing facilities is high for countries where per capita GDP is high; after per capita GDP reaches a threshold, access to handwashing facilities starts falling. Perhaps relatively higher per capita GDP countries among low- and medium-income countries have relatively lower access to basic hand washing facilities as compared to lower per capita GDP countries. This shows that increasing per capita income may not be enough to increase the access to basic hand washing facilities. Specific policies and programmes are needed to invest in infrastructure to increase coverage of basic hand washing facilities in developing countries.
The positive relationship between access to basic drinking services and access to handwashing facilities is as per our expectation. With rising access to basic drinking water services, access to handwashing facilities improves. In other words, countries having larger coverage of basic drinking water services also have larger access to handwashing facilities. Therefore, providing basic water services may facilitate adoption of hand washing practices. In other words, improving access to hand washing facilities is contingent upon increasing access to basic water supply services.
The relationship between HDI score and access to handwashing facilities is positive and significant. It implies that countries having better position in HDI also have larger access to handwashing facilities. In other words, human development possibly drives the country to provide better access to personal hygiene facilities like handwashing. With rising education, health and better standard of living people’s demand for personal hygiene increases.
Table 4: Regressions Results
Dependent Variable: lhandwash Model Specification Fixed Effect (FE) FE VCE(Cluster
PanelID) Drisc/Kraay SE (Pooled OLS) Independent Variable Coeff. t stat Coeff. t stat Coeff. t stat lpcgdp 1.976 2.7 * 1.976 0.79 2.446 5.53 * (0.731) (2.509) (0.442) lpcgdp2 -0.117 -2.83 * -0.117 -0.87 -0.134 -5.66 * (0.041) (0.134) (0.024) lbasicdw 1.551 6.68 * 1.551 2.12 * 1.01 15.41 * (0.232) (0.73) (0.066) lhdis 0.979 2.03 * 0.979 0.78 2.175 11.82 * (0.483) (1.252) (0.184) constant -10.952 -3.28 * -10.952 -0.83 -10.651 -5.6 * (3.34) (13.131) (1.903) No. of Observations 721 721 721 No. of Groups 91 91 91
Avg. Observations per Group 7.9 7.9
Maximum Lag 1
R2 Overall 0.6056 0.6056 0.6405
F stat (df) 45.52 (4,626) 3.56 (4,90) 459.93 (4,90) Prob(F-stat) 0.0000 0.0096 0.0000
Notes: Figures in the parenthesis show the estimated standard error. * p<0.05 Source: Computed
Access to basic water supply services acts as an enabling (supply side) factor and facilitates extension of coverage of basic drinking water services. Availability of safe sources of water to supply along with economic (financial) prowess and institutional capacities could play important roles in improving access to basic water supply services. Possibly human development acts as an demand side factor where people with better health, education and standard of living demand for better access to personal hygiene. Per capita income (GDP) measures the affordability aspects of both private and public investments in basic water supply and sanitation infrastructure. There are also country specific factors which may not be necessarily captured in quantitative dimensions (e.g., socio-political factors, characteristics of public institutions, corruptions, policy environment, ease of doing business, governance, judicial systems) in regression models. However, fixed effect model captures these country specific effects in our estimated regressions. Comparison of estimated coefficients, standard errors and t-stats across alternative regression models are presented in Table 5. Improvements in estimated results through pooled OLS regression with Driscoll-Kraay standard errors are substantial.
Table 5: Comparison of Results across Regression Models Variable Legend Fixed
Effect Random Effect FE VCE(Cluster PanelID) Drisc/Kraay SE (Pooled OLS) lpcgdp Coeff. 1.976 1.702 1.976 2.446 SE 0.731 0.639 2.509 0.442 t stat 2.70 2.66 0.79 5.53 lbasicdw Coeff. 1.551 1.512 1.551 1.010 SE 0.232 0.205 0.730 0.066 t stat 6.68 7.37 2.12 15.41 lhdis Coeff. 0.979 1.100 0.979 2.175 SE 0.483 0.406 1.252 0.184 t stat 2.03 2.71 0.78 11.82 lpcgdp2 Coeff. -0.117 -0.094 -0.117 -0.134 SE 0.041 0.036 0.134 0.024 t stat -2.83 -2.61 -0.87 -5.66 constant Coeff. -10.952 -9.993 -10.952 -10.651 SE 3.340 2.930 13.131 1.903 t stat -3.28 -3.41 -0.83 -5.60 Source: Computed
4.2 Robustness of the Result
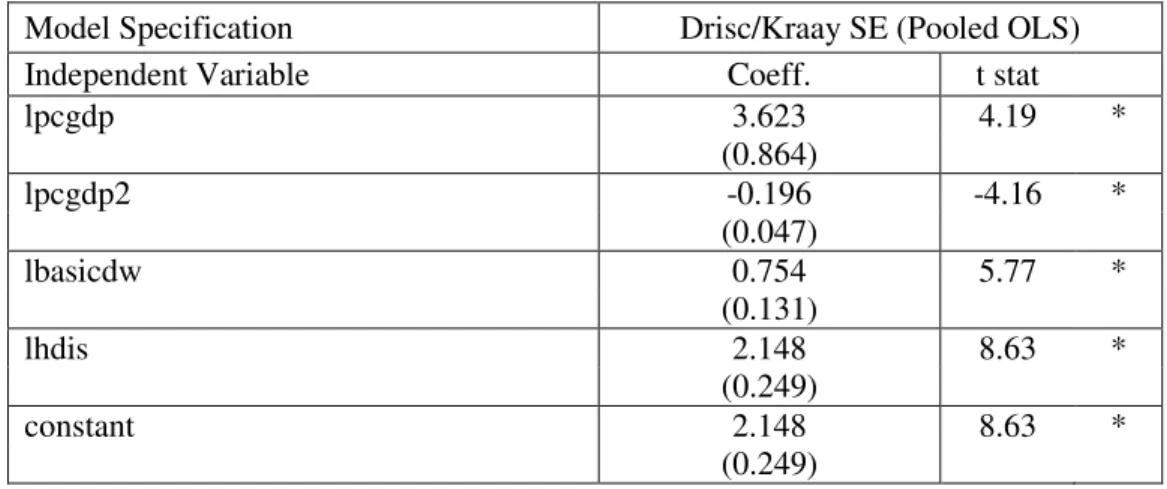
Constraints of restricted number of time series data points (T=0) and unavailability of data for all the countries for all the years (unbalanced panel) restrict us to use time series operators to test the robustness of the estimated results. Incorporating lag value of dependent variable in the list of independent variables and taking first difference of all the continuous variables are the common robustness checks which use time series operators (lag and difference). We test robustness of the estimated results by restricting number of observations to three regions, viz., Asia (22 countries), Western Africa (15) and Eastern Africa (13). These regions together hold 53 percent share in total number of countries, i.e., 94. Table 6 shows that with restriction in number of observations estimated relationship between dependent and independent variables remain changed.
Table 6: Robustness Check
Model Specification Drisc/Kraay SE (Pooled OLS)
Independent Variable Coeff. t stat
lpcgdp 3.623 4.19 * (0.864) lpcgdp2 -0.196 -4.16 * (0.047) lbasicdw 0.754 5.77 * (0.131) lhdis 2.148 8.63 * (0.249) constant 2.148 8.63 * (0.249)
No. of Observations 414 No. of Groups 49 Maximum Lag 1 R2 Overall 0.6023 F stat (df) 3621.34 (4,48) Prob(F-stat) 0.000
Notes: Figures in the parenthesis show the estimated standard error. * p<0.05 Source: Computed
5. Conclusions
Access to handwashing facility is considered basic personal hygiene practice which has positive externality in terms of public health benefits. The access to handwashing facilities is contingent upon access to safe water supply of adequate quantity and affordable price. Therefore access to safe water is basic condition to have access to handwashing facility.
Results of the study show that there is a non-liner relationship between per capita GDP and access to handwashing facilities. As per capita GDP - a proxy for the level of purchasing power – rises, access to handwashing facilities increases, but it plateaus; if per capita GDP rises further, access to handwashing facilities falls. Access to handwashing facilities is high for countries where per capita GDP is high; after per capita GDP reaches a threshold, access to handwashing facilities starts falling. Perhaps relatively higher per capita GDP countries among low- and medium-income countries have relatively lower access to basic hand washing facilities as compared to lower per capita GDP countries. This shows that increasing per capita income may not be enough to increase the access to basic hand washing facilities. Specific policies and programmes are needed to invest in infrastructure to increase coverage of basic hand washing facilities in developing countries.
The positive relationship between access to basic drinking services and access to handwashing facilities is as per our expectation. With rising access to basic drinking water services, access to handwashing facilities improves. In other words, countries having larger coverage of basic drinking water services also have larger access to handwashing facilities. Therefore, providing basic water services may facilitate adoption of hand washing practices. In other words, improving access to hand washing facilities is contingent upon increasing access to basic water supply services.
The relationship between HDI score and access to handwashing facilities is positive and significant. It implies that countries having better position in HDI also have larger access to handwashing facilities. In other words, human development possibly drives the country to provide better access to personal hygiene facilities like handwashing. With rising education,
Access to basic water supply services acts as an enabling (supply side) factor and facilitates extension of coverage of basic drinking water services. Availability of safe sources of water to supply along with economic (financial) prowess and institutional capacities could play important roles in improving access to basic water supply services. Possibly human development acts as an demand side factor where people with better health, education and standard of living demand for better access to personal hygiene. Per capita income (GDP) measures the affordability aspects of both private and public investments in basic water supply and sanitation infrastructure. There are also country specific factors which may not be necessarily captured in quantitative dimensions (e.g., socio-political factors, characteristics of public institutions, corruptions, policy environment, ease of doing business, governance, judicial systems) in regression models. However, fixed effect model captures these country specific effects in our estimated regressions.
References
Aiello, A.E., R.M. Coulborn, V. Perez and E.L. Larson (2008), “Effect of hand hygiene on infectious disease risk in the community setting: a meta-analysis”, Am. J. Public Health, 98: 1372-1381.
Assefa, M. and A. Kumie (2014), “Assessment of factors influencing hygiene behaviour among
school children in Mereb-Leke District, Northern Ethiopia: a cross-sectional study”, BMC Public Health, 14: 1000. doi: 10.1186/1471-2458-14-1000
Biran, A., T. Rabie, W-P Schmidt, S. Juvekar, S. Hirve and V. Curtis (2008), “Comparing the performance of indicators of hand-washing practices in rural Indian households”, Trop Med Int Health, 13: 278–285.
Biran A., W-P Schmidt, R. Wright, T. Jones, M. Seshadri, P. Isaac, N.A. Nathan, P. Hall, J. McKenna, S. Granger, P. Bidlinger and V. Curtis (2009), “The effect of a soap promotion and hygiene education campaign on handwashing behavior in rural India: a cluster randomized trial”, Trop Med Int Health, 14: 1303-1314.
Bowen A., H. Ma, J. Ou, W. Billhimer, T. Long, E. Mintz, R.M. Hoekstra and S. Luby (2007),
“A cluster-randomized controlled trial evaluating the effect of a handwashing-promotion program in Chinese primary schools”, Am J Trop Med Hyg, 76: 1166–1173.
Brandon, Carter and Hommann, Kirsten (1995), “The Cost of Inaction: Valuing the Economy-Wide Cost of Environmental Degradation in India”, Paper presented at the ‘Modelling
Global Sustainability’ conference held in United Nations University, Tokyo, October
Burton, M., E. Cobb, P. Donachie, G. Judah and V. Curtis (2011), “The effect of handwashing with water or soap on bacterial contamination on hands”, Int J Environ Res Public Health, 8: 97-104.
Cairncross, S., C. Hunt, S. Boisson, K. Bostoen, V. Curtis, I.C. Fung, W-P Schmidt (2010),
“Water, sanitation and hygiene for the prevention of diarrhea”, Int J Epidemiol, 39: i193– i205.
Curtis, V.A., L.O. Danquah and R.V. Aunger (2009), “Planned, motivated and habitual hygiene behaviour: an eleven country review”, Health Education Research, 24: 655- 673.
Curtis, V., W-P Schmidt, S. Luby, R. Florez, O. Touré and A. Biran (2011), “Hygiene: new hopes, new horizons”, Lancet Infect Dis, 11: 312–321.
Driscoll, J.C. and A.C. Kraay (1998), “Consistent covariance matrix estimation with spatially dependent panel data”, Review of Economics and Statistics, 80: 549-560.
Dube, B. and J. January (2012), “Factors Leading to Poor Water Sanitation Hygiene among
Primary School Going Children in Chitungwiza”, Journal of Public Health Africa, 3(1):e7. doi: 10.4081/jphia.2012.e7
Ejemot, R., J. Ehiri, M. Meremikwu and J. Critchley (2008), “Hand washing for preventing diarrhea”, Cochrane Database of Systematic Reviews, CD004265. DOI: 10.1002/14651858.CD004265.pub2.
Greene , L.E., M.C. Freeman, D. Akoko, S. Saboori, C. Moe, and R. Rheingans (2012), “Impact
of a school-based hygiene promotion and sanitation intervention on pupil hand
contamination in Western Kenya: a cluster randomized trial”, American Journal of Tropical Medicine and Hygiene, 87(3): 385–393.
Hammond B., Y. Ali, E. Fendler, M. Dolan and S. Donovan (2000), “Effect of hand sanitizer use on elementary school absenteeism”, American Journal of Infection Control, 28, 340– 346.
Lopez-Quintero, C., P. Freeman and Y. Neumark (2009), “Hand washing among school children
in Bogota, Colombia”, Research and Practice, 99: 94–100.
Mehta, Lyla (2006), "Water and human development: capabilities, entitlements and power", Occasional Paper 2006/9, Human Development Report Office, UNDP. Available at: http://hdr.undp.org/sites/default/files/mehta_l_rev.pdf (last accessed on 10 April 2020).
Mukherjee, S. and D. Chakraborty (2017), “Demand for infrastructure investment for water
services: key features and assessment methods”, in Jullien Chaisse (ed.), Charting the Water Regulatory Future: Issues, Challenges and Directions, Chapter 13, pp. 257-296, Edward Elgar: U.K. & U.S.A.
Mukherjee, S. and Xavier Leflaive (2018), “Concept Note on Cost Recovery in Indian Water
Sector”, Available at: https://www.eip
-water.eu/sites/default/files/Concept%20Note%20on%20Costs%20Recovery%20in%20W ater%20Sector-Cleaned-Final-rev.pdf (last accessed on 10 April 2020)
Pickering, A.J., A.B. Boehm, M. Mwanjali and J. Davis (2010a), “Efficacy of waterless hand hygiene compared with handwashing with soap: a field study in Dar es Salaam, Tanzania”, American Journal of Tropical Medicine and Hygiene, 82: 270– 278.
Pickering, A.J., J. Davis, S.P. Walters, H.M. Horak, D.P. Keymer, D. Mushi, R. Strickfaden, J.S. Chynoweth, J. Liu, A. Blum, K. Rogers and A.B. Boehm (2010b), “Hands, water, and health: fecal contamination in Tanzanian communities with improved, non-networked water supplies”, Environ Sci Technol, 44: 3267–3272
Pickering, A.J., T.R. Julian, S. Mamuya, A.B. Boehm and J. Davis (2010c), “Bacterial hand contamination among Tanzanian mothers varies temporally and following household activities”, Trop Med Int Health, 00: 1–7.
Rabie, T. and V. Curtis (2006), “Handwashing and risk of respiratory infections: a quantitative systematic review”, Tropical Medicine and International Health, 11: 258-267.
Rajaraman, D., K.S. Varadharajan, K. Greenland, V. Curtis, R. Kumar, W-P Schmidt, R. Aunger and A. Biran (2014), “Implementing effective hygiene promotion: lessons from the
process evaluation of an intervention to promote handwashing with soap in rural India,”
BMC Public Health, 14: 1179.
Talaat, M., S. Afifi, E. Dueger, N. Ashry, A. Marfin, A. Kandeel, E. Mohareb and N. El-Sayed (2011), “Effects of hand hygiene campaigns on incidence of laboratory-confirmed influenza and absenteeism in schoolchildren, Cairo, Egypt”, Emerg Infect Dis, 17: 619– 625.
UNICEF (2010), “Raising Clean Hands: Advanced Learning, Health and Participation through
WASH in Schools”, New York: UNICEF.
Water and Sanitation Program (WSP) (undated), "The Economic Impacts of Inadequate Sanitation in India", The World Bank: New Delhi.
White, C., R. Kolble, R. Carlson, N. Lipson, M. Dolan, Y. Ali and M. Cline (2003), “The effect of hand hygiene on illness rate among students in university residence halls”, American
Appendix I: List of Countries
Note: handwash - People with basic handwashing facilities including soap and water (% of population) – Average 2008-2017
Sl.No. Country Name Region handwash Obs. Sl.No. Country Name Region handwash Obs. Sl.No. Country Name Region handwash Obs. 1 Afghanistan Asia 37.6 10 33 Gambia, The Western Africa 7.6 10 65 Nigeria Western Africa 24.3 10 2 Algeria Northern Africa 83.4 9 34 Ghana Western Africa 26.0 10 66 Pakistan Asia 59.7 9 3 Angola Middle Africa 25.7 6 35 Guatemala Central America 76.6 7 67 Paraguay South America 79.5 4
4 Armenia Asia 89.3 10 36 Guinea Western Africa 12.2 10 68 Philippines Asia 78.4 4
5 Azerbaijan Asia 83.2 4 37 Guinea-Bissau Western Africa 6.5 10 69 Rwanda Eastern Africa 4.2 10 6 Bangladesh Asia 37.4 10 38 Guyana South America 77.1 8 70 Sao Tome and Principe Middle Africa 41.8 8 7 Barbados The Caribbean 88.5 9 39 Haiti The Caribbean 24.1 10 71 Senegal Western Africa 18.8 10 8 Belize Central America 83.4 10 40 Honduras Central America 84.0 9 72 Serbia Europe 97.7 7 9 Benin Western Africa 8.5 10 41 India Asia 59.4 4 73 Sierra Leone Western Africa 15.0 10
10 Bhutan Asia 79.5 7 42 Indonesia Asia 71.1 10 74 Solomon Islands Oceania 35.7 4
11 Bolivia South America 25.3 4 43 Iraq Middle East 92.0 10 75 Somalia Eastern Africa 9.7 7 12 Bosnia and Herzegovina Europe 97.0 9 44 Jamaica The Caribbean 66.4 8 76 South Africa Southern Africa 43.8 4 13 Burkina Faso Western Africa 10.8 10 45 Kazakhstan Asia 97.9 7 77 St. Lucia The Caribbean 87.2 9 14 Burundi Eastern Africa 6.1 10 46 Kenya Eastern Africa 19.2 8 78 Sudan Northern Africa 23.3 8 15 Cambodia Asia 65.6 10 47 Kyrgyz Republic Asia 89.2 10 79 Suriname South America 67.8 7 16 Cameroon Middle Africa 6.0 8 48 Lao PDR Asia 49.6 4 80 Syrian Arab Republic Middle East 70.6 4 17 Central African Republic Middle Africa 16.5 7 49 Lesotho Southern Africa 2.0 8 81 Tajikistan Asia 72.5 10 18 Chad Middle Africa 5.7 7 50 Liberia Western Africa 1.2 9 82 Tanzania Eastern Africa 47.5 6 19 Colombia South America 65.2 4 51 Madagascar Eastern Africa 46.1 8 83 Thailand Asia 83.9 4 20 Comoros Eastern Africa 15.6 9 52 Malawi Eastern Africa 10.8 10 84 Timor-Leste Asia 28.1 4 21 Congo, Dem. Rep. Middle Africa 4.3 10 53 Maldives Asia 95.8 4 85 Togo Western Africa 10.1 10 22 Congo, Rep. Middle Africa 47.8 4 54 Mali Western Africa 32.1 9 86 Trinidad and Tobago The Caribbean 89.4 2 23 Costa Rica Central America 83.8 8 55 Marshall Islands Oceania 82.5 4 87 Tunisia Northern Africa 84.0 10 24 Cote d'Ivoire Western Africa 19.4 10 56 Mauritania Western Africa 26.9 10 88 Turkmenistan Asia 93.1 10 25 Cuba The Caribbean 85.2 8 57 Mexico Central America 87.8 7 89 Uganda Eastern Africa 12.1 10 26 Dominican Republic The Caribbean 54.7 8 58 Moldova Europe 87.2 9 90 Vanuatu Oceania 25.2 4
27 Ecuador South America 82.1 6 59 Mongolia Asia 71.1 10 91 Vietnam Asia 85.5 10
28 Egypt, Arab Rep. Northern Africa 84.5 10 60 Mozambique Eastern Africa 11.9 8 92 Yemen, Rep. Middle East 48.7 9 29 El Salvador Central America 90.4 8 61 Myanmar Asia 79.4 6 93 Zambia Eastern Africa 13.4 9 30 Equatorial Guinea Middle Africa 23.2 8 62 Namibia Southern Africa 43.1 9 94 Zimbabwe Eastern Africa 33.3 10
31 Eswatini Southern Africa 23.7 10 63 Nepal Asia 53.7 10