Classification of Physiological Signals for
Emotion Recognition using IoT
Sadhana Tiwari
Information Technology Department Indian Institute of Information Technology
Allahabad Prayagraj, India [email protected]
M. Syafrullah
Program of Master of Computer Science Universitas Budi Luhur, Indonesia mohammad.syafrullah@budiluhur. ac.id
Sonali Agarwal
Information Technology Department Indian Institute of Information Technology
Allahabad Prayagraj, India [email protected]
Krisna Adiyarta
Program of Master of Computer Science Universitas Budi Luhur, Indonesia
Abstract— Emotion recognition gains huge popularity now a days. Physiological signals provides an appropriate way to detect human emotion with the help of IoT. In this paper, a novel system is proposed which is capable of determining the emotional status using physiological parameters, including design specification and software implementation of the system. This system may have a vivid use in medicine (especially for emotionally challenged people), smart home etc. Various Physiological parameters to be measured includes, heart rate (HR), galvanic skin response (GSR), skin temperature etc. To construct the proposed system the measured physiological parameters were feed to the neural networks which further classify the data in various emotional states, mainly in anger, happy, sad, joy. This work recognized the correlation between human emotions and change in physiological parameters with respect to their emotion.
Keywords—Emotion recognition, ECG, GSR, physiological signals, neural networks.
I. INTRODUCTION
Emotions affect physiological and psychological status of a human being and having a crucial significance on human being. Emotions also have effects on the human health and efficiency in work, as positive emotion will improve them and negative emotions can deteriorate them. Accumulation of negative emotions for a long time can cause very drastic effects on a person’s life.
”
Emotion generally refer to a mental condition which arises spontaneously without any self-aspiration, and followed by some physical, psychological and physiological changes. They generally affect the central nervous system (CNS) of human body and can arouse changes in facial expressions, voice, blood flow, skin etc.
Motivation
Since there is complex mutual interaction of physiological and psychological features in emotions, precise and on time recognition of human emotions is very limited to knowledge of humans. Although a great deal of work have been made already, still it is a topic of prominent scientific research.
Emotion recognition is being applied in multiple areas like health-care (majorly in mental health), safer driving, social-security, and many more. Generally, methods of emotion recognition can be portioned into two broad categories: ● Using physical signals like facial speech, expression, posture, gesture, etc.
● Using physiological signals-which includes temperature (Tb), Electroencephalogram (EEG), Galvanic skin response (GSR), Electrocardiogram (ECG), Electromyogram (EMG), Respiration (RSP), etc.
Limitations of prior method is that it is less reliable since the physical signals can be voluntarily controlled like facial expressions and speech to hide their real emotions.
This paper emphasizes on recognition of emotional change of human being due to change in physiological signals and physical responses. A novel classification mechanism for physiological signal is developed with the help of artificial neural network (ANN) classifier.
The related work done so far in the area of emotion recognition is described in section II. Section III, discusses the proposed methodology, and section IV emphasizes on implementation, experimental setup and results. The last section V presents the conclusion part of the paper.
II. RELATED WORK
Physiological signals and psychological parameters majorly concerned factors for emotion recognition of human being. Physiological data is collected using ECG and GSR sensor. To extract relevant features collected data must be pre-processed and then classified with the help of suitable classifier.
Xingxing Zhang[1] and his colleagues propose a nonlinear comprehensive model to process the feature extractions and classification of emotions by using multichannel physiological Signals datasets. To extract out the information of the features, the data is mapped to higher dimensional space. Kernel Principal Component Analysis (KPCA) was used. The authors used various physiological signals including “ECG, GSR, facial EMG and PPG”. The
kernel was radial basis function (RBF).The algorithm is KPCA. They proposed different models for classification and measured the accuracy for all the models. The authors experimented on the 29 participants and the classification accuracy of four emotions came out to be 93.42%. The performance of all classifiers which works on dimension reduction methods, is not good on physiological signals. KPCA significantly improved the classifier performance but the combination of KPCA with “Gradient Boosting Decision Tree” (GBDT) such as nonlinear ensemble classifier could further improve the efficiency.
In an another research work, Hany Ferdinando [2] and his colleagues propose a method to identify certain Standard features that are derived from ECG signal and from heart rate variability (HRV) signals. In emotion recognition, these features are used. The authors have transferred emotions, such as fear, anger instead of using discrete emotions as labels,” to an arousal-valence space. ” The authors have used the MAHNOB database. Feature extraction was performed using root mean square (RMS) R-R intervals (RMSSD). The emotional keywords were divided into different classes and each class was part of either Arousal scale or valence scale. Arousal scale had medium arousal, calm and excited classes and neutral, pleasant and unpleasant were in valence scale. The authors used SVM classifier with RBF kernel for classification of the emotions. The average efficiency for arousal scale is 47.69% and for valence scale is 42.55%. If we observe that the accuracy is not high enough as they have used the SVM classifier. There is still scope for improvement in the accuracy. A better classifier could be used to improve the efficiency. A research paper [3], discussed a method to recognize the emotions using a multivariate correlation model. The detection of affective physiological pattern in multi-subject HR, GSR is done by random matrix theory (RMT). This correlation analysis has been done to find the similarity between physiological signals. The authors used three kinds of data: First type of data was the physiological signals acquired including Electrocardiographic signal and Galvanic Skin Response, Second type of data was the video recordings of facial expressions, Third type of data acquired was the status arm movement. The authors have used various algorithm to find the similarity between physiological data such as the multi-variant correlation method, Physiological Time Series and Their Correlation Matrix. Emotional recognition has been done in three parts. Affective Physiological Change Locating Affective Feature Extraction and Affective Data Classification. The authors obtained the accuracy of 74%. Although in real scenarios like one emotion is aroused by other emotion, we could see the decrement in the accuracy.
The deep learning approach using a deep CNN for emotion recognition on a AMIGOS dataset (ECG and GSR) proposed by Luz Santamaria-Granados and his team [4]. AMIGOS has combined datasets. The first datasets includes 40 people were shown 16 videos (approx. 250 s) whereas the second: - 17 people were shown videos individually and 5 groups were made each containing 4 people. They were shown 4 videos (approx. 14 min). Physiological signals
were captured from the subjects in both datasets. The emotional state is determined by correlating these physiological signals with the data of arousal and valence. It uses a CNN for extracting features from physiological signals automatically to predict emotional state.
C. Godin [5] determined which features from physiological sensors were relevant for emotional state prediction. DEAP and MAHNOB datasets which were available freely were used by them. DEAP and MANHOB databases contain behavioral as well aphysiological data of participants who were shown small videos of duration 1 min. For MAHNOB they considered Galvanic Skin Responses (GSR), Electrocardiogram (ECG) readings and for DEAP Photoplethysmogram (PPG) reading was considered. The sampling frequency at which DEAP signals were acquired was 512 Hz which were then sampled down to 128 Hz and MANHOB signals were acquired at sampling frequency of 256 Hz which were then also sampled down to 128 Hz.The GSR related features were found to be the only ones relevant.
Mandeep Singh and Abdullah Bin Queyam [6] tried to find the correlation between Heart rate, GSR and drivers stress level during traffic condition. They extracted useful features from raw physiological signals available at PHYSIONET website. The most relevant features from these database were selected and processed using open source software. The outcome was that the Mean Hand GSR and Mean Heart rate were strongly correlated with the change in the traffic conditions.17 drivers were taken as subjects but only 10 of them were able to provide the complete datasets. They then classified the stress in three scenarios: Scenario 1 and Scenario 2 had step change in traffic while Scenario 3 had gradual change in traffic Conditions. Out of 10 drive’s only 9 showed that the correlation results obtained in Scenario 3 were always dominant than previous two cases. ” Thus when a driver goes from high to low level of traffic his stress level changes gradually.
The model proposed in [7, 8] discussed the design specifications and software implementation of a physiological signal-based user-independent emotion recognition system. This system has various utilities over medical and smart home issues. According to author there are many challenges in constructing such a system, so this field needs a lot of contribution. The proposed system works as a user-independent system, which would gather the physiological signals from the subjects. Various physiological signals such as heart rate (HR), skin temperature, electrocardiogram (ECG), galvanic skin response (GSR), Electromyography (EMG), respiration rate (RR), diastolic and systolic blood pressure(DSBP) were measured and this gathered data went through pre-processing, extraction of features and statistical analysis subset of the physiological parameters were taken in final system because of the technical limitation and design constraint. Using statistical analysis system was able to classify emotions into, anger, joy and neutral.
”
In this paper [9], Byoung-Jun Park and his colleagues suggested a method to recognise negative emotions using
physiological signals. To do this, emotional stimuli such as some negative emotional movie clippings and suitable environment are used to induce emotions in a person. A vector consisting of all attributes is extracted using the physiological signals that they get. EDA, SKT, ECG and PPG are measured as attributes of physiological signals of an emotion. 28 features are calculated after analysis. The algorithm uses physiological signals such as Electro dermal activity, SKT, ECG and PPG for feature extraction and then machine learning algorithms such as CART, kNN and Naive Bayes algorithms are used. In the future work, the comparison should be made using various machine learning algorithms and other basic emotions should be combined. Chuan-Yu Chang [10] and Basu [11] propose a physiological angry emotion detection method. Facial expressions can be controlled to a certain extent and hence can cause inaccuracy in results. Four physiological signals are collected including ECG, GSR, Blood volume pulse and pulse and a specifically designed emotion induction experiment is conducted. Results are then used for Support Vector Regression. The Electrocardiogram readings are taken using the three-electrode approach from both wrists and the right ankle. The GSR is attached to the index and middle fingers of the hand. The blood volume pulse was measured from an infrared sensor attached to the middle finger. The piezoelectric sensor to study pulse was attached to the ring finger.
The method proposed by Sander Koelstra, Mohammad Soleymani et. al. [12], presented a multi-nodal dataset for analysis of human affective states .EEG (electroencephalogram) and peripheral physiological signals of 32 users were recorded under this experiment. Each participant was shown 41 minutes of music videos and then they were asked to rate the videos in the terms of various levels of arousal, valence, like/dislike, dominance and familiarity. The external stimuli were collected from last.fm in two form first by automated tagging that is present in the website itself and other by manually selecting videos based on certain emotional tags. The participants were shown these videos and their physiological parameters were recorded and they were also asked to manually record their arousal, valence, dominance, liking and disliking. The dataset is publicly available for researchers to conduct their own experiments in the field of emotional state analysis and others. ”
III. PROPOSED WORK
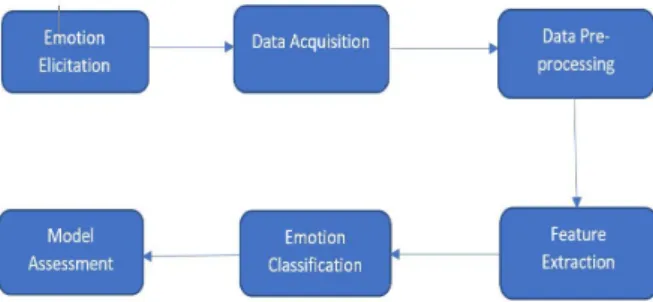
An experimental setup is established for measuring the physiological signals to detect emotional state of users. Flow diagram of proposed methodology depicted in fig [1].
Fig 1. Flow diagram of the model These are the steps of proposed work:
i. First set up the machine and connect the sensors with MySignals kit.
ii. Then make the user/subject aware about the setup, and then we ask subject to wear the sensors, and we confirm the correct working of sensor.
iii. In starting of the experiment the subject is asked to fill a web form asking personal details.
iv. After filling the form one by one each video plays, and the readings are continuously stored, along with the timestamp for each video. After watching each video, the subject has to fill a form which confirms the emotional state they were in during the video.
v. The form contains ratings for 6 emotions ranging from 1-5, 1 being least level of emotion experienced and 5 being the maximum level of feelings.
vi. From the collected data, relevant feature were extracted and then artificial neural network classifier (ANN) is used to classify the data to detect human emotion.
IV. EXPERIMENTAL SETUP AND RESULTS A. Experimental setup
The experiment was arranged in a closed and quiet room (fig [2]). To make the data collection more accurate, all the experiment work was performed in same environmental conditions for all participants. The Physiological signals ECG, GSR were recorded using MySignals toolkit. MySignals is a development platform for medical devices and e-Health applications. It is a multichannel physiological signal recorder which measures more than 15 different biometric parameters. A MySignals toolkit consists of Arduino board and different sensors port. ECG collection used MySignals HW kit, three wired ECG sensor with 3 electrodes. The two electrodes were attached to the chest whereas the third electrode was attached to side regions of Navel. The sensor was connected to MySignals HW kit (includes Arduino) which was controlled by Arduino SDK, the data collected from the sensor was recorded and sent to the computers to which the kit was attached and was recorded on a “.txt” file for each of the participants. GSR collection used Skin Resistance Sensor consisting of MySignals HW kit and two non-polarized electrodes which were attached to the index finger and middle finger through bandages. The baud rate was set at 115200 Hz. Besides, we
used two computers fully equipped with all the necessities and a set of working earphones.
Fig 2. Experimental setup B. Data Acquisition
To obtain a good quality dataset of physiological signals, a specific setup was made for performing the experiment i.e. experimental instruments setting, selection of participants, choice of emotion induced videos and the establishment of experiment scene. We selected the videos for the elicitation of different emotions: anger, happiness, sadness and fear. The videos were selected by each group member from the online databases of films and videos (YouTube). The criteria for the video selection were ratings and comments of online audience. A total of 18 videos (4-5 for each emotion) were selected. The length of videos varied from 2-5 min. The participants include 15 students from same batch. They age from 20-22 years. During the video play, the physiological parameters : Heart rate, Galvanic skin response(GSR), ECG signals were recorded using MySignals toolkit, from each volunteer, also a feedback form after each video was provided for the participants to fill the level of each emotion they experienced during the course of that particular video. The response of emotional states was gathered from each subject.
C. Raw Data
The raw data was collected for each user and stored in the computer, contains three files:
1. RollNo_GSR.txt: File containing raw values of GSR data coming directly from the MySignals kit.
2. RollNo_ECG.txt: File containing raw values of ECG data coming directly from the MySignals kit.
3. RollNo_Feed_Back.csv: File containing the responses of each user for every video.
D. Data Pre- processing
Following are the important steps for data pre-processing. i. Since the raw data also contains the data which was
not in our timestamps of each video, so the first step of ours was to remove the unwanted data.
ii. Raw data from the sensors contained extra contents which was useless for our project hence the raw data was cleaned before feature extraction.
iii. The noise was detected in the data with the help of regular expressions in python and were removed. iv. Raw data of GSR contained time stamps for each
reading which was removed as it was useless.
v. Some missing readings were also corrected using the mean of the data for that particular video.
vi. After cleaning the files they were further processed for feature extraction.
E. Feature Extraction By ANN
Since feature extraction is used for dimensionality reduction, where we reduce initial set of raw variables to more manageable groups (features) for further processing, also the new groups could still completely and accurately describe the original data set.
The first step of ANN classifier is feature extraction which identify the important features from the GSR and ECG signals, belongs to the different emotion classes like angry, fear, happy and sad. After selecting the relevant features, the ANN classifier will classify the data into different classes and plot a graph which shows that the particular subject belongs to which class.
Feature Extraction for GSR signals
For different type of emotion the values of GSR changes accordingly -
i. Fear cause the GSR activity to rise.
ii. Increase in GSR activity is also linked to feelings of anger.
iii. There is a slight increase in GSR activity for the feeling of disgust.
iv. There is a significant increase in GSR activity associated with the happy emotions.
v. There are not definitive conclusions for the effect of surprise on GSR activity as such, but it increases slightly.
vi. GSR activity associated with sadness is bit more complex such as Sadness associated with crying -Increase in GSR activity in the body, and Sadness not associated with crying - Decrease in GSR activities. We get raw data from the GSR sensor, and get the following features extracted from the data – Mean, Median, Standard deviation, Minimum reading, Maximum reading, Max Ratio, Min Ratio.
Feature Extraction for ECG signals
Electrocardiogram (ECG) is a plot of voltage versus time of the electrical activity that is associated with the heart. The process of producing ECG is known as electrocardiography and is done with the help of electrodes that are placed on the skin of the person. The electrodes are assign to detect the small electrical changes that are due to polarization followed by repolarization of cardiac muscles in each cardiac cycle i.e. Heartbeat.
Fig 3. R-R interval
Detecting QRS complex in ECG processing is very important step, since its amplitude is higher compared to P and T waves and it is used in detection of R peak which is used to find the heart rate of the person. Thus we have RR interval (fig [3]) and get the statistical features in form of Mean, Median, Standard deviation.
F. Emotion recognition
A very popular method under the category of supervised learning is Artificial Neural Network (ANN). ANN classifier is the combination of input, output and hidden layer network including some weights with every connection. The performance of ANN can be improved by adjusting and updating the weights of each connection. These are major steps of algorithm used for emotion recognition of user.
1. For the classification of emotions, we have used Artificial Neural Network.
2. Since we have four different emotions to be classified, the total number of output nodes are
3. There are total 14 features in the dataset, thus input layer contains 14 nodes.
4. K (k = 10) fold cross validation method is used to calculate the accuracy.
G. Results
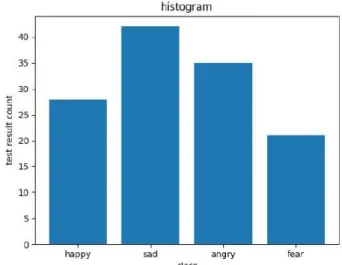
The accuracy of the classifier was calculated on the basis of the accurate emotion recognition of each subject from the physiological signals and compared with the label of the video. Each person rated the video in the form of responses. The response form contains ratings for emotions ranging from 1-5, 1 being least level of emotion experienced and 5 being the maximum level of feelings. On the basis of results provided by the classifier, the predicted emotional state of each individual subject represented in form of graph (fig [4]).The graph shows the 4 major classes of emotional states i.e. happy, sad, angry, fear on behalf of emotion status change while the subjects watching the different kind of videos.
Fig 4. Count of each emotion as predicted by the model The comparison of the emotions recognized and the emotions response gathered by each subject was done to find the accuracy using ANN classifier which can be seen in screen shot (fig [5]).Mean Accuracy of the Model we obtained is 75.38 % and Standard deviation of the model accuracy is 11.38 % (fig. [5]).
Fig 5. Accuracy computation V. CONCLUSION AND FUTURE SCOPE
This paper shows the relationship between human emotions and their various physiological parameters. The readings of users/subjects through MySignals toolkit after displaying them a set of different (sad, happiness, relaxed etc.) videos are collected. These videos were shown individually. After data pre-processing the relevant features were identified and then classified into different classes such as happy, sad, anger, fear, surprise, and disgust with the help of ANN classifier. By using experimental results, all the subjects falls into some particular class, through which their emotional state can be recognized.The Comparison between emotions recognized and the emotions response collected by feedback response of each subject was performed to find the accuracy. Mean Accuracy of the Model is 75.38 % and Standard deviation of the model accuracy is 11.38 %.
We can enhance the efficiency of the model by adding more physiological signals. Different classifiers can also be applied to evaluate and compare the performance of the data. For emotional state recognition other complex classification techniques can be used to obtain the better result.
ACKNOWLEDGEMENT
This research supported by “ASEAN- India Science & Technology Development Fund (AISTDF)”, SERB, Sanction letter no. – IMRC/AISTDF/R&D/P-6/2017. Authors are thankful to AISTDF for providing us required fund for the research. Authors are also thankful to the authorities of “Indian Institute of Information Technology, Allahabad at Prayagraj”, for providing us infrastructure and necessary support
.
We are also immensely grateful to Lakshya Khattar, Divy Vaishnav, Akash Dixit, Ashutosh, and Rohit Kumar for their active contribution and support in fulfillment of this work.REFERENCES
[1] Zhang, X.; Xu, C.; Xue, W.; Hu, J.; He, Y.; Gao, M. Emotion Recognition Based on Multichannel Physiological Signals with Comprehensive Nonlinear Processing. Sensors 2018, 18(11), 3886; 11 November 2018.
[2] Ferdinando, Hany & Ye, Liang & Seppänen, Tapio & Alasaarela, Esko. (2014). Emotion Recognition by Heart Rate Variability. Australian Journal of Basic and Applied Sciences.8. 50-55. 2014. [3] W. Wen, G. Liu, N. Cheng, J. Wei, P. Shangguan and W. Huang,
"Emotion Recognition Based on Multi-Variant Correlation of Physiological Signals," in IEEE Transactions on Affective Computing , vol. 5, no. 2, pp. 126-140, 1 April-June 2014.
[4] L. Santamaria-Granados, M. Munoz-Organero, G. Ramirez-González, E. Abdulhay and N.Arunkumar, "Using Deep Convolutional Neural Network for Emotion Detection on a Physiological Signals Dataset (AMIGOS)," in IEEE Access , vol. 7, pp. 57-67, 2019.
[5] Godin, Christelle & Prost-Boucle, F & Campagne, Aurélie & Charbonnier, Sylvie & Bonnet, Stéphane & Vidal, A. (2015). Selection of the most relevant physiological features for classifying emotion. PhyCS 2015 - 2nd International Conference on Physiological Computing Systems, Proceedings.
[6] Mandeep Singh, Abdullah Bin Queyam,”Correlation between Physiological Parameters of Automobile Drivers and Traffic Conditions”, Volume-5 Number-2 December 2013 pp.6-12 ISSN: 0973-73832.
[7] S. Hassani, I. Bafadel, A. Bekhatro, E. A. Blooshi, S. Ahmed and M. Alahmad, "Physiological signal-based emotion recognition system," 2017 4th IEEE International 30 Conference on Engineering Technologies and Applied Sciences (ICETAS) , Salmabad, 2017,pp. 1-5.
[8] Chi Jung KIm, Min-Hyuk Chang, “Actual emotion and false emotion classification using physiological signals”, 2015 8th International Conference on Signal Processing, Image Processing and Pattern Recognition (SIP), pp 21-24, 2015.
[9] Byoung-Jun Park ; Changrak Yoon ; Eun-Hye Jang ; Do-Hyun Kim, “Physiological signals and recognition of negative emotions”, 2017 International Conference on Information and Communication Technology Convergence (ICTC),pp. 1074-1076, 18-20 Oct. 2017. [10] Chuan-Yu Chang ; Yu-Mon Lin ; Jun-Ying Zheng, “Physiological
Angry Emotion Detection Using Support Vector Regression”, 2012 15th International Conference on Network-Based Information Systems ,pp. 592-596, 20 November 2012.
[11] Basu, Saikat & Jana, Nabakumar & Bag, Arnab & M, Mahadevappa & Mukherjee, Jayanta& Kumar, Somesh & Guha, Rajlakshmi. (2015). “Emotion recognition based on physiological signals using valence-arousal model.”, 2015 Third International Conference on Image Information Processing (ICIIP), pp. 50-55,2015.
[12] Sander Koelstra, Christian Muhl, Mohammad Soleymani, Jong-Seok Lee, Ashkan Yazdani, Touradj Ebrahimi, Thierry Pun, Anton Nijholt and Ioannis Patras, “ DEAP: A Database for Emotion Analysis Using Physiological Signals”, IEEE Transactions on Affective Computing, pp. 18-31, 2012.